
Key Insights
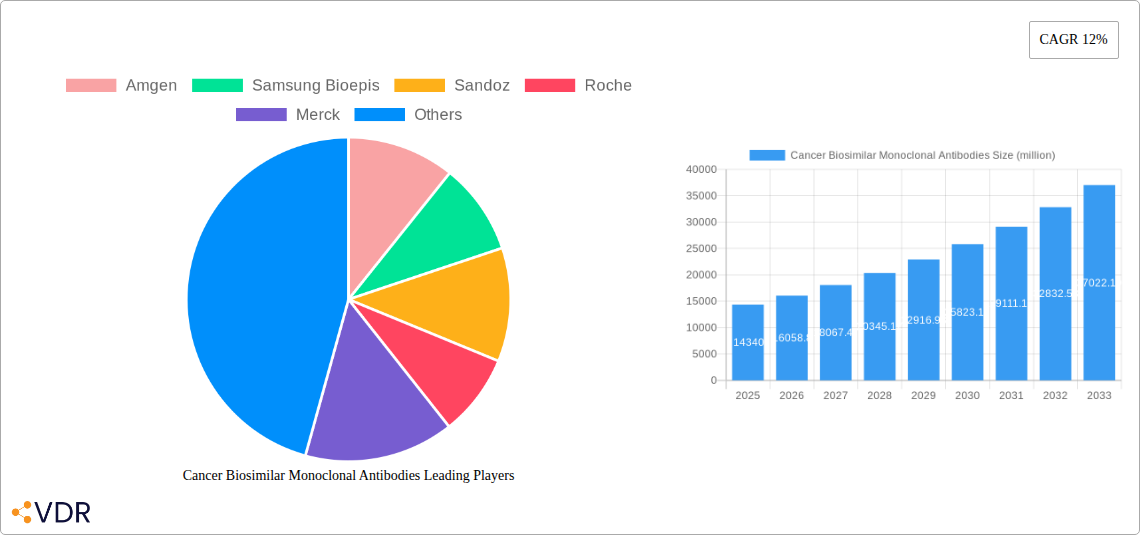
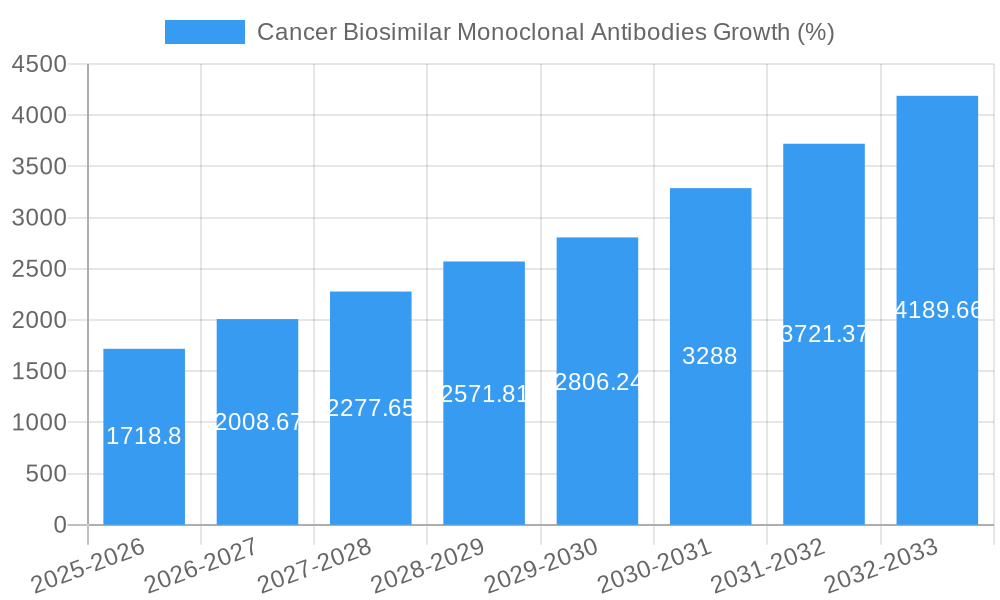
The global market for cancer biosimilar monoclonal antibodies is experiencing robust growth, projected to reach $14.34 billion in 2025 and exhibiting a Compound Annual Growth Rate (CAGR) of 12% from 2025 to 2033. This expansion is driven by several key factors. Firstly, the increasing prevalence of cancer globally fuels the demand for cost-effective treatment options. Biosimilars, offering comparable efficacy to their originator counterparts at significantly lower prices, are becoming increasingly attractive to healthcare systems and patients alike. Secondly, ongoing research and development efforts continue to expand the pipeline of biosimilar monoclonal antibodies targeting various cancer types, further solidifying market growth. Finally, supportive regulatory frameworks in major markets are streamlining the approval process for biosimilars, accelerating market entry and fostering competition. Leading players like Amgen, Samsung Bioepis, Roche, and others are aggressively investing in this space, leading to intensified competition and driving innovation.
However, market growth is not without its challenges. Pricing pressures, especially in price-sensitive markets, remain a significant factor. Furthermore, overcoming physician and patient hesitancy towards biosimilars, stemming from perceived differences in efficacy or safety compared to originator drugs, represents a crucial hurdle. The competitive landscape is fierce, requiring companies to focus on strategic partnerships, robust marketing campaigns, and demonstrating clear clinical equivalence to maintain their market share. Despite these restraints, the long-term outlook for cancer biosimilar monoclonal antibodies remains highly positive, driven by the increasing affordability and accessibility of cancer treatment. The market’s expansion will be significantly influenced by technological advancements, emerging markets' growing healthcare expenditure, and the ongoing expansion of biosimilar portfolios by major pharmaceutical companies.
Cancer Biosimilar Monoclonal Antibodies Market Report: 2019-2033
This comprehensive report provides a detailed analysis of the global Cancer Biosimilar Monoclonal Antibodies market, offering invaluable insights for industry professionals, investors, and researchers. The study period covers 2019-2033, with a base year of 2025 and a forecast period of 2025-2033. The report segments the market by key players, regions, and applications, providing a granular understanding of market dynamics and future growth potential. The total market size is projected to reach xx million units by 2033.
Cancer Biosimilar Monoclonal Antibodies Market Dynamics & Structure
This section analyzes the competitive landscape, technological advancements, regulatory influences, and market trends within the biosimilar monoclonal antibodies sector for cancer treatment. The market is characterized by a dynamic interplay between established pharmaceutical giants and emerging biosimilar developers.
Market Concentration: The market exhibits a moderately concentrated structure, with key players like Amgen, Samsung Bioepis, and Sandoz holding significant market share. However, the entry of numerous new players, particularly from Asia, is intensifying competition. The Herceptin biosimilar market, for example, shows a high degree of concentration initially, but competition is growing.
Technological Innovation: Continuous advancements in antibody engineering, manufacturing processes, and formulation technologies are driving the development of more effective and cost-efficient biosimilars. This includes innovative delivery systems to improve patient compliance and efficacy.
Regulatory Frameworks: Stringent regulatory approvals and biosimilarity assessments are crucial for market entry and acceptance. Variations in regulatory pathways across different geographies significantly impact market penetration.
Competitive Product Substitutes: Competition comes from both originator monoclonal antibodies and other cancer therapies (e.g., chemotherapy, targeted therapy). Price competition and superior efficacy are key battlegrounds.
End-User Demographics: The target market is driven by the increasing prevalence of various cancers and the growing demand for cost-effective treatment options. Aging populations in developed countries and rising cancer incidence in developing economies fuel market growth.
M&A Trends: Consolidation activities, including mergers and acquisitions, are prominent as larger companies seek to expand their biosimilar portfolios and enhance their market position. The number of M&A deals in this sector averaged xx per year during 2019-2024, with a total value of xx million units.
- Market Share (2024): Amgen (xx%), Samsung Bioepis (xx%), Sandoz (xx%), Others (xx%)
- M&A Deal Volume (2019-2024): xx
- Innovation Barriers: High R&D costs, stringent regulatory hurdles, and establishing biosimilarity.
Cancer Biosimilar Monoclonal Antibodies Growth Trends & Insights
The global cancer biosimilar monoclonal antibody market experienced significant growth during the historical period (2019-2024), driven primarily by increasing cancer prevalence, rising healthcare expenditure, and favorable government policies promoting biosimilar adoption. The market is projected to maintain a robust CAGR of xx% during the forecast period (2025-2033). Increased market penetration in emerging markets, coupled with the continuous launch of novel biosimilars targeting diverse cancer types, will contribute significantly to this growth. The adoption rate of biosimilars is increasing as healthcare systems seek cost-effective alternatives to originator biologics. Technological advancements in biosimilar development and manufacturing are leading to improved efficacy, safety, and affordability, further boosting market acceptance. Consumer behavior is shifting towards greater acceptance of biosimilars driven by the price advantage.
Dominant Regions, Countries, or Segments in Cancer Biosimilar Monoclonal Antibodies
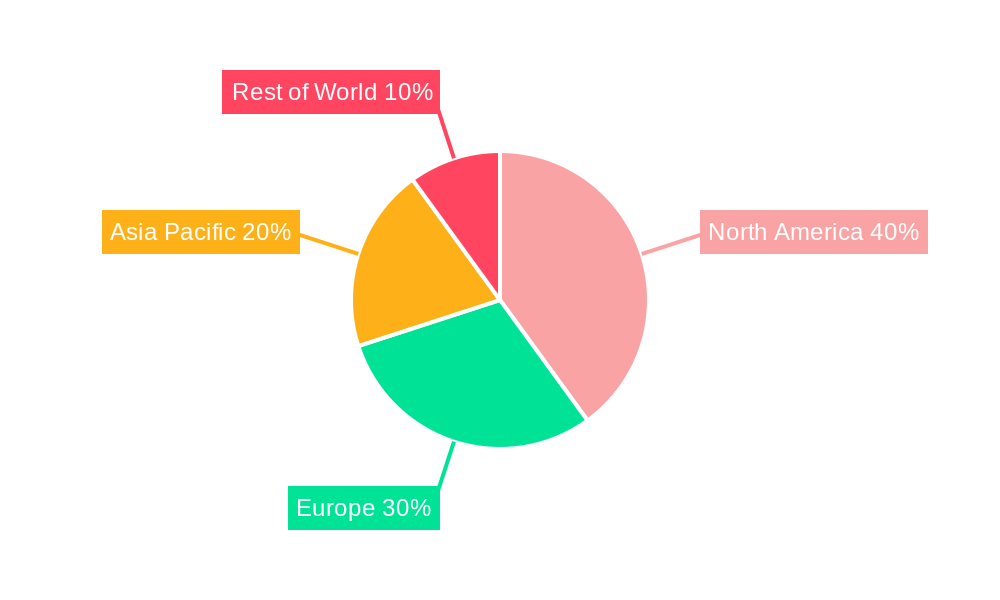
North America currently holds the largest market share, driven by high healthcare expenditure, strong regulatory frameworks, and a large patient population. However, Europe and Asia-Pacific are projected to exhibit faster growth rates during the forecast period.
- North America: High adoption rate, robust healthcare infrastructure, and favorable regulatory environment.
- Europe: Growing adoption due to cost-containment initiatives and increasing biosimilar approvals.
- Asia-Pacific: Rapid market expansion driven by rising cancer incidence, increasing healthcare spending, and favorable government policies.
Cancer Biosimilar Monoclonal Antibodies Product Landscape
The market encompasses a diverse range of biosimilars targeting various cancer types, including breast, colorectal, lung, and lymphoma cancers. These products vary in their formulation, delivery mechanisms, and efficacy. Recent innovations have focused on improving the stability, potency, and pharmacokinetics of biosimilar monoclonal antibodies. Several biosimilars are already showing comparable efficacy and safety profiles to their originator counterparts. The key selling points for biosimilars are their cost-effectiveness and equivalent therapeutic benefit, particularly important in cost-sensitive healthcare systems.
Key Drivers, Barriers & Challenges in Cancer Biosimilar Monoclonal Antibodies
Key Drivers:
- Increasing prevalence of cancer globally
- Rising healthcare expenditure and cost-containment initiatives
- Favorable government policies promoting biosimilar adoption
- Technological advancements leading to improved efficacy and affordability.
Key Challenges:
- Stringent regulatory approval pathways causing delays in market entry for new products.
- Biosimilarity concerns and skepticism amongst physicians and patients.
- Intense competition amongst biosimilar manufacturers resulting in price erosion.
- Supply chain disruptions and manufacturing capacity constraints.
Emerging Opportunities in Cancer Biosimilar Monoclonal Antibodies
Emerging opportunities include:
- Expansion into untapped markets in developing countries.
- Development of biosimilars targeting novel cancer targets.
- Personalized medicine approaches using biosimilars.
- Strategic partnerships between biosimilar manufacturers and healthcare providers.
Growth Accelerators in the Cancer Biosimilar Monoclonal Antibodies Industry
Technological breakthroughs in biosimilar development, coupled with strategic partnerships between biosimilar manufacturers and originator companies, are significant drivers of long-term growth. Expanding into emerging markets and developing innovative delivery systems will further boost market expansion. Increased physician education and patient awareness about biosimilars will play a crucial role in accelerating adoption rates.
Key Players Shaping the Cancer Biosimilar Monoclonal Antibodies Market
- Amgen
- Samsung Bioepis
- Sandoz
- Roche
- Merck
- Pfizer
- Mylan
- Bristol Myers Squibb
- Celltrion
- Biocon
- AbbVie
- Teva Pharmaceutical Industries
- Henlius
- Innovent Biologics
- Qilu Pharmaceutical
- Sunshine Guojian
- Bio-Thera Solutions
- Biotech Pharma
- Junshi Biosciences
Notable Milestones in Cancer Biosimilar Monoclonal Antibodies Sector
- 2020: Launch of a biosimilar to Rituximab in the European Union.
- 2021: Approval of a biosimilar to Trastuzumab in the US market.
- 2022: Several key partnerships formed between originator and biosimilar companies.
- 2023: Significant increase in biosimilar adoption rates in several key markets.
In-Depth Cancer Biosimilar Monoclonal Antibodies Market Outlook
The future of the cancer biosimilar monoclonal antibody market is exceptionally promising. Continued technological innovation, increased market penetration in emerging economies, and expanding product pipelines will drive substantial growth. Strategic collaborations and mergers & acquisitions will play a critical role in shaping the competitive landscape and accelerating market expansion. The long-term potential for this market is vast, with opportunities for significant returns for companies involved in development, manufacturing, and distribution.
Cancer Biosimilar Monoclonal Antibodies Segmentation
-
1. Application
- 1.1. Solid Tumor Treatment
- 1.2. Hematological System Tumor Treatment
- 1.3. Combination Therapy
-
2. Type
- 2.1. Mouse Derived Monoclonal Antibody
- 2.2. Human Mouse Chimeric Monoclonal Antibody
- 2.3. Human Derived Monoclonal Antibody
- 2.4. Fully Human Derived Monoclonal Antibody
Cancer Biosimilar Monoclonal Antibodies Segmentation By Geography
-
1. North America
- 1.1. United States
- 1.2. Canada
- 1.3. Mexico
-
2. South America
- 2.1. Brazil
- 2.2. Argentina
- 2.3. Rest of South America
-
3. Europe
- 3.1. United Kingdom
- 3.2. Germany
- 3.3. France
- 3.4. Italy
- 3.5. Spain
- 3.6. Russia
- 3.7. Benelux
- 3.8. Nordics
- 3.9. Rest of Europe
-
4. Middle East & Africa
- 4.1. Turkey
- 4.2. Israel
- 4.3. GCC
- 4.4. North Africa
- 4.5. South Africa
- 4.6. Rest of Middle East & Africa
-
5. Asia Pacific
- 5.1. China
- 5.2. India
- 5.3. Japan
- 5.4. South Korea
- 5.5. ASEAN
- 5.6. Oceania
- 5.7. Rest of Asia Pacific
Cancer Biosimilar Monoclonal Antibodies REPORT HIGHLIGHTS
| Aspects | Details |
|---|---|
| Study Period | 2019-2033 |
| Base Year | 2024 |
| Estimated Year | 2025 |
| Forecast Period | 2025-2033 |
| Historical Period | 2019-2024 |
| Growth Rate | CAGR of 12% from 2019-2033 |
| Segmentation |
|
Table of Contents
- 1. Introduction
- 1.1. Research Scope
- 1.2. Market Segmentation
- 1.3. Research Methodology
- 1.4. Definitions and Assumptions
- 2. Executive Summary
- 2.1. Introduction
- 3. Market Dynamics
- 3.1. Introduction
- 3.2. Market Drivers
- 3.3. Market Restrains
- 3.4. Market Trends
- 4. Market Factor Analysis
- 4.1. Porters Five Forces
- 4.2. Supply/Value Chain
- 4.3. PESTEL analysis
- 4.4. Market Entropy
- 4.5. Patent/Trademark Analysis
- 5. Global Cancer Biosimilar Monoclonal Antibodies Analysis, Insights and Forecast, 2019-2031
- 5.1. Market Analysis, Insights and Forecast - by Application
- 5.1.1. Solid Tumor Treatment
- 5.1.2. Hematological System Tumor Treatment
- 5.1.3. Combination Therapy
- 5.2. Market Analysis, Insights and Forecast - by Type
- 5.2.1. Mouse Derived Monoclonal Antibody
- 5.2.2. Human Mouse Chimeric Monoclonal Antibody
- 5.2.3. Human Derived Monoclonal Antibody
- 5.2.4. Fully Human Derived Monoclonal Antibody
- 5.3. Market Analysis, Insights and Forecast - by Region
- 5.3.1. North America
- 5.3.2. South America
- 5.3.3. Europe
- 5.3.4. Middle East & Africa
- 5.3.5. Asia Pacific
- 5.1. Market Analysis, Insights and Forecast - by Application
- 6. North America Cancer Biosimilar Monoclonal Antibodies Analysis, Insights and Forecast, 2019-2031
- 6.1. Market Analysis, Insights and Forecast - by Application
- 6.1.1. Solid Tumor Treatment
- 6.1.2. Hematological System Tumor Treatment
- 6.1.3. Combination Therapy
- 6.2. Market Analysis, Insights and Forecast - by Type
- 6.2.1. Mouse Derived Monoclonal Antibody
- 6.2.2. Human Mouse Chimeric Monoclonal Antibody
- 6.2.3. Human Derived Monoclonal Antibody
- 6.2.4. Fully Human Derived Monoclonal Antibody
- 6.1. Market Analysis, Insights and Forecast - by Application
- 7. South America Cancer Biosimilar Monoclonal Antibodies Analysis, Insights and Forecast, 2019-2031
- 7.1. Market Analysis, Insights and Forecast - by Application
- 7.1.1. Solid Tumor Treatment
- 7.1.2. Hematological System Tumor Treatment
- 7.1.3. Combination Therapy
- 7.2. Market Analysis, Insights and Forecast - by Type
- 7.2.1. Mouse Derived Monoclonal Antibody
- 7.2.2. Human Mouse Chimeric Monoclonal Antibody
- 7.2.3. Human Derived Monoclonal Antibody
- 7.2.4. Fully Human Derived Monoclonal Antibody
- 7.1. Market Analysis, Insights and Forecast - by Application
- 8. Europe Cancer Biosimilar Monoclonal Antibodies Analysis, Insights and Forecast, 2019-2031
- 8.1. Market Analysis, Insights and Forecast - by Application
- 8.1.1. Solid Tumor Treatment
- 8.1.2. Hematological System Tumor Treatment
- 8.1.3. Combination Therapy
- 8.2. Market Analysis, Insights and Forecast - by Type
- 8.2.1. Mouse Derived Monoclonal Antibody
- 8.2.2. Human Mouse Chimeric Monoclonal Antibody
- 8.2.3. Human Derived Monoclonal Antibody
- 8.2.4. Fully Human Derived Monoclonal Antibody
- 8.1. Market Analysis, Insights and Forecast - by Application
- 9. Middle East & Africa Cancer Biosimilar Monoclonal Antibodies Analysis, Insights and Forecast, 2019-2031
- 9.1. Market Analysis, Insights and Forecast - by Application
- 9.1.1. Solid Tumor Treatment
- 9.1.2. Hematological System Tumor Treatment
- 9.1.3. Combination Therapy
- 9.2. Market Analysis, Insights and Forecast - by Type
- 9.2.1. Mouse Derived Monoclonal Antibody
- 9.2.2. Human Mouse Chimeric Monoclonal Antibody
- 9.2.3. Human Derived Monoclonal Antibody
- 9.2.4. Fully Human Derived Monoclonal Antibody
- 9.1. Market Analysis, Insights and Forecast - by Application
- 10. Asia Pacific Cancer Biosimilar Monoclonal Antibodies Analysis, Insights and Forecast, 2019-2031
- 10.1. Market Analysis, Insights and Forecast - by Application
- 10.1.1. Solid Tumor Treatment
- 10.1.2. Hematological System Tumor Treatment
- 10.1.3. Combination Therapy
- 10.2. Market Analysis, Insights and Forecast - by Type
- 10.2.1. Mouse Derived Monoclonal Antibody
- 10.2.2. Human Mouse Chimeric Monoclonal Antibody
- 10.2.3. Human Derived Monoclonal Antibody
- 10.2.4. Fully Human Derived Monoclonal Antibody
- 10.1. Market Analysis, Insights and Forecast - by Application
- 11. Competitive Analysis
- 11.1. Global Market Share Analysis 2024
- 11.2. Company Profiles
- 11.2.1 Amgen
- 11.2.1.1. Overview
- 11.2.1.2. Products
- 11.2.1.3. SWOT Analysis
- 11.2.1.4. Recent Developments
- 11.2.1.5. Financials (Based on Availability)
- 11.2.2 Samsung Bioepis
- 11.2.2.1. Overview
- 11.2.2.2. Products
- 11.2.2.3. SWOT Analysis
- 11.2.2.4. Recent Developments
- 11.2.2.5. Financials (Based on Availability)
- 11.2.3 Sandoz
- 11.2.3.1. Overview
- 11.2.3.2. Products
- 11.2.3.3. SWOT Analysis
- 11.2.3.4. Recent Developments
- 11.2.3.5. Financials (Based on Availability)
- 11.2.4 Roche
- 11.2.4.1. Overview
- 11.2.4.2. Products
- 11.2.4.3. SWOT Analysis
- 11.2.4.4. Recent Developments
- 11.2.4.5. Financials (Based on Availability)
- 11.2.5 Merck
- 11.2.5.1. Overview
- 11.2.5.2. Products
- 11.2.5.3. SWOT Analysis
- 11.2.5.4. Recent Developments
- 11.2.5.5. Financials (Based on Availability)
- 11.2.6 Pfizer
- 11.2.6.1. Overview
- 11.2.6.2. Products
- 11.2.6.3. SWOT Analysis
- 11.2.6.4. Recent Developments
- 11.2.6.5. Financials (Based on Availability)
- 11.2.7 Mylan
- 11.2.7.1. Overview
- 11.2.7.2. Products
- 11.2.7.3. SWOT Analysis
- 11.2.7.4. Recent Developments
- 11.2.7.5. Financials (Based on Availability)
- 11.2.8 BristolMyers Squibb
- 11.2.8.1. Overview
- 11.2.8.2. Products
- 11.2.8.3. SWOT Analysis
- 11.2.8.4. Recent Developments
- 11.2.8.5. Financials (Based on Availability)
- 11.2.9 Celltrion
- 11.2.9.1. Overview
- 11.2.9.2. Products
- 11.2.9.3. SWOT Analysis
- 11.2.9.4. Recent Developments
- 11.2.9.5. Financials (Based on Availability)
- 11.2.10 Biocon
- 11.2.10.1. Overview
- 11.2.10.2. Products
- 11.2.10.3. SWOT Analysis
- 11.2.10.4. Recent Developments
- 11.2.10.5. Financials (Based on Availability)
- 11.2.11 AbbVie
- 11.2.11.1. Overview
- 11.2.11.2. Products
- 11.2.11.3. SWOT Analysis
- 11.2.11.4. Recent Developments
- 11.2.11.5. Financials (Based on Availability)
- 11.2.12 Teva Pharmaceutical Industries
- 11.2.12.1. Overview
- 11.2.12.2. Products
- 11.2.12.3. SWOT Analysis
- 11.2.12.4. Recent Developments
- 11.2.12.5. Financials (Based on Availability)
- 11.2.13 Henlius
- 11.2.13.1. Overview
- 11.2.13.2. Products
- 11.2.13.3. SWOT Analysis
- 11.2.13.4. Recent Developments
- 11.2.13.5. Financials (Based on Availability)
- 11.2.14 Innovent Biologics
- 11.2.14.1. Overview
- 11.2.14.2. Products
- 11.2.14.3. SWOT Analysis
- 11.2.14.4. Recent Developments
- 11.2.14.5. Financials (Based on Availability)
- 11.2.15 Qilu Pharmaceutical
- 11.2.15.1. Overview
- 11.2.15.2. Products
- 11.2.15.3. SWOT Analysis
- 11.2.15.4. Recent Developments
- 11.2.15.5. Financials (Based on Availability)
- 11.2.16 Sunshine Guojian
- 11.2.16.1. Overview
- 11.2.16.2. Products
- 11.2.16.3. SWOT Analysis
- 11.2.16.4. Recent Developments
- 11.2.16.5. Financials (Based on Availability)
- 11.2.17 Bio-Thera Solutions
- 11.2.17.1. Overview
- 11.2.17.2. Products
- 11.2.17.3. SWOT Analysis
- 11.2.17.4. Recent Developments
- 11.2.17.5. Financials (Based on Availability)
- 11.2.18 Biotech Pharma
- 11.2.18.1. Overview
- 11.2.18.2. Products
- 11.2.18.3. SWOT Analysis
- 11.2.18.4. Recent Developments
- 11.2.18.5. Financials (Based on Availability)
- 11.2.19 Junshi Biosciences
- 11.2.19.1. Overview
- 11.2.19.2. Products
- 11.2.19.3. SWOT Analysis
- 11.2.19.4. Recent Developments
- 11.2.19.5. Financials (Based on Availability)
- 11.2.1 Amgen
List of Figures
- Figure 1: Global Cancer Biosimilar Monoclonal Antibodies Revenue Breakdown (million, %) by Region 2024 & 2032
- Figure 2: North America Cancer Biosimilar Monoclonal Antibodies Revenue (million), by Application 2024 & 2032
- Figure 3: North America Cancer Biosimilar Monoclonal Antibodies Revenue Share (%), by Application 2024 & 2032
- Figure 4: North America Cancer Biosimilar Monoclonal Antibodies Revenue (million), by Type 2024 & 2032
- Figure 5: North America Cancer Biosimilar Monoclonal Antibodies Revenue Share (%), by Type 2024 & 2032
- Figure 6: North America Cancer Biosimilar Monoclonal Antibodies Revenue (million), by Country 2024 & 2032
- Figure 7: North America Cancer Biosimilar Monoclonal Antibodies Revenue Share (%), by Country 2024 & 2032
- Figure 8: South America Cancer Biosimilar Monoclonal Antibodies Revenue (million), by Application 2024 & 2032
- Figure 9: South America Cancer Biosimilar Monoclonal Antibodies Revenue Share (%), by Application 2024 & 2032
- Figure 10: South America Cancer Biosimilar Monoclonal Antibodies Revenue (million), by Type 2024 & 2032
- Figure 11: South America Cancer Biosimilar Monoclonal Antibodies Revenue Share (%), by Type 2024 & 2032
- Figure 12: South America Cancer Biosimilar Monoclonal Antibodies Revenue (million), by Country 2024 & 2032
- Figure 13: South America Cancer Biosimilar Monoclonal Antibodies Revenue Share (%), by Country 2024 & 2032
- Figure 14: Europe Cancer Biosimilar Monoclonal Antibodies Revenue (million), by Application 2024 & 2032
- Figure 15: Europe Cancer Biosimilar Monoclonal Antibodies Revenue Share (%), by Application 2024 & 2032
- Figure 16: Europe Cancer Biosimilar Monoclonal Antibodies Revenue (million), by Type 2024 & 2032
- Figure 17: Europe Cancer Biosimilar Monoclonal Antibodies Revenue Share (%), by Type 2024 & 2032
- Figure 18: Europe Cancer Biosimilar Monoclonal Antibodies Revenue (million), by Country 2024 & 2032
- Figure 19: Europe Cancer Biosimilar Monoclonal Antibodies Revenue Share (%), by Country 2024 & 2032
- Figure 20: Middle East & Africa Cancer Biosimilar Monoclonal Antibodies Revenue (million), by Application 2024 & 2032
- Figure 21: Middle East & Africa Cancer Biosimilar Monoclonal Antibodies Revenue Share (%), by Application 2024 & 2032
- Figure 22: Middle East & Africa Cancer Biosimilar Monoclonal Antibodies Revenue (million), by Type 2024 & 2032
- Figure 23: Middle East & Africa Cancer Biosimilar Monoclonal Antibodies Revenue Share (%), by Type 2024 & 2032
- Figure 24: Middle East & Africa Cancer Biosimilar Monoclonal Antibodies Revenue (million), by Country 2024 & 2032
- Figure 25: Middle East & Africa Cancer Biosimilar Monoclonal Antibodies Revenue Share (%), by Country 2024 & 2032
- Figure 26: Asia Pacific Cancer Biosimilar Monoclonal Antibodies Revenue (million), by Application 2024 & 2032
- Figure 27: Asia Pacific Cancer Biosimilar Monoclonal Antibodies Revenue Share (%), by Application 2024 & 2032
- Figure 28: Asia Pacific Cancer Biosimilar Monoclonal Antibodies Revenue (million), by Type 2024 & 2032
- Figure 29: Asia Pacific Cancer Biosimilar Monoclonal Antibodies Revenue Share (%), by Type 2024 & 2032
- Figure 30: Asia Pacific Cancer Biosimilar Monoclonal Antibodies Revenue (million), by Country 2024 & 2032
- Figure 31: Asia Pacific Cancer Biosimilar Monoclonal Antibodies Revenue Share (%), by Country 2024 & 2032
List of Tables
- Table 1: Global Cancer Biosimilar Monoclonal Antibodies Revenue million Forecast, by Region 2019 & 2032
- Table 2: Global Cancer Biosimilar Monoclonal Antibodies Revenue million Forecast, by Application 2019 & 2032
- Table 3: Global Cancer Biosimilar Monoclonal Antibodies Revenue million Forecast, by Type 2019 & 2032
- Table 4: Global Cancer Biosimilar Monoclonal Antibodies Revenue million Forecast, by Region 2019 & 2032
- Table 5: Global Cancer Biosimilar Monoclonal Antibodies Revenue million Forecast, by Application 2019 & 2032
- Table 6: Global Cancer Biosimilar Monoclonal Antibodies Revenue million Forecast, by Type 2019 & 2032
- Table 7: Global Cancer Biosimilar Monoclonal Antibodies Revenue million Forecast, by Country 2019 & 2032
- Table 8: United States Cancer Biosimilar Monoclonal Antibodies Revenue (million) Forecast, by Application 2019 & 2032
- Table 9: Canada Cancer Biosimilar Monoclonal Antibodies Revenue (million) Forecast, by Application 2019 & 2032
- Table 10: Mexico Cancer Biosimilar Monoclonal Antibodies Revenue (million) Forecast, by Application 2019 & 2032
- Table 11: Global Cancer Biosimilar Monoclonal Antibodies Revenue million Forecast, by Application 2019 & 2032
- Table 12: Global Cancer Biosimilar Monoclonal Antibodies Revenue million Forecast, by Type 2019 & 2032
- Table 13: Global Cancer Biosimilar Monoclonal Antibodies Revenue million Forecast, by Country 2019 & 2032
- Table 14: Brazil Cancer Biosimilar Monoclonal Antibodies Revenue (million) Forecast, by Application 2019 & 2032
- Table 15: Argentina Cancer Biosimilar Monoclonal Antibodies Revenue (million) Forecast, by Application 2019 & 2032
- Table 16: Rest of South America Cancer Biosimilar Monoclonal Antibodies Revenue (million) Forecast, by Application 2019 & 2032
- Table 17: Global Cancer Biosimilar Monoclonal Antibodies Revenue million Forecast, by Application 2019 & 2032
- Table 18: Global Cancer Biosimilar Monoclonal Antibodies Revenue million Forecast, by Type 2019 & 2032
- Table 19: Global Cancer Biosimilar Monoclonal Antibodies Revenue million Forecast, by Country 2019 & 2032
- Table 20: United Kingdom Cancer Biosimilar Monoclonal Antibodies Revenue (million) Forecast, by Application 2019 & 2032
- Table 21: Germany Cancer Biosimilar Monoclonal Antibodies Revenue (million) Forecast, by Application 2019 & 2032
- Table 22: France Cancer Biosimilar Monoclonal Antibodies Revenue (million) Forecast, by Application 2019 & 2032
- Table 23: Italy Cancer Biosimilar Monoclonal Antibodies Revenue (million) Forecast, by Application 2019 & 2032
- Table 24: Spain Cancer Biosimilar Monoclonal Antibodies Revenue (million) Forecast, by Application 2019 & 2032
- Table 25: Russia Cancer Biosimilar Monoclonal Antibodies Revenue (million) Forecast, by Application 2019 & 2032
- Table 26: Benelux Cancer Biosimilar Monoclonal Antibodies Revenue (million) Forecast, by Application 2019 & 2032
- Table 27: Nordics Cancer Biosimilar Monoclonal Antibodies Revenue (million) Forecast, by Application 2019 & 2032
- Table 28: Rest of Europe Cancer Biosimilar Monoclonal Antibodies Revenue (million) Forecast, by Application 2019 & 2032
- Table 29: Global Cancer Biosimilar Monoclonal Antibodies Revenue million Forecast, by Application 2019 & 2032
- Table 30: Global Cancer Biosimilar Monoclonal Antibodies Revenue million Forecast, by Type 2019 & 2032
- Table 31: Global Cancer Biosimilar Monoclonal Antibodies Revenue million Forecast, by Country 2019 & 2032
- Table 32: Turkey Cancer Biosimilar Monoclonal Antibodies Revenue (million) Forecast, by Application 2019 & 2032
- Table 33: Israel Cancer Biosimilar Monoclonal Antibodies Revenue (million) Forecast, by Application 2019 & 2032
- Table 34: GCC Cancer Biosimilar Monoclonal Antibodies Revenue (million) Forecast, by Application 2019 & 2032
- Table 35: North Africa Cancer Biosimilar Monoclonal Antibodies Revenue (million) Forecast, by Application 2019 & 2032
- Table 36: South Africa Cancer Biosimilar Monoclonal Antibodies Revenue (million) Forecast, by Application 2019 & 2032
- Table 37: Rest of Middle East & Africa Cancer Biosimilar Monoclonal Antibodies Revenue (million) Forecast, by Application 2019 & 2032
- Table 38: Global Cancer Biosimilar Monoclonal Antibodies Revenue million Forecast, by Application 2019 & 2032
- Table 39: Global Cancer Biosimilar Monoclonal Antibodies Revenue million Forecast, by Type 2019 & 2032
- Table 40: Global Cancer Biosimilar Monoclonal Antibodies Revenue million Forecast, by Country 2019 & 2032
- Table 41: China Cancer Biosimilar Monoclonal Antibodies Revenue (million) Forecast, by Application 2019 & 2032
- Table 42: India Cancer Biosimilar Monoclonal Antibodies Revenue (million) Forecast, by Application 2019 & 2032
- Table 43: Japan Cancer Biosimilar Monoclonal Antibodies Revenue (million) Forecast, by Application 2019 & 2032
- Table 44: South Korea Cancer Biosimilar Monoclonal Antibodies Revenue (million) Forecast, by Application 2019 & 2032
- Table 45: ASEAN Cancer Biosimilar Monoclonal Antibodies Revenue (million) Forecast, by Application 2019 & 2032
- Table 46: Oceania Cancer Biosimilar Monoclonal Antibodies Revenue (million) Forecast, by Application 2019 & 2032
- Table 47: Rest of Asia Pacific Cancer Biosimilar Monoclonal Antibodies Revenue (million) Forecast, by Application 2019 & 2032
Frequently Asked Questions
1. What is the projected Compound Annual Growth Rate (CAGR) of the Cancer Biosimilar Monoclonal Antibodies?
The projected CAGR is approximately 12%.
2. Which companies are prominent players in the Cancer Biosimilar Monoclonal Antibodies?
Key companies in the market include Amgen, Samsung Bioepis, Sandoz, Roche, Merck, Pfizer, Mylan, BristolMyers Squibb, Celltrion, Biocon, AbbVie, Teva Pharmaceutical Industries, Henlius, Innovent Biologics, Qilu Pharmaceutical, Sunshine Guojian, Bio-Thera Solutions, Biotech Pharma, Junshi Biosciences.
3. What are the main segments of the Cancer Biosimilar Monoclonal Antibodies?
The market segments include Application, Type.
4. Can you provide details about the market size?
The market size is estimated to be USD 14340 million as of 2022.
5. What are some drivers contributing to market growth?
N/A
6. What are the notable trends driving market growth?
N/A
7. Are there any restraints impacting market growth?
N/A
8. Can you provide examples of recent developments in the market?
N/A
9. What pricing options are available for accessing the report?
Pricing options include single-user, multi-user, and enterprise licenses priced at USD 4900.00, USD 7350.00, and USD 9800.00 respectively.
10. Is the market size provided in terms of value or volume?
The market size is provided in terms of value, measured in million.
11. Are there any specific market keywords associated with the report?
Yes, the market keyword associated with the report is "Cancer Biosimilar Monoclonal Antibodies," which aids in identifying and referencing the specific market segment covered.
12. How do I determine which pricing option suits my needs best?
The pricing options vary based on user requirements and access needs. Individual users may opt for single-user licenses, while businesses requiring broader access may choose multi-user or enterprise licenses for cost-effective access to the report.
13. Are there any additional resources or data provided in the Cancer Biosimilar Monoclonal Antibodies report?
While the report offers comprehensive insights, it's advisable to review the specific contents or supplementary materials provided to ascertain if additional resources or data are available.
14. How can I stay updated on further developments or reports in the Cancer Biosimilar Monoclonal Antibodies?
To stay informed about further developments, trends, and reports in the Cancer Biosimilar Monoclonal Antibodies, consider subscribing to industry newsletters, following relevant companies and organizations, or regularly checking reputable industry news sources and publications.
Methodology
Step 1 - Identification of Relevant Samples Size from Population Database


Step 2 - Approaches for Defining Global Market Size (Value, Volume* & Price*)

Note*: In applicable scenarios
Step 3 - Data Sources
Primary Research
- Web Analytics
- Survey Reports
- Research Institute
- Latest Research Reports
- Opinion Leaders
Secondary Research
- Annual Reports
- White Paper
- Latest Press Release
- Industry Association
- Paid Database
- Investor Presentations

Step 4 - Data Triangulation
Involves using different sources of information in order to increase the validity of a study
These sources are likely to be stakeholders in a program - participants, other researchers, program staff, other community members, and so on.
Then we put all data in single framework & apply various statistical tools to find out the dynamic on the market.
During the analysis stage, feedback from the stakeholder groups would be compared to determine areas of agreement as well as areas of divergence


