


Key Insights
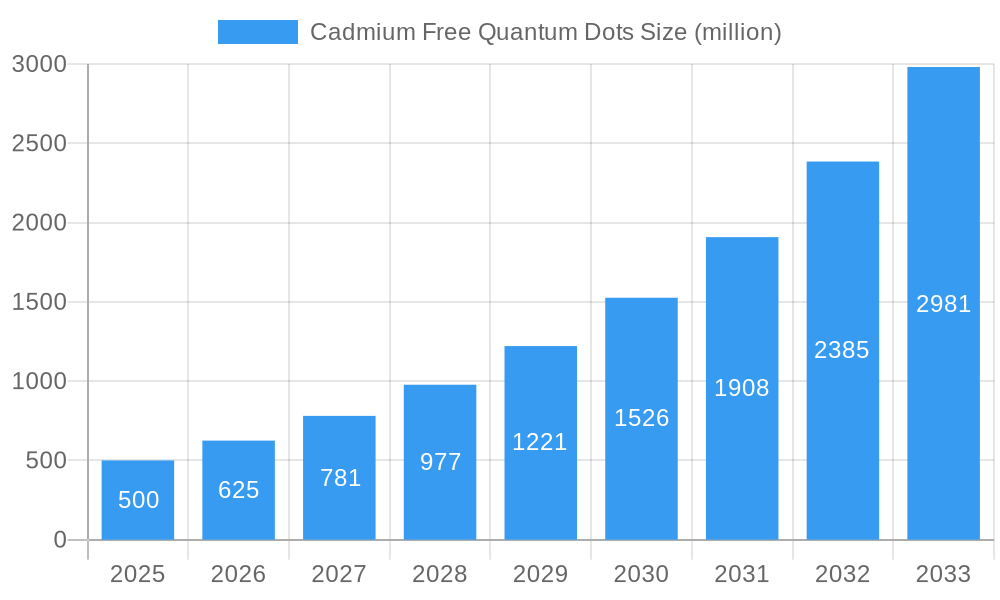
The cadmium-free quantum dots (QDs) market is experiencing robust growth, driven by increasing demand for eco-friendly and high-performance display technologies. The market's expansion is fueled by stringent regulations against cadmium-based QDs due to their toxicity, creating a significant opportunity for safer alternatives. Advancements in materials science have led to the development of cadmium-free QDs utilizing materials like InP, ZnSe, and CuInS2, which offer comparable or even superior performance in terms of color purity, brightness, and stability. The rising adoption of QDs in various applications, including displays for smartphones, televisions, and other consumer electronics, along with their increasing use in bioimaging and medical diagnostics, are key factors propelling market expansion. We project a healthy compound annual growth rate (CAGR) of 25% for the cadmium-free QD market between 2025 and 2033, with the market size reaching approximately $2.5 billion by 2033, starting from an estimated $500 million in 2025. This growth is expected to be fueled by continuous innovation in QD synthesis, improved cost-effectiveness, and increasing consumer preference for sustainable technologies.
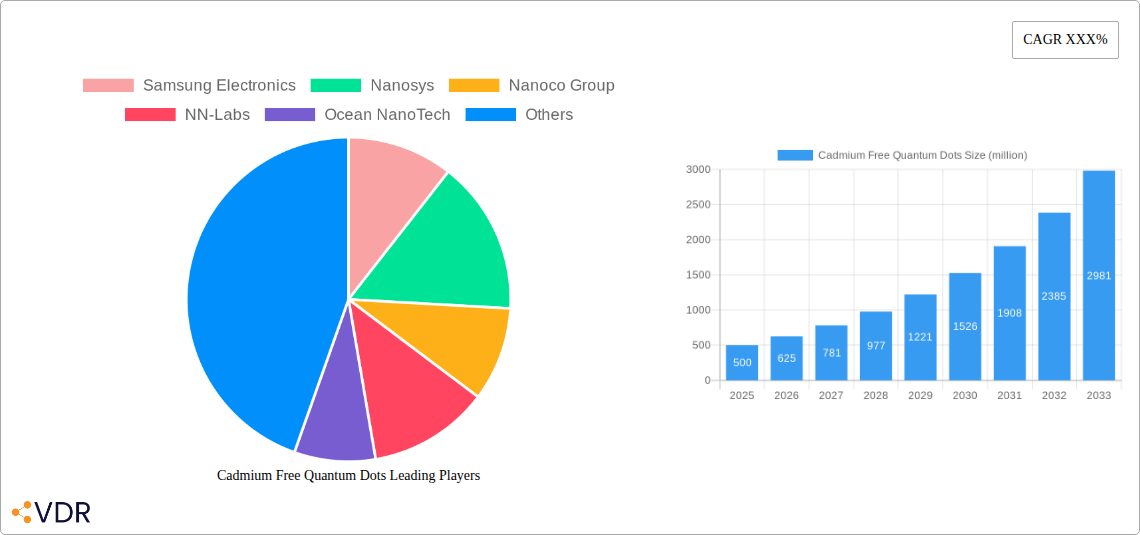
Cadmium Free Quantum Dots Market Size (In Million)

Despite the positive market outlook, challenges remain. High production costs compared to traditional display technologies remain a barrier to wider adoption, especially in cost-sensitive markets. Furthermore, achieving consistent performance and scalability across various production processes is crucial for commercial success. However, ongoing research and development efforts are focused on addressing these limitations. Major players in the industry, including Samsung Electronics, Nanosys, and others, are investing heavily in research and development, optimizing production processes, and expanding their manufacturing capabilities. This strategic investment promises to alleviate cost pressures and improve the overall efficiency of cadmium-free QD production, ultimately accelerating market penetration.
Cadmium Free Quantum Dots Company Market Share
Cadmium Free Quantum Dots Market Report: 2019-2033
This comprehensive report provides an in-depth analysis of the cadmium-free quantum dots market, encompassing market dynamics, growth trends, regional dominance, product landscape, key players, and future outlook. The study period spans from 2019 to 2033, with 2025 serving as the base and estimated year. The forecast period covers 2025-2033, while the historical period encompasses 2019-2024. This report is crucial for industry professionals, investors, and researchers seeking to understand and capitalize on the burgeoning opportunities within this rapidly evolving market. The total market value in 2025 is estimated at $XX million, projected to reach $XX million by 2033.
Cadmium Free Quantum Dots Market Dynamics & Structure
The cadmium-free quantum dots market is experiencing significant growth driven by increasing demand for eco-friendly and high-performance materials across various applications. Market concentration is moderate, with several key players holding significant market share, but a fragmented landscape of smaller companies also contributes to innovation. Technological advancements, particularly in synthesis and surface passivation techniques, are key drivers. Stringent environmental regulations regarding cadmium-based quantum dots are fueling market adoption of cadmium-free alternatives. The emergence of competitive substitutes, such as perovskite nanocrystals, poses a challenge, but the unique properties of cadmium-free quantum dots continue to maintain strong market appeal. Mergers and acquisitions (M&A) activity has been relatively modest in recent years, with xx deals recorded between 2019-2024, indicating a potential for increased consolidation in the future. End-user demographics are diverse, spanning display technologies, bioimaging, solar energy, and lighting.
- Market Concentration: Moderately concentrated, with top 5 players holding approximately xx% of market share in 2025.
- Technological Innovation: Focus on improving quantum yield, brightness, and color purity of cadmium-free quantum dots.
- Regulatory Framework: Stringent regulations against cadmium-containing products are driving market growth.
- Competitive Substitutes: Perovskite nanocrystals and other nanomaterials pose a competitive threat.
- M&A Activity: xx deals between 2019 and 2024, with potential for increased consolidation.
- Innovation Barriers: High manufacturing costs and challenges in achieving consistent quality.
Cadmium Free Quantum Dots Growth Trends & Insights
The cadmium-free quantum dots market is witnessing robust growth, primarily driven by the increasing adoption of these materials in various applications. The market size experienced a Compound Annual Growth Rate (CAGR) of xx% during the historical period (2019-2024) and is projected to grow at a CAGR of xx% during the forecast period (2025-2033). This growth is fueled by advancements in synthesis techniques leading to improved performance characteristics, cost reductions, and expanding applications across various sectors. Consumer preference for eco-friendly and high-performance products significantly influences the market adoption rate. Technological disruptions, such as the development of novel synthesis methods, are continuously enhancing the properties of these materials, making them more attractive for different applications. The market penetration rate is expected to increase from xx% in 2025 to xx% by 2033, driven by growing awareness of the benefits of cadmium-free quantum dots.
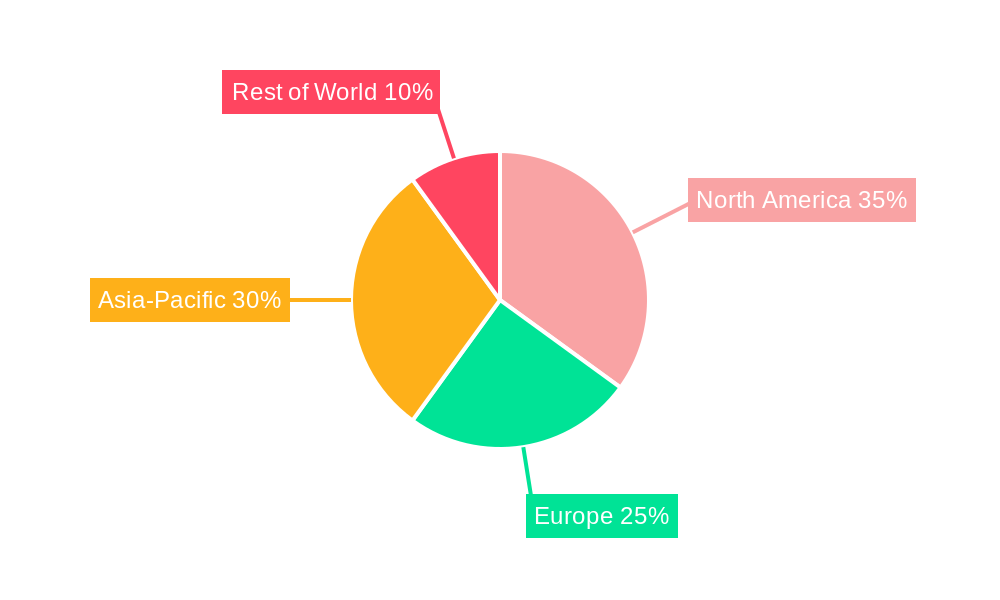
Dominant Regions, Countries, or Segments in Cadmium Free Quantum Dots
North America currently holds the largest market share, driven by strong R&D activities, a robust consumer electronics industry, and supportive government policies promoting sustainable technologies. Asia-Pacific is projected to experience the fastest growth due to the booming display manufacturing sector and the increasing adoption of these materials in various applications within this region. Specific countries like China, South Korea, and the United States are at the forefront of cadmium-free quantum dots development and deployment, driven by their advanced technological capabilities and high consumer demand. The display technology segment is the dominant application, fueled by the superior color rendition and energy efficiency of cadmium-free quantum dots in TVs, smartphones, and other displays.
- Key Drivers in North America: Strong R&D investments, established consumer electronics industry, supportive government regulations.
- Key Drivers in Asia-Pacific: Rapid growth of display manufacturing, increasing adoption in consumer electronics and lighting.
- Dominant Segment: Display technology (TVs, smartphones, monitors) accounts for the largest market share.
- Market Share: North America (xx%), Asia-Pacific (xx%), Europe (xx%), Rest of World (xx%) in 2025.
Cadmium Free Quantum Dots Product Landscape
Cadmium-free quantum dots are available in a range of sizes and compositions, offering diverse optical properties, including tunable emission wavelengths across the visible spectrum and near-infrared regions. Recent innovations focus on improving quantum yield, photostability, and water solubility. These advancements are expanding the range of applications, from high-definition displays to bioimaging and sensing. Unique selling propositions include superior color purity, high brightness, and energy efficiency compared to traditional materials. Technological advancements, such as ligand exchange techniques and surface passivation strategies, are crucial in addressing challenges related to aggregation and stability.
Key Drivers, Barriers & Challenges in Cadmium Free Quantum Dots
Key Drivers:
- Growing demand for eco-friendly materials.
- Increasing applications in displays, bioimaging, and lighting.
- Technological advancements leading to improved performance and cost reduction.
- Stringent regulations banning cadmium-based quantum dots.
Challenges & Restraints:
- High manufacturing costs, particularly for high-quality, high-yield products.
- Challenges in achieving consistent size and shape control during synthesis.
- Limited long-term stability and durability in certain applications.
- Competition from alternative nanomaterials such as perovskites. The impact of these restraints on market growth is estimated at xx% in 2025.
Emerging Opportunities in Cadmium Free Quantum Dots
Untapped markets in emerging economies present significant opportunities. Innovative applications in solar energy conversion, biomedicine, and advanced sensors are also promising areas. Evolving consumer preferences for sustainable and high-performance products are driving market expansion. The development of novel synthesis methods and improved surface functionalization strategies is creating new possibilities for diverse applications.
Growth Accelerators in the Cadmium Free Quantum Dots Industry
Technological breakthroughs in synthesis and surface modification are key growth catalysts. Strategic partnerships between material suppliers, display manufacturers, and research institutions are also crucial. Market expansion into new applications and geographic regions is driving significant growth. The continued development of cost-effective manufacturing processes is expected to further boost market adoption.
Key Players Shaping the Cadmium Free Quantum Dots Market
- Samsung Electronics
- Nanosys
- Nanoco Group
- NN-Labs
- Ocean NanoTech
- Quantum Materials
- OSRAM Licht
- Avantama
- Navillum Nanotechnologies
- Crystalplex Corporation
- RANOVUS
- Innolume
- QUANTUM SOLUTIONS
- NanoPhotonica
- UbiQD
- Fraunhofer IAP
- TCL
- VIZIO
- Hisense
- QD Lasers
Notable Milestones in Cadmium Free Quantum Dots Sector
- 2020: Nanosys announces improved synthesis technology for high-yield cadmium-free quantum dots.
- 2021: Samsung Electronics launches a new line of QLED TVs utilizing cadmium-free quantum dots.
- 2022: Several companies announce strategic partnerships to develop new applications for cadmium-free quantum dots in biomedicine.
- 2023: Significant advancements reported in improving the long-term stability of cadmium-free quantum dots for display applications.
In-Depth Cadmium Free Quantum Dots Market Outlook
The cadmium-free quantum dots market is poised for significant growth over the next decade. Continued technological advancements, strategic partnerships, and expanding applications will drive market expansion. The focus on sustainable and high-performance materials will further strengthen market demand. Opportunities in new sectors, coupled with continuous innovation in materials science, will shape the future trajectory of this market, creating promising avenues for investment and growth.
Cadmium Free Quantum Dots Segmentation
-
1. Application
- 1.1. Optoelectronics and Optical Components
- 1.2. Medicine
- 1.3. Agriculture
- 1.4. Other
-
2. Type
- 2.1. III-V Semiconductor
- 2.2. II-VI Semiconductor
- 2.3. Other
Cadmium Free Quantum Dots Segmentation By Geography
-
1. North America
- 1.1. United States
- 1.2. Canada
- 1.3. Mexico
-
2. South America
- 2.1. Brazil
- 2.2. Argentina
- 2.3. Rest of South America
-
3. Europe
- 3.1. United Kingdom
- 3.2. Germany
- 3.3. France
- 3.4. Italy
- 3.5. Spain
- 3.6. Russia
- 3.7. Benelux
- 3.8. Nordics
- 3.9. Rest of Europe
-
4. Middle East & Africa
- 4.1. Turkey
- 4.2. Israel
- 4.3. GCC
- 4.4. North Africa
- 4.5. South Africa
- 4.6. Rest of Middle East & Africa
-
5. Asia Pacific
- 5.1. China
- 5.2. India
- 5.3. Japan
- 5.4. South Korea
- 5.5. ASEAN
- 5.6. Oceania
- 5.7. Rest of Asia Pacific
Cadmium Free Quantum Dots Regional Market Share
Geographic Coverage of Cadmium Free Quantum Dots
Cadmium Free Quantum Dots REPORT HIGHLIGHTS
| Aspects | Details |
|---|---|
| Study Period | 2020-2034 |
| Base Year | 2025 |
| Estimated Year | 2026 |
| Forecast Period | 2026-2034 |
| Historical Period | 2020-2025 |
| Growth Rate | CAGR of XXX% from 2020-2034 |
| Segmentation |
|
Table of Contents
- 1. Introduction
- 1.1. Research Scope
- 1.2. Market Segmentation
- 1.3. Research Methodology
- 1.4. Definitions and Assumptions
- 2. Executive Summary
- 2.1. Introduction
- 3. Market Dynamics
- 3.1. Introduction
- 3.2. Market Drivers
- 3.3. Market Restrains
- 3.4. Market Trends
- 4. Market Factor Analysis
- 4.1. Porters Five Forces
- 4.2. Supply/Value Chain
- 4.3. PESTEL analysis
- 4.4. Market Entropy
- 4.5. Patent/Trademark Analysis
- 5. Global Cadmium Free Quantum Dots Analysis, Insights and Forecast, 2020-2032
- 5.1. Market Analysis, Insights and Forecast - by Application
- 5.1.1. Optoelectronics and Optical Components
- 5.1.2. Medicine
- 5.1.3. Agriculture
- 5.1.4. Other
- 5.2. Market Analysis, Insights and Forecast - by Type
- 5.2.1. III-V Semiconductor
- 5.2.2. II-VI Semiconductor
- 5.2.3. Other
- 5.3. Market Analysis, Insights and Forecast - by Region
- 5.3.1. North America
- 5.3.2. South America
- 5.3.3. Europe
- 5.3.4. Middle East & Africa
- 5.3.5. Asia Pacific
- 5.1. Market Analysis, Insights and Forecast - by Application
- 6. North America Cadmium Free Quantum Dots Analysis, Insights and Forecast, 2020-2032
- 6.1. Market Analysis, Insights and Forecast - by Application
- 6.1.1. Optoelectronics and Optical Components
- 6.1.2. Medicine
- 6.1.3. Agriculture
- 6.1.4. Other
- 6.2. Market Analysis, Insights and Forecast - by Type
- 6.2.1. III-V Semiconductor
- 6.2.2. II-VI Semiconductor
- 6.2.3. Other
- 6.1. Market Analysis, Insights and Forecast - by Application
- 7. South America Cadmium Free Quantum Dots Analysis, Insights and Forecast, 2020-2032
- 7.1. Market Analysis, Insights and Forecast - by Application
- 7.1.1. Optoelectronics and Optical Components
- 7.1.2. Medicine
- 7.1.3. Agriculture
- 7.1.4. Other
- 7.2. Market Analysis, Insights and Forecast - by Type
- 7.2.1. III-V Semiconductor
- 7.2.2. II-VI Semiconductor
- 7.2.3. Other
- 7.1. Market Analysis, Insights and Forecast - by Application
- 8. Europe Cadmium Free Quantum Dots Analysis, Insights and Forecast, 2020-2032
- 8.1. Market Analysis, Insights and Forecast - by Application
- 8.1.1. Optoelectronics and Optical Components
- 8.1.2. Medicine
- 8.1.3. Agriculture
- 8.1.4. Other
- 8.2. Market Analysis, Insights and Forecast - by Type
- 8.2.1. III-V Semiconductor
- 8.2.2. II-VI Semiconductor
- 8.2.3. Other
- 8.1. Market Analysis, Insights and Forecast - by Application
- 9. Middle East & Africa Cadmium Free Quantum Dots Analysis, Insights and Forecast, 2020-2032
- 9.1. Market Analysis, Insights and Forecast - by Application
- 9.1.1. Optoelectronics and Optical Components
- 9.1.2. Medicine
- 9.1.3. Agriculture
- 9.1.4. Other
- 9.2. Market Analysis, Insights and Forecast - by Type
- 9.2.1. III-V Semiconductor
- 9.2.2. II-VI Semiconductor
- 9.2.3. Other
- 9.1. Market Analysis, Insights and Forecast - by Application
- 10. Asia Pacific Cadmium Free Quantum Dots Analysis, Insights and Forecast, 2020-2032
- 10.1. Market Analysis, Insights and Forecast - by Application
- 10.1.1. Optoelectronics and Optical Components
- 10.1.2. Medicine
- 10.1.3. Agriculture
- 10.1.4. Other
- 10.2. Market Analysis, Insights and Forecast - by Type
- 10.2.1. III-V Semiconductor
- 10.2.2. II-VI Semiconductor
- 10.2.3. Other
- 10.1. Market Analysis, Insights and Forecast - by Application
- 11. Competitive Analysis
- 11.1. Global Market Share Analysis 2025
- 11.2. Company Profiles
- 11.2.1 Samsung Electronics
- 11.2.1.1. Overview
- 11.2.1.2. Products
- 11.2.1.3. SWOT Analysis
- 11.2.1.4. Recent Developments
- 11.2.1.5. Financials (Based on Availability)
- 11.2.2 Nanosys
- 11.2.2.1. Overview
- 11.2.2.2. Products
- 11.2.2.3. SWOT Analysis
- 11.2.2.4. Recent Developments
- 11.2.2.5. Financials (Based on Availability)
- 11.2.3 Nanoco Group
- 11.2.3.1. Overview
- 11.2.3.2. Products
- 11.2.3.3. SWOT Analysis
- 11.2.3.4. Recent Developments
- 11.2.3.5. Financials (Based on Availability)
- 11.2.4 NN-Labs
- 11.2.4.1. Overview
- 11.2.4.2. Products
- 11.2.4.3. SWOT Analysis
- 11.2.4.4. Recent Developments
- 11.2.4.5. Financials (Based on Availability)
- 11.2.5 Ocean NanoTech
- 11.2.5.1. Overview
- 11.2.5.2. Products
- 11.2.5.3. SWOT Analysis
- 11.2.5.4. Recent Developments
- 11.2.5.5. Financials (Based on Availability)
- 11.2.6 Quantum Materials
- 11.2.6.1. Overview
- 11.2.6.2. Products
- 11.2.6.3. SWOT Analysis
- 11.2.6.4. Recent Developments
- 11.2.6.5. Financials (Based on Availability)
- 11.2.7 OSRAM Licht
- 11.2.7.1. Overview
- 11.2.7.2. Products
- 11.2.7.3. SWOT Analysis
- 11.2.7.4. Recent Developments
- 11.2.7.5. Financials (Based on Availability)
- 11.2.8 Avantama
- 11.2.8.1. Overview
- 11.2.8.2. Products
- 11.2.8.3. SWOT Analysis
- 11.2.8.4. Recent Developments
- 11.2.8.5. Financials (Based on Availability)
- 11.2.9 Navillum Nanotechnologies
- 11.2.9.1. Overview
- 11.2.9.2. Products
- 11.2.9.3. SWOT Analysis
- 11.2.9.4. Recent Developments
- 11.2.9.5. Financials (Based on Availability)
- 11.2.10 Crystalplex Corporation
- 11.2.10.1. Overview
- 11.2.10.2. Products
- 11.2.10.3. SWOT Analysis
- 11.2.10.4. Recent Developments
- 11.2.10.5. Financials (Based on Availability)
- 11.2.11 RANOVUS
- 11.2.11.1. Overview
- 11.2.11.2. Products
- 11.2.11.3. SWOT Analysis
- 11.2.11.4. Recent Developments
- 11.2.11.5. Financials (Based on Availability)
- 11.2.12 Innolume
- 11.2.12.1. Overview
- 11.2.12.2. Products
- 11.2.12.3. SWOT Analysis
- 11.2.12.4. Recent Developments
- 11.2.12.5. Financials (Based on Availability)
- 11.2.13 QUANTUM SOLUTIONS
- 11.2.13.1. Overview
- 11.2.13.2. Products
- 11.2.13.3. SWOT Analysis
- 11.2.13.4. Recent Developments
- 11.2.13.5. Financials (Based on Availability)
- 11.2.14 NanoPhotonica
- 11.2.14.1. Overview
- 11.2.14.2. Products
- 11.2.14.3. SWOT Analysis
- 11.2.14.4. Recent Developments
- 11.2.14.5. Financials (Based on Availability)
- 11.2.15 UbiQD
- 11.2.15.1. Overview
- 11.2.15.2. Products
- 11.2.15.3. SWOT Analysis
- 11.2.15.4. Recent Developments
- 11.2.15.5. Financials (Based on Availability)
- 11.2.16 Fraunhofer IAP
- 11.2.16.1. Overview
- 11.2.16.2. Products
- 11.2.16.3. SWOT Analysis
- 11.2.16.4. Recent Developments
- 11.2.16.5. Financials (Based on Availability)
- 11.2.17 TCL
- 11.2.17.1. Overview
- 11.2.17.2. Products
- 11.2.17.3. SWOT Analysis
- 11.2.17.4. Recent Developments
- 11.2.17.5. Financials (Based on Availability)
- 11.2.18 VIZIO
- 11.2.18.1. Overview
- 11.2.18.2. Products
- 11.2.18.3. SWOT Analysis
- 11.2.18.4. Recent Developments
- 11.2.18.5. Financials (Based on Availability)
- 11.2.19 Hisense
- 11.2.19.1. Overview
- 11.2.19.2. Products
- 11.2.19.3. SWOT Analysis
- 11.2.19.4. Recent Developments
- 11.2.19.5. Financials (Based on Availability)
- 11.2.20 QD Lasers
- 11.2.20.1. Overview
- 11.2.20.2. Products
- 11.2.20.3. SWOT Analysis
- 11.2.20.4. Recent Developments
- 11.2.20.5. Financials (Based on Availability)
- 11.2.1 Samsung Electronics
List of Figures
- Figure 1: Global Cadmium Free Quantum Dots Revenue Breakdown (million, %) by Region 2025 & 2033
- Figure 2: North America Cadmium Free Quantum Dots Revenue (million), by Application 2025 & 2033
- Figure 3: North America Cadmium Free Quantum Dots Revenue Share (%), by Application 2025 & 2033
- Figure 4: North America Cadmium Free Quantum Dots Revenue (million), by Type 2025 & 2033
- Figure 5: North America Cadmium Free Quantum Dots Revenue Share (%), by Type 2025 & 2033
- Figure 6: North America Cadmium Free Quantum Dots Revenue (million), by Country 2025 & 2033
- Figure 7: North America Cadmium Free Quantum Dots Revenue Share (%), by Country 2025 & 2033
- Figure 8: South America Cadmium Free Quantum Dots Revenue (million), by Application 2025 & 2033
- Figure 9: South America Cadmium Free Quantum Dots Revenue Share (%), by Application 2025 & 2033
- Figure 10: South America Cadmium Free Quantum Dots Revenue (million), by Type 2025 & 2033
- Figure 11: South America Cadmium Free Quantum Dots Revenue Share (%), by Type 2025 & 2033
- Figure 12: South America Cadmium Free Quantum Dots Revenue (million), by Country 2025 & 2033
- Figure 13: South America Cadmium Free Quantum Dots Revenue Share (%), by Country 2025 & 2033
- Figure 14: Europe Cadmium Free Quantum Dots Revenue (million), by Application 2025 & 2033
- Figure 15: Europe Cadmium Free Quantum Dots Revenue Share (%), by Application 2025 & 2033
- Figure 16: Europe Cadmium Free Quantum Dots Revenue (million), by Type 2025 & 2033
- Figure 17: Europe Cadmium Free Quantum Dots Revenue Share (%), by Type 2025 & 2033
- Figure 18: Europe Cadmium Free Quantum Dots Revenue (million), by Country 2025 & 2033
- Figure 19: Europe Cadmium Free Quantum Dots Revenue Share (%), by Country 2025 & 2033
- Figure 20: Middle East & Africa Cadmium Free Quantum Dots Revenue (million), by Application 2025 & 2033
- Figure 21: Middle East & Africa Cadmium Free Quantum Dots Revenue Share (%), by Application 2025 & 2033
- Figure 22: Middle East & Africa Cadmium Free Quantum Dots Revenue (million), by Type 2025 & 2033
- Figure 23: Middle East & Africa Cadmium Free Quantum Dots Revenue Share (%), by Type 2025 & 2033
- Figure 24: Middle East & Africa Cadmium Free Quantum Dots Revenue (million), by Country 2025 & 2033
- Figure 25: Middle East & Africa Cadmium Free Quantum Dots Revenue Share (%), by Country 2025 & 2033
- Figure 26: Asia Pacific Cadmium Free Quantum Dots Revenue (million), by Application 2025 & 2033
- Figure 27: Asia Pacific Cadmium Free Quantum Dots Revenue Share (%), by Application 2025 & 2033
- Figure 28: Asia Pacific Cadmium Free Quantum Dots Revenue (million), by Type 2025 & 2033
- Figure 29: Asia Pacific Cadmium Free Quantum Dots Revenue Share (%), by Type 2025 & 2033
- Figure 30: Asia Pacific Cadmium Free Quantum Dots Revenue (million), by Country 2025 & 2033
- Figure 31: Asia Pacific Cadmium Free Quantum Dots Revenue Share (%), by Country 2025 & 2033
List of Tables
- Table 1: Global Cadmium Free Quantum Dots Revenue million Forecast, by Application 2020 & 2033
- Table 2: Global Cadmium Free Quantum Dots Revenue million Forecast, by Type 2020 & 2033
- Table 3: Global Cadmium Free Quantum Dots Revenue million Forecast, by Region 2020 & 2033
- Table 4: Global Cadmium Free Quantum Dots Revenue million Forecast, by Application 2020 & 2033
- Table 5: Global Cadmium Free Quantum Dots Revenue million Forecast, by Type 2020 & 2033
- Table 6: Global Cadmium Free Quantum Dots Revenue million Forecast, by Country 2020 & 2033
- Table 7: United States Cadmium Free Quantum Dots Revenue (million) Forecast, by Application 2020 & 2033
- Table 8: Canada Cadmium Free Quantum Dots Revenue (million) Forecast, by Application 2020 & 2033
- Table 9: Mexico Cadmium Free Quantum Dots Revenue (million) Forecast, by Application 2020 & 2033
- Table 10: Global Cadmium Free Quantum Dots Revenue million Forecast, by Application 2020 & 2033
- Table 11: Global Cadmium Free Quantum Dots Revenue million Forecast, by Type 2020 & 2033
- Table 12: Global Cadmium Free Quantum Dots Revenue million Forecast, by Country 2020 & 2033
- Table 13: Brazil Cadmium Free Quantum Dots Revenue (million) Forecast, by Application 2020 & 2033
- Table 14: Argentina Cadmium Free Quantum Dots Revenue (million) Forecast, by Application 2020 & 2033
- Table 15: Rest of South America Cadmium Free Quantum Dots Revenue (million) Forecast, by Application 2020 & 2033
- Table 16: Global Cadmium Free Quantum Dots Revenue million Forecast, by Application 2020 & 2033
- Table 17: Global Cadmium Free Quantum Dots Revenue million Forecast, by Type 2020 & 2033
- Table 18: Global Cadmium Free Quantum Dots Revenue million Forecast, by Country 2020 & 2033
- Table 19: United Kingdom Cadmium Free Quantum Dots Revenue (million) Forecast, by Application 2020 & 2033
- Table 20: Germany Cadmium Free Quantum Dots Revenue (million) Forecast, by Application 2020 & 2033
- Table 21: France Cadmium Free Quantum Dots Revenue (million) Forecast, by Application 2020 & 2033
- Table 22: Italy Cadmium Free Quantum Dots Revenue (million) Forecast, by Application 2020 & 2033
- Table 23: Spain Cadmium Free Quantum Dots Revenue (million) Forecast, by Application 2020 & 2033
- Table 24: Russia Cadmium Free Quantum Dots Revenue (million) Forecast, by Application 2020 & 2033
- Table 25: Benelux Cadmium Free Quantum Dots Revenue (million) Forecast, by Application 2020 & 2033
- Table 26: Nordics Cadmium Free Quantum Dots Revenue (million) Forecast, by Application 2020 & 2033
- Table 27: Rest of Europe Cadmium Free Quantum Dots Revenue (million) Forecast, by Application 2020 & 2033
- Table 28: Global Cadmium Free Quantum Dots Revenue million Forecast, by Application 2020 & 2033
- Table 29: Global Cadmium Free Quantum Dots Revenue million Forecast, by Type 2020 & 2033
- Table 30: Global Cadmium Free Quantum Dots Revenue million Forecast, by Country 2020 & 2033
- Table 31: Turkey Cadmium Free Quantum Dots Revenue (million) Forecast, by Application 2020 & 2033
- Table 32: Israel Cadmium Free Quantum Dots Revenue (million) Forecast, by Application 2020 & 2033
- Table 33: GCC Cadmium Free Quantum Dots Revenue (million) Forecast, by Application 2020 & 2033
- Table 34: North Africa Cadmium Free Quantum Dots Revenue (million) Forecast, by Application 2020 & 2033
- Table 35: South Africa Cadmium Free Quantum Dots Revenue (million) Forecast, by Application 2020 & 2033
- Table 36: Rest of Middle East & Africa Cadmium Free Quantum Dots Revenue (million) Forecast, by Application 2020 & 2033
- Table 37: Global Cadmium Free Quantum Dots Revenue million Forecast, by Application 2020 & 2033
- Table 38: Global Cadmium Free Quantum Dots Revenue million Forecast, by Type 2020 & 2033
- Table 39: Global Cadmium Free Quantum Dots Revenue million Forecast, by Country 2020 & 2033
- Table 40: China Cadmium Free Quantum Dots Revenue (million) Forecast, by Application 2020 & 2033
- Table 41: India Cadmium Free Quantum Dots Revenue (million) Forecast, by Application 2020 & 2033
- Table 42: Japan Cadmium Free Quantum Dots Revenue (million) Forecast, by Application 2020 & 2033
- Table 43: South Korea Cadmium Free Quantum Dots Revenue (million) Forecast, by Application 2020 & 2033
- Table 44: ASEAN Cadmium Free Quantum Dots Revenue (million) Forecast, by Application 2020 & 2033
- Table 45: Oceania Cadmium Free Quantum Dots Revenue (million) Forecast, by Application 2020 & 2033
- Table 46: Rest of Asia Pacific Cadmium Free Quantum Dots Revenue (million) Forecast, by Application 2020 & 2033
Frequently Asked Questions
1. What is the projected Compound Annual Growth Rate (CAGR) of the Cadmium Free Quantum Dots?
The projected CAGR is approximately XXX%.
2. Which companies are prominent players in the Cadmium Free Quantum Dots?
Key companies in the market include Samsung Electronics, Nanosys, Nanoco Group, NN-Labs, Ocean NanoTech, Quantum Materials, OSRAM Licht, Avantama, Navillum Nanotechnologies, Crystalplex Corporation, RANOVUS, Innolume, QUANTUM SOLUTIONS, NanoPhotonica, UbiQD, Fraunhofer IAP, TCL, VIZIO, Hisense, QD Lasers.
3. What are the main segments of the Cadmium Free Quantum Dots?
The market segments include Application, Type.
4. Can you provide details about the market size?
The market size is estimated to be USD XXX million as of 2022.
5. What are some drivers contributing to market growth?
N/A
6. What are the notable trends driving market growth?
N/A
7. Are there any restraints impacting market growth?
N/A
8. Can you provide examples of recent developments in the market?
N/A
9. What pricing options are available for accessing the report?
Pricing options include single-user, multi-user, and enterprise licenses priced at USD 4250.00, USD 6375.00, and USD 8500.00 respectively.
10. Is the market size provided in terms of value or volume?
The market size is provided in terms of value, measured in million.
11. Are there any specific market keywords associated with the report?
Yes, the market keyword associated with the report is "Cadmium Free Quantum Dots," which aids in identifying and referencing the specific market segment covered.
12. How do I determine which pricing option suits my needs best?
The pricing options vary based on user requirements and access needs. Individual users may opt for single-user licenses, while businesses requiring broader access may choose multi-user or enterprise licenses for cost-effective access to the report.
13. Are there any additional resources or data provided in the Cadmium Free Quantum Dots report?
While the report offers comprehensive insights, it's advisable to review the specific contents or supplementary materials provided to ascertain if additional resources or data are available.
14. How can I stay updated on further developments or reports in the Cadmium Free Quantum Dots?
To stay informed about further developments, trends, and reports in the Cadmium Free Quantum Dots, consider subscribing to industry newsletters, following relevant companies and organizations, or regularly checking reputable industry news sources and publications.
Methodology
Step 1 - Identification of Relevant Samples Size from Population Database


Step 2 - Approaches for Defining Global Market Size (Value, Volume* & Price*)

Note*: In applicable scenarios
Step 3 - Data Sources
Primary Research
- Web Analytics
- Survey Reports
- Research Institute
- Latest Research Reports
- Opinion Leaders
Secondary Research
- Annual Reports
- White Paper
- Latest Press Release
- Industry Association
- Paid Database
- Investor Presentations

Step 4 - Data Triangulation
Involves using different sources of information in order to increase the validity of a study
These sources are likely to be stakeholders in a program - participants, other researchers, program staff, other community members, and so on.
Then we put all data in single framework & apply various statistical tools to find out the dynamic on the market.
During the analysis stage, feedback from the stakeholder groups would be compared to determine areas of agreement as well as areas of divergence