

Key Insights
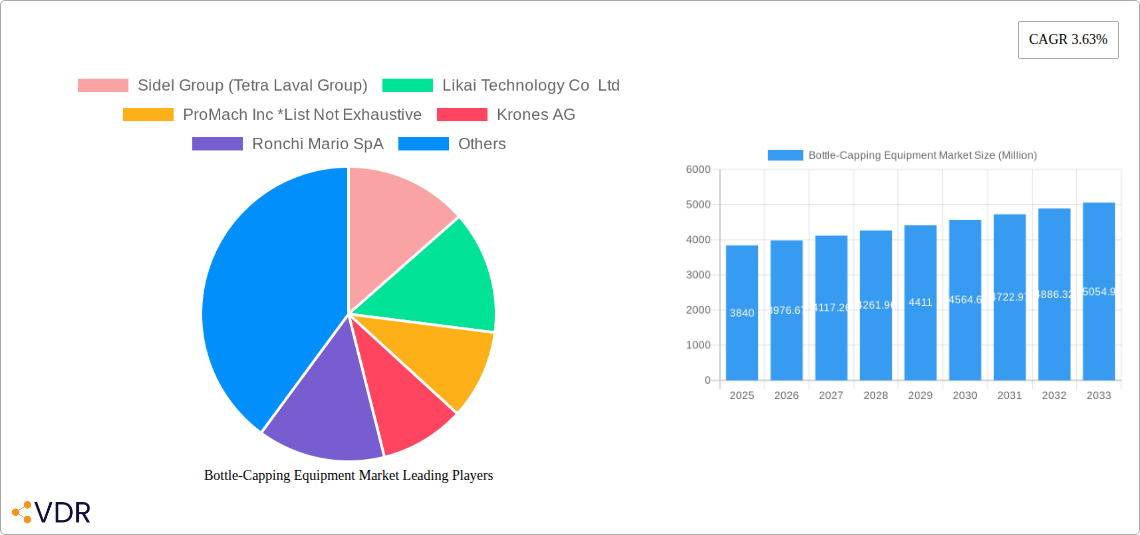
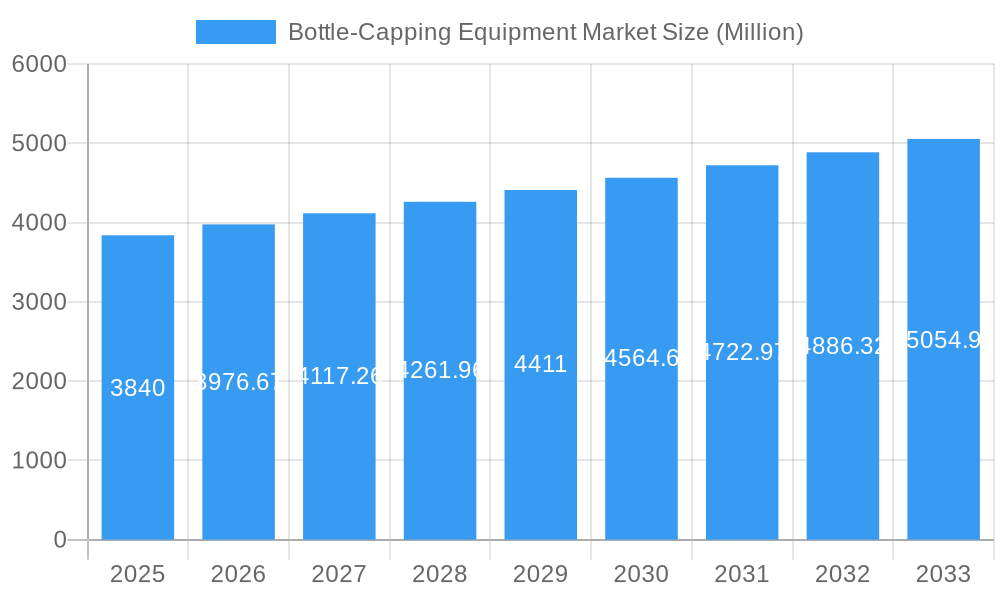
The global bottle-capping equipment market, valued at $3.84 billion in 2025, is projected to experience steady growth, driven by the expanding food and beverage, pharmaceutical, and personal care industries. A Compound Annual Growth Rate (CAGR) of 3.63% from 2025 to 2033 indicates a robust market outlook, fueled by increasing automation in packaging lines and the rising demand for efficient and hygienic capping solutions. The market is segmented by cap type (ROPP, screw, snap-on, corks), end-user industry (pharmaceuticals, personal care, food and beverage, chemicals, automotive), and technology (automatic, semi-automatic). Automatic capping systems are gaining traction due to their enhanced speed, precision, and reduced labor costs. Growth within the pharmaceutical and personal care segments is particularly strong, driven by stringent quality and safety regulations, and a growing emphasis on tamper-evident closures. Regional variations are expected, with North America and Europe maintaining significant market share, while Asia-Pacific shows considerable potential for future growth due to rapid industrialization and expanding consumer markets. The increasing focus on sustainable packaging materials and environmentally friendly capping solutions is another key factor driving market growth and shaping future innovation within the industry.
Bottle-Capping Equipment Market Market Size (In Billion)
The competitive landscape is characterized by a mix of established multinational companies like Sidel Group and Tetra Pak, and specialized regional players. These companies are continuously investing in research and development to improve the efficiency, versatility, and sustainability of their bottle-capping equipment. The market is witnessing increased mergers and acquisitions as companies strategize for market share expansion. Factors that could restrain market growth include fluctuating raw material prices, economic downturns impacting consumer spending, and potential technological disruptions. However, the long-term outlook remains positive, supported by the consistent demand for efficient and reliable bottle-capping solutions across diverse industries. Market segmentation analysis indicates significant opportunities for companies specializing in niche applications or offering innovative solutions tailored to specific industry requirements.
Bottle-Capping Equipment Market Company Market Share
Bottle-Capping Equipment Market: A Comprehensive Report (2019-2033)
This comprehensive report provides an in-depth analysis of the Bottle-Capping Equipment market, encompassing market dynamics, growth trends, regional segmentation, product landscape, key players, and future outlook. The study period spans from 2019 to 2033, with 2025 serving as the base and estimated year. This report is invaluable for industry professionals, investors, and stakeholders seeking a thorough understanding of this dynamic market. The parent market is the Packaging Equipment Market and the child market is the Bottle-Capping Equipment Market.
Bottle-Capping Equipment Market Dynamics & Structure
The global bottle-capping equipment market exhibits a moderately concentrated structure, with key players such as Sidel Group (Tetra Laval Group), Krones AG, and ProMach Inc. holding significant market share. However, the presence of numerous smaller, specialized manufacturers creates a competitive landscape. Technological innovation, driven by demands for increased automation, efficiency, and sustainability, is a major driver. Stringent regulatory frameworks regarding hygiene and safety standards in various end-use industries influence equipment design and manufacturing. The market also witnesses the emergence of competitive product substitutes, especially in the automated segment. End-user demographics, particularly the growth of the food and beverage and pharmaceutical industries in developing economies, fuel market expansion. M&A activity within the sector has been moderate, with a few significant deals recorded in the past five years, leading to consolidation and expansion among major players. Estimates suggest a xx% market share for the top 3 players in 2025.
- Market Concentration: Moderately concentrated, with significant players holding xx% market share.
- Technological Innovation: Driven by automation, sustainability, and efficiency gains.
- Regulatory Framework: Stringent standards impacting equipment design and safety.
- Competitive Substitutes: Emerging alternative technologies posing competitive pressure.
- End-User Demographics: Growth in food & beverage, pharmaceuticals driving demand.
- M&A Trends: Moderate activity, leading to industry consolidation.
Bottle-Capping Equipment Market Growth Trends & Insights
The bottle-capping equipment market has experienced steady growth throughout the historical period (2019-2024). Driven by increasing automation across various industries and the rising demand for packaged goods globally, the market is projected to maintain a healthy Compound Annual Growth Rate (CAGR) of xx% during the forecast period (2025-2033). Market size is estimated at xx million units in 2025, projected to reach xx million units by 2033. The adoption rate of automatic capping equipment is significantly higher compared to semi-automatic systems, reflecting industry trends towards increased production efficiency. Technological disruptions, including the integration of robotics, AI, and advanced sensors, are reshaping the market, driving the adoption of smart and connected capping solutions. Shifts in consumer preferences towards sustainable packaging also impact the market, favoring equipment that utilizes eco-friendly materials and reduces waste. Market penetration of advanced capping technologies, such as RFID-enabled systems, is gradually increasing.
Dominant Regions, Countries, or Segments in Bottle-Capping Equipment Market
The Food and Beverage sector currently dominates the bottle-capping equipment market, accounting for approximately xx% of the market share in 2025, followed by Pharmaceuticals (xx%) and Personal Care and Cosmetics (xx%). Within cap types, Screw Caps hold the largest market segment, driven by their versatility and cost-effectiveness. Geographically, North America and Europe are currently leading regions due to established industries and high automation adoption rates. However, Asia Pacific is projected to witness significant growth in the coming years due to rapid industrialization and expanding consumption patterns.
- Dominant Segment: Food & Beverage (by end-user) and Screw Caps (by cap type)
- Leading Regions: North America, Europe (currently); Asia-Pacific (high growth potential)
- Key Drivers: Growing demand for packaged goods, increasing automation adoption, rising disposable incomes in developing economies.
- Market Share: Food & Beverage (xx%), Pharmaceuticals (xx%), Personal Care & Cosmetics (xx%)
Bottle-Capping Equipment Market Product Landscape
The bottle-capping equipment market offers a diverse range of products catering to different bottle types, cap styles, and production volumes. Innovations focus on improving speed, accuracy, and ease of operation, with advanced features like integrated vision systems, automated changeovers, and real-time monitoring capabilities. Unique selling propositions (USPs) often include enhanced hygiene features, reduced maintenance needs, and integration capabilities with other packaging equipment. Technological advancements such as the use of robotics, AI, and IoT-based technologies are continuously enhancing the functionality and performance of the equipment.
Key Drivers, Barriers & Challenges in Bottle-Capping Equipment Market
Key Drivers:
- Increased Automation: Demand for higher efficiency and reduced labor costs.
- Growing Demand for Packaged Goods: Expansion of consumer goods industries globally.
- Technological Advancements: Innovations leading to improved speed, accuracy, and efficiency.
Key Challenges & Restraints:
- High Initial Investment: Automated systems have a significant upfront cost.
- Supply Chain Disruptions: Global events affecting raw material availability and pricing.
- Stringent Regulatory Compliance: Meeting various safety and hygiene standards.
- Intense Competition: Presence of many established and emerging players in the market. (estimated impact xx% reduction on market growth)
Emerging Opportunities in Bottle-Capping Equipment Market
- Sustainable Packaging: Growing demand for eco-friendly capping solutions.
- Smart Factory Integration: Connecting capping equipment with broader production systems.
- Emerging Markets: Expanding markets in developing economies present significant opportunities.
- Specialized Capping Solutions: Meeting niche industry requirements.
Growth Accelerators in the Bottle-Capping Equipment Market Industry
Technological breakthroughs in robotics, AI, and sensor technologies are driving significant advancements in capping equipment, enhancing speed, precision, and efficiency. Strategic partnerships between equipment manufacturers and packaging material suppliers are leading to optimized solutions and improved supply chain management. Expansion into new markets, particularly in developing economies experiencing rapid industrialization and growing consumer demand, represents a substantial growth catalyst.
Key Players Shaping the Bottle-Capping Equipment Market Market
- Sidel Group (Tetra Laval Group)
- Likai Technology Co Ltd
- ProMach Inc
- Krones AG
- Ronchi Mario SpA
- Accutek Packaging Equipment Companies Inc
- Barry-Wehmiller Companies Inc
- Phoenix Dison Tec LLC
- Tetra Pak International SA (Tetra Laval Group)
- E-PAK Machinery Inc
Notable Milestones in Bottle-Capping Equipment Market Sector
- January 2023: Shemesh launches TKS-C60, a robotics-enhanced packaging line for cosmetics, boosting automation capabilities.
- December 2022: Wallaby invests in specialized capping machinery for its new resealable aluminum containers, highlighting growth in sustainable packaging.
- May 2022: Marchesini Group showcases pharmaceutical packaging innovations, indicating advancements in the sector.
In-Depth Bottle-Capping Equipment Market Market Outlook
The bottle-capping equipment market is poised for sustained growth, driven by ongoing technological advancements, increased automation across industries, and expanding demand for packaged goods globally. Strategic partnerships, focused on innovation and sustainability, and expansion into untapped markets are expected to further propel market expansion. The integration of smart technologies and the adoption of sustainable practices will continue to shape the market landscape, presenting significant opportunities for manufacturers and stakeholders alike.
Bottle-Capping Equipment Market Segmentation
-
1. Technology
- 1.1. Automatic
- 1.2. Semi-automatic
-
2. Cap Type
- 2.1. ROPP Caps
- 2.2. Screw Caps
- 2.3. Snap-on-Caps
- 2.4. Corks
-
3. End User
- 3.1. Pharmaceuticals
- 3.2. Personal Care and Cosmetics
- 3.3. Food and Beverage
- 3.4. Chemicals
- 3.5. Automotive
- 3.6. Other End Users
Bottle-Capping Equipment Market Segmentation By Geography
-
1. North America
- 1.1. United States
- 1.2. Canada
-
2. Europe
- 2.1. United Kingdom
- 2.2. Germany
- 2.3. France
- 2.4. Rest of Europe
-
3. Asia Pacific
- 3.1. China
- 3.2. India
- 3.3. Japan
- 3.4. Rest of Asia Pacific
-
4. Latin America
- 4.1. Mexico
- 4.2. Brazil
- 4.3. Rest of Latin America
- 5. Middle East
-
6. United Arab Emirates
- 6.1. Saudi Arabia
- 6.2. South Africa
- 6.3. Rest of Middle East

Bottle-Capping Equipment Market Regional Market Share
Geographic Coverage of Bottle-Capping Equipment Market
Bottle-Capping Equipment Market REPORT HIGHLIGHTS
| Aspects | Details |
|---|---|
| Study Period | 2020-2034 |
| Base Year | 2025 |
| Estimated Year | 2026 |
| Forecast Period | 2026-2034 |
| Historical Period | 2020-2025 |
| Growth Rate | CAGR of 3.63% from 2020-2034 |
| Segmentation |
|
Table of Contents
- 1. Introduction
- 1.1. Research Scope
- 1.2. Market Segmentation
- 1.3. Research Objective
- 1.4. Definitions and Assumptions
- 2. Executive Summary
- 2.1. Market Snapshot
- 3. Market Dynamics
- 3.1. Market Drivers
- 3.2. Market Restrains
- 3.3. Market Trends
- 3.4. Market Opportunities
- 4. Market Factor Analysis
- 4.1. Porters Five Forces
- 4.1.1. Bargaining Power of Suppliers
- 4.1.2. Bargaining Power of Buyers
- 4.1.3. Threat of New Entrants
- 4.1.4. Threat of Substitutes
- 4.1.5. Competitive Rivalry
- 4.2. PESTEL analysis
- 4.3. BCG Analysis
- 4.3.1. Stars (High Growth, High Market Share)
- 4.3.2. Cash Cows (Low Growth, High Market Share)
- 4.3.3. Question Mark (High Growth, Low Market Share)
- 4.3.4. Dogs (Low Growth, Low Market Share)
- 4.4. Ansoff Matrix Analysis
- 4.5. Supply Chain Analysis
- 4.6. Regulatory Landscape
- 4.7. Current Market Potential and Opportunity Assessment (TAM–SAM–SOM Framework)
- 4.8. VDR Analyst Note
- 4.1. Porters Five Forces
- 5. Market Analysis, Insights and Forecast 2021-2033
- 5.1. Market Analysis, Insights and Forecast - by Technology
- 5.1.1. Automatic
- 5.1.2. Semi-automatic
- 5.2. Market Analysis, Insights and Forecast - by Cap Type
- 5.2.1. ROPP Caps
- 5.2.2. Screw Caps
- 5.2.3. Snap-on-Caps
- 5.2.4. Corks
- 5.3. Market Analysis, Insights and Forecast - by End User
- 5.3.1. Pharmaceuticals
- 5.3.2. Personal Care and Cosmetics
- 5.3.3. Food and Beverage
- 5.3.4. Chemicals
- 5.3.5. Automotive
- 5.3.6. Other End Users
- 5.4. Market Analysis, Insights and Forecast - by Region
- 5.4.1. North America
- 5.4.2. Europe
- 5.4.3. Asia Pacific
- 5.4.4. Latin America
- 5.4.5. Middle East
- 5.4.6. United Arab Emirates
- 5.1. Market Analysis, Insights and Forecast - by Technology
- 6. Global Bottle-Capping Equipment Market Analysis, Insights and Forecast, 2021-2033
- 6.1. Market Analysis, Insights and Forecast - by Technology
- 6.1.1. Automatic
- 6.1.2. Semi-automatic
- 6.2. Market Analysis, Insights and Forecast - by Cap Type
- 6.2.1. ROPP Caps
- 6.2.2. Screw Caps
- 6.2.3. Snap-on-Caps
- 6.2.4. Corks
- 6.3. Market Analysis, Insights and Forecast - by End User
- 6.3.1. Pharmaceuticals
- 6.3.2. Personal Care and Cosmetics
- 6.3.3. Food and Beverage
- 6.3.4. Chemicals
- 6.3.5. Automotive
- 6.3.6. Other End Users
- 6.1. Market Analysis, Insights and Forecast - by Technology
- 7. North America Bottle-Capping Equipment Market Analysis, Insights and Forecast, 2021-2033
- 7.1. Market Analysis, Insights and Forecast - by Technology
- 7.1.1. Automatic
- 7.1.2. Semi-automatic
- 7.2. Market Analysis, Insights and Forecast - by Cap Type
- 7.2.1. ROPP Caps
- 7.2.2. Screw Caps
- 7.2.3. Snap-on-Caps
- 7.2.4. Corks
- 7.3. Market Analysis, Insights and Forecast - by End User
- 7.3.1. Pharmaceuticals
- 7.3.2. Personal Care and Cosmetics
- 7.3.3. Food and Beverage
- 7.3.4. Chemicals
- 7.3.5. Automotive
- 7.3.6. Other End Users
- 7.1. Market Analysis, Insights and Forecast - by Technology
- 8. Europe Bottle-Capping Equipment Market Analysis, Insights and Forecast, 2021-2033
- 8.1. Market Analysis, Insights and Forecast - by Technology
- 8.1.1. Automatic
- 8.1.2. Semi-automatic
- 8.2. Market Analysis, Insights and Forecast - by Cap Type
- 8.2.1. ROPP Caps
- 8.2.2. Screw Caps
- 8.2.3. Snap-on-Caps
- 8.2.4. Corks
- 8.3. Market Analysis, Insights and Forecast - by End User
- 8.3.1. Pharmaceuticals
- 8.3.2. Personal Care and Cosmetics
- 8.3.3. Food and Beverage
- 8.3.4. Chemicals
- 8.3.5. Automotive
- 8.3.6. Other End Users
- 8.1. Market Analysis, Insights and Forecast - by Technology
- 9. Asia Pacific Bottle-Capping Equipment Market Analysis, Insights and Forecast, 2021-2033
- 9.1. Market Analysis, Insights and Forecast - by Technology
- 9.1.1. Automatic
- 9.1.2. Semi-automatic
- 9.2. Market Analysis, Insights and Forecast - by Cap Type
- 9.2.1. ROPP Caps
- 9.2.2. Screw Caps
- 9.2.3. Snap-on-Caps
- 9.2.4. Corks
- 9.3. Market Analysis, Insights and Forecast - by End User
- 9.3.1. Pharmaceuticals
- 9.3.2. Personal Care and Cosmetics
- 9.3.3. Food and Beverage
- 9.3.4. Chemicals
- 9.3.5. Automotive
- 9.3.6. Other End Users
- 9.1. Market Analysis, Insights and Forecast - by Technology
- 10. Latin America Bottle-Capping Equipment Market Analysis, Insights and Forecast, 2021-2033
- 10.1. Market Analysis, Insights and Forecast - by Technology
- 10.1.1. Automatic
- 10.1.2. Semi-automatic
- 10.2. Market Analysis, Insights and Forecast - by Cap Type
- 10.2.1. ROPP Caps
- 10.2.2. Screw Caps
- 10.2.3. Snap-on-Caps
- 10.2.4. Corks
- 10.3. Market Analysis, Insights and Forecast - by End User
- 10.3.1. Pharmaceuticals
- 10.3.2. Personal Care and Cosmetics
- 10.3.3. Food and Beverage
- 10.3.4. Chemicals
- 10.3.5. Automotive
- 10.3.6. Other End Users
- 10.1. Market Analysis, Insights and Forecast - by Technology
- 11. Middle East Bottle-Capping Equipment Market Analysis, Insights and Forecast, 2021-2033
- 11.1. Market Analysis, Insights and Forecast - by Technology
- 11.1.1. Automatic
- 11.1.2. Semi-automatic
- 11.2. Market Analysis, Insights and Forecast - by Cap Type
- 11.2.1. ROPP Caps
- 11.2.2. Screw Caps
- 11.2.3. Snap-on-Caps
- 11.2.4. Corks
- 11.3. Market Analysis, Insights and Forecast - by End User
- 11.3.1. Pharmaceuticals
- 11.3.2. Personal Care and Cosmetics
- 11.3.3. Food and Beverage
- 11.3.4. Chemicals
- 11.3.5. Automotive
- 11.3.6. Other End Users
- 11.1. Market Analysis, Insights and Forecast - by Technology
- 12. United Arab Emirates Bottle-Capping Equipment Market Analysis, Insights and Forecast, 2021-2033
- 12.1. Market Analysis, Insights and Forecast - by Technology
- 12.1.1. Automatic
- 12.1.2. Semi-automatic
- 12.2. Market Analysis, Insights and Forecast - by Cap Type
- 12.2.1. ROPP Caps
- 12.2.2. Screw Caps
- 12.2.3. Snap-on-Caps
- 12.2.4. Corks
- 12.3. Market Analysis, Insights and Forecast - by End User
- 12.3.1. Pharmaceuticals
- 12.3.2. Personal Care and Cosmetics
- 12.3.3. Food and Beverage
- 12.3.4. Chemicals
- 12.3.5. Automotive
- 12.3.6. Other End Users
- 12.1. Market Analysis, Insights and Forecast - by Technology
- 13. Competitive Analysis
- 13.1. Company Profiles
- 13.1.1 Sidel Group (Tetra Laval Group)
- 13.1.1.1. Company Overview
- 13.1.1.2. Products
- 13.1.1.3. Company Financials
- 13.1.1.4. SWOT Analysis
- 13.1.2 Likai Technology Co Ltd
- 13.1.2.1. Company Overview
- 13.1.2.2. Products
- 13.1.2.3. Company Financials
- 13.1.2.4. SWOT Analysis
- 13.1.3 ProMach Inc *List Not Exhaustive
- 13.1.3.1. Company Overview
- 13.1.3.2. Products
- 13.1.3.3. Company Financials
- 13.1.3.4. SWOT Analysis
- 13.1.4 Krones AG
- 13.1.4.1. Company Overview
- 13.1.4.2. Products
- 13.1.4.3. Company Financials
- 13.1.4.4. SWOT Analysis
- 13.1.5 Ronchi Mario SpA
- 13.1.5.1. Company Overview
- 13.1.5.2. Products
- 13.1.5.3. Company Financials
- 13.1.5.4. SWOT Analysis
- 13.1.6 Accutek Packaging Equipment Companies Inc
- 13.1.6.1. Company Overview
- 13.1.6.2. Products
- 13.1.6.3. Company Financials
- 13.1.6.4. SWOT Analysis
- 13.1.7 Barry-Wehmiller Companies Inc
- 13.1.7.1. Company Overview
- 13.1.7.2. Products
- 13.1.7.3. Company Financials
- 13.1.7.4. SWOT Analysis
- 13.1.8 Phoenix Dison Tec LLC
- 13.1.8.1. Company Overview
- 13.1.8.2. Products
- 13.1.8.3. Company Financials
- 13.1.8.4. SWOT Analysis
- 13.1.9 Tetra Pak International SA (Tetra Laval Group)
- 13.1.9.1. Company Overview
- 13.1.9.2. Products
- 13.1.9.3. Company Financials
- 13.1.9.4. SWOT Analysis
- 13.1.10 E-PAK Machinery Inc
- 13.1.10.1. Company Overview
- 13.1.10.2. Products
- 13.1.10.3. Company Financials
- 13.1.10.4. SWOT Analysis
- 13.1.1 Sidel Group (Tetra Laval Group)
- 13.2. Market Entropy
- 13.2.1 Company's Key Areas Served
- 13.2.2 Recent Developments
- 13.3. Company Market Share Analysis 2025
- 13.3.1 Top 5 Companies Market Share Analysis
- 13.3.2 Top 3 Companies Market Share Analysis
- 13.4. List of Potential Customers
- 14. Research Methodology
List of Figures
- Figure 1: Global Bottle-Capping Equipment Market Revenue Breakdown (Million, %) by Region 2025 & 2033
- Figure 2: North America Bottle-Capping Equipment Market Revenue (Million), by Technology 2025 & 2033
- Figure 3: North America Bottle-Capping Equipment Market Revenue Share (%), by Technology 2025 & 2033
- Figure 4: North America Bottle-Capping Equipment Market Revenue (Million), by Cap Type 2025 & 2033
- Figure 5: North America Bottle-Capping Equipment Market Revenue Share (%), by Cap Type 2025 & 2033
- Figure 6: North America Bottle-Capping Equipment Market Revenue (Million), by End User 2025 & 2033
- Figure 7: North America Bottle-Capping Equipment Market Revenue Share (%), by End User 2025 & 2033
- Figure 8: North America Bottle-Capping Equipment Market Revenue (Million), by Country 2025 & 2033
- Figure 9: North America Bottle-Capping Equipment Market Revenue Share (%), by Country 2025 & 2033
- Figure 10: Europe Bottle-Capping Equipment Market Revenue (Million), by Technology 2025 & 2033
- Figure 11: Europe Bottle-Capping Equipment Market Revenue Share (%), by Technology 2025 & 2033
- Figure 12: Europe Bottle-Capping Equipment Market Revenue (Million), by Cap Type 2025 & 2033
- Figure 13: Europe Bottle-Capping Equipment Market Revenue Share (%), by Cap Type 2025 & 2033
- Figure 14: Europe Bottle-Capping Equipment Market Revenue (Million), by End User 2025 & 2033
- Figure 15: Europe Bottle-Capping Equipment Market Revenue Share (%), by End User 2025 & 2033
- Figure 16: Europe Bottle-Capping Equipment Market Revenue (Million), by Country 2025 & 2033
- Figure 17: Europe Bottle-Capping Equipment Market Revenue Share (%), by Country 2025 & 2033
- Figure 18: Asia Pacific Bottle-Capping Equipment Market Revenue (Million), by Technology 2025 & 2033
- Figure 19: Asia Pacific Bottle-Capping Equipment Market Revenue Share (%), by Technology 2025 & 2033
- Figure 20: Asia Pacific Bottle-Capping Equipment Market Revenue (Million), by Cap Type 2025 & 2033
- Figure 21: Asia Pacific Bottle-Capping Equipment Market Revenue Share (%), by Cap Type 2025 & 2033
- Figure 22: Asia Pacific Bottle-Capping Equipment Market Revenue (Million), by End User 2025 & 2033
- Figure 23: Asia Pacific Bottle-Capping Equipment Market Revenue Share (%), by End User 2025 & 2033
- Figure 24: Asia Pacific Bottle-Capping Equipment Market Revenue (Million), by Country 2025 & 2033
- Figure 25: Asia Pacific Bottle-Capping Equipment Market Revenue Share (%), by Country 2025 & 2033
- Figure 26: Latin America Bottle-Capping Equipment Market Revenue (Million), by Technology 2025 & 2033
- Figure 27: Latin America Bottle-Capping Equipment Market Revenue Share (%), by Technology 2025 & 2033
- Figure 28: Latin America Bottle-Capping Equipment Market Revenue (Million), by Cap Type 2025 & 2033
- Figure 29: Latin America Bottle-Capping Equipment Market Revenue Share (%), by Cap Type 2025 & 2033
- Figure 30: Latin America Bottle-Capping Equipment Market Revenue (Million), by End User 2025 & 2033
- Figure 31: Latin America Bottle-Capping Equipment Market Revenue Share (%), by End User 2025 & 2033
- Figure 32: Latin America Bottle-Capping Equipment Market Revenue (Million), by Country 2025 & 2033
- Figure 33: Latin America Bottle-Capping Equipment Market Revenue Share (%), by Country 2025 & 2033
- Figure 34: Middle East Bottle-Capping Equipment Market Revenue (Million), by Technology 2025 & 2033
- Figure 35: Middle East Bottle-Capping Equipment Market Revenue Share (%), by Technology 2025 & 2033
- Figure 36: Middle East Bottle-Capping Equipment Market Revenue (Million), by Cap Type 2025 & 2033
- Figure 37: Middle East Bottle-Capping Equipment Market Revenue Share (%), by Cap Type 2025 & 2033
- Figure 38: Middle East Bottle-Capping Equipment Market Revenue (Million), by End User 2025 & 2033
- Figure 39: Middle East Bottle-Capping Equipment Market Revenue Share (%), by End User 2025 & 2033
- Figure 40: Middle East Bottle-Capping Equipment Market Revenue (Million), by Country 2025 & 2033
- Figure 41: Middle East Bottle-Capping Equipment Market Revenue Share (%), by Country 2025 & 2033
- Figure 42: United Arab Emirates Bottle-Capping Equipment Market Revenue (Million), by Technology 2025 & 2033
- Figure 43: United Arab Emirates Bottle-Capping Equipment Market Revenue Share (%), by Technology 2025 & 2033
- Figure 44: United Arab Emirates Bottle-Capping Equipment Market Revenue (Million), by Cap Type 2025 & 2033
- Figure 45: United Arab Emirates Bottle-Capping Equipment Market Revenue Share (%), by Cap Type 2025 & 2033
- Figure 46: United Arab Emirates Bottle-Capping Equipment Market Revenue (Million), by End User 2025 & 2033
- Figure 47: United Arab Emirates Bottle-Capping Equipment Market Revenue Share (%), by End User 2025 & 2033
- Figure 48: United Arab Emirates Bottle-Capping Equipment Market Revenue (Million), by Country 2025 & 2033
- Figure 49: United Arab Emirates Bottle-Capping Equipment Market Revenue Share (%), by Country 2025 & 2033
List of Tables
- Table 1: Global Bottle-Capping Equipment Market Revenue Million Forecast, by Technology 2020 & 2033
- Table 2: Global Bottle-Capping Equipment Market Revenue Million Forecast, by Cap Type 2020 & 2033
- Table 3: Global Bottle-Capping Equipment Market Revenue Million Forecast, by End User 2020 & 2033
- Table 4: Global Bottle-Capping Equipment Market Revenue Million Forecast, by Region 2020 & 2033
- Table 5: Global Bottle-Capping Equipment Market Revenue Million Forecast, by Technology 2020 & 2033
- Table 6: Global Bottle-Capping Equipment Market Revenue Million Forecast, by Cap Type 2020 & 2033
- Table 7: Global Bottle-Capping Equipment Market Revenue Million Forecast, by End User 2020 & 2033
- Table 8: Global Bottle-Capping Equipment Market Revenue Million Forecast, by Country 2020 & 2033
- Table 9: United States Bottle-Capping Equipment Market Revenue (Million) Forecast, by Application 2020 & 2033
- Table 10: Canada Bottle-Capping Equipment Market Revenue (Million) Forecast, by Application 2020 & 2033
- Table 11: Global Bottle-Capping Equipment Market Revenue Million Forecast, by Technology 2020 & 2033
- Table 12: Global Bottle-Capping Equipment Market Revenue Million Forecast, by Cap Type 2020 & 2033
- Table 13: Global Bottle-Capping Equipment Market Revenue Million Forecast, by End User 2020 & 2033
- Table 14: Global Bottle-Capping Equipment Market Revenue Million Forecast, by Country 2020 & 2033
- Table 15: United Kingdom Bottle-Capping Equipment Market Revenue (Million) Forecast, by Application 2020 & 2033
- Table 16: Germany Bottle-Capping Equipment Market Revenue (Million) Forecast, by Application 2020 & 2033
- Table 17: France Bottle-Capping Equipment Market Revenue (Million) Forecast, by Application 2020 & 2033
- Table 18: Rest of Europe Bottle-Capping Equipment Market Revenue (Million) Forecast, by Application 2020 & 2033
- Table 19: Global Bottle-Capping Equipment Market Revenue Million Forecast, by Technology 2020 & 2033
- Table 20: Global Bottle-Capping Equipment Market Revenue Million Forecast, by Cap Type 2020 & 2033
- Table 21: Global Bottle-Capping Equipment Market Revenue Million Forecast, by End User 2020 & 2033
- Table 22: Global Bottle-Capping Equipment Market Revenue Million Forecast, by Country 2020 & 2033
- Table 23: China Bottle-Capping Equipment Market Revenue (Million) Forecast, by Application 2020 & 2033
- Table 24: India Bottle-Capping Equipment Market Revenue (Million) Forecast, by Application 2020 & 2033
- Table 25: Japan Bottle-Capping Equipment Market Revenue (Million) Forecast, by Application 2020 & 2033
- Table 26: Rest of Asia Pacific Bottle-Capping Equipment Market Revenue (Million) Forecast, by Application 2020 & 2033
- Table 27: Global Bottle-Capping Equipment Market Revenue Million Forecast, by Technology 2020 & 2033
- Table 28: Global Bottle-Capping Equipment Market Revenue Million Forecast, by Cap Type 2020 & 2033
- Table 29: Global Bottle-Capping Equipment Market Revenue Million Forecast, by End User 2020 & 2033
- Table 30: Global Bottle-Capping Equipment Market Revenue Million Forecast, by Country 2020 & 2033
- Table 31: Mexico Bottle-Capping Equipment Market Revenue (Million) Forecast, by Application 2020 & 2033
- Table 32: Brazil Bottle-Capping Equipment Market Revenue (Million) Forecast, by Application 2020 & 2033
- Table 33: Rest of Latin America Bottle-Capping Equipment Market Revenue (Million) Forecast, by Application 2020 & 2033
- Table 34: Global Bottle-Capping Equipment Market Revenue Million Forecast, by Technology 2020 & 2033
- Table 35: Global Bottle-Capping Equipment Market Revenue Million Forecast, by Cap Type 2020 & 2033
- Table 36: Global Bottle-Capping Equipment Market Revenue Million Forecast, by End User 2020 & 2033
- Table 37: Global Bottle-Capping Equipment Market Revenue Million Forecast, by Country 2020 & 2033
- Table 38: Global Bottle-Capping Equipment Market Revenue Million Forecast, by Technology 2020 & 2033
- Table 39: Global Bottle-Capping Equipment Market Revenue Million Forecast, by Cap Type 2020 & 2033
- Table 40: Global Bottle-Capping Equipment Market Revenue Million Forecast, by End User 2020 & 2033
- Table 41: Global Bottle-Capping Equipment Market Revenue Million Forecast, by Country 2020 & 2033
- Table 42: Saudi Arabia Bottle-Capping Equipment Market Revenue (Million) Forecast, by Application 2020 & 2033
- Table 43: South Africa Bottle-Capping Equipment Market Revenue (Million) Forecast, by Application 2020 & 2033
- Table 44: Rest of Middle East Bottle-Capping Equipment Market Revenue (Million) Forecast, by Application 2020 & 2033
Frequently Asked Questions
1. What is the projected Compound Annual Growth Rate (CAGR) of the Bottle-Capping Equipment Market?
The projected CAGR is approximately 3.63%.
2. Which companies are prominent players in the Bottle-Capping Equipment Market?
Key companies in the market include Sidel Group (Tetra Laval Group), Likai Technology Co Ltd, ProMach Inc *List Not Exhaustive, Krones AG, Ronchi Mario SpA, Accutek Packaging Equipment Companies Inc, Barry-Wehmiller Companies Inc, Phoenix Dison Tec LLC, Tetra Pak International SA (Tetra Laval Group), E-PAK Machinery Inc.
3. What are the main segments of the Bottle-Capping Equipment Market?
The market segments include Technology, Cap Type, End User.
4. Can you provide details about the market size?
The market size is estimated to be USD 3.84 Million as of 2022.
5. What are some drivers contributing to market growth?
Increased Demand from Pharmaceutical and Chemical Industries; Innovations in Technology Driving the Demand for Automated Capping Machines.
6. What are the notable trends driving market growth?
Increased Demand from Pharmaceutical and Chemical Industries.
7. Are there any restraints impacting market growth?
Presence of Alternative Solutions and High Initial Investments.
8. Can you provide examples of recent developments in the market?
January 2023 - Shemesh, a packaging automation company, launched TKS-C60, a complete robotics-enhanced packaging line for cosmetics that can feed, fill, cap, label, case pack, and palletize cosmetic products of different shapes and sizes. It is also intended to handle the entire packaging process. At 60 bottles per minute, the TKS-C60 guarantees a smooth, continuous bottling line for various goods, from creams and cosmetics to perfumes and nail paint.
9. What pricing options are available for accessing the report?
Pricing options include single-user, multi-user, and enterprise licenses priced at USD 4750, USD 5250, and USD 8750 respectively.
10. Is the market size provided in terms of value or volume?
The market size is provided in terms of value, measured in Million.
11. Are there any specific market keywords associated with the report?
Yes, the market keyword associated with the report is "Bottle-Capping Equipment Market," which aids in identifying and referencing the specific market segment covered.
12. How do I determine which pricing option suits my needs best?
The pricing options vary based on user requirements and access needs. Individual users may opt for single-user licenses, while businesses requiring broader access may choose multi-user or enterprise licenses for cost-effective access to the report.
13. Are there any additional resources or data provided in the Bottle-Capping Equipment Market report?
While the report offers comprehensive insights, it's advisable to review the specific contents or supplementary materials provided to ascertain if additional resources or data are available.
14. How can I stay updated on further developments or reports in the Bottle-Capping Equipment Market?
To stay informed about further developments, trends, and reports in the Bottle-Capping Equipment Market, consider subscribing to industry newsletters, following relevant companies and organizations, or regularly checking reputable industry news sources and publications.
Methodology
Step 1 - Identification of Relevant Samples Size from Population Database


Step 2 - Approaches for Defining Global Market Size (Value, Volume* & Price*)

Note*: In applicable scenarios
Step 3 - Data Sources
Primary Research
- Web Analytics
- Survey Reports
- Research Institute
- Latest Research Reports
- Opinion Leaders
Secondary Research
- Annual Reports
- White Paper
- Latest Press Release
- Industry Association
- Paid Database
- Investor Presentations

Step 4 - Data Triangulation
Involves using different sources of information in order to increase the validity of a study
These sources are likely to be stakeholders in a program - participants, other researchers, program staff, other community members, and so on.
Then we put all data in single framework & apply various statistical tools to find out the dynamic on the market.
During the analysis stage, feedback from the stakeholder groups would be compared to determine areas of agreement as well as areas of divergence