
Key Insights
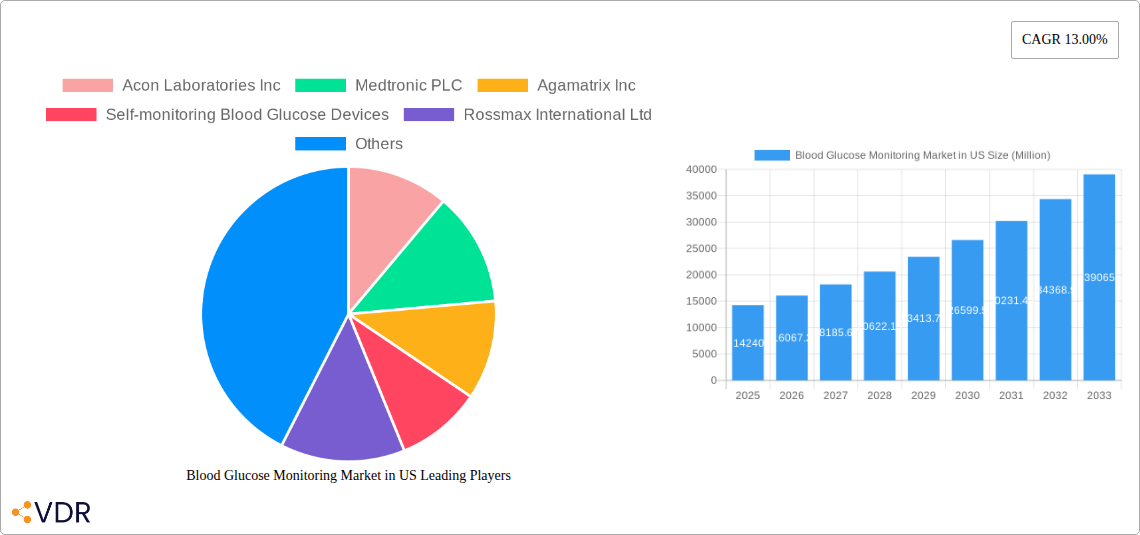
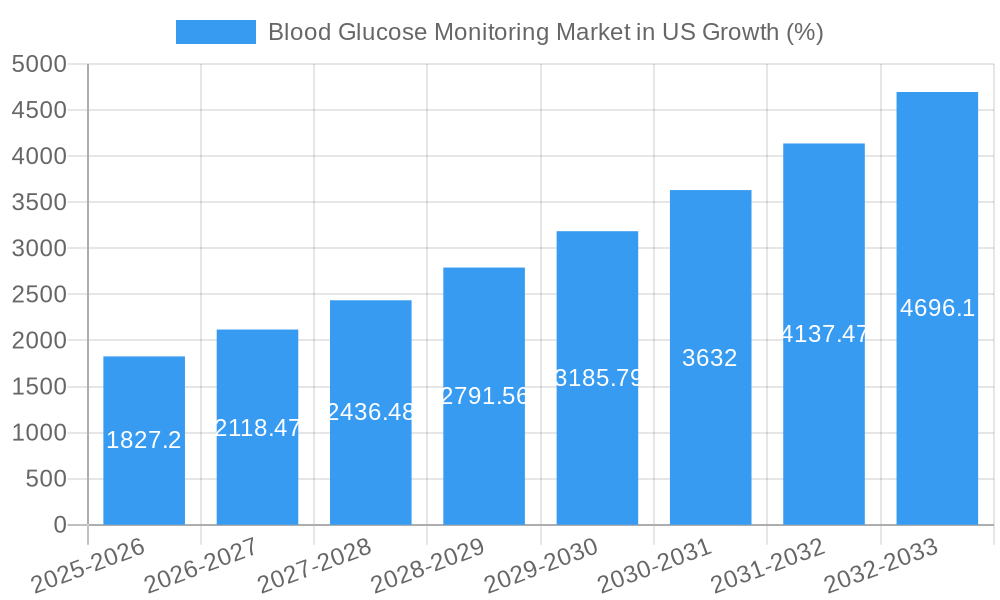
The US blood glucose monitoring (BGM) market, valued at approximately $14.24 billion in 2025, is experiencing robust growth, projected to expand at a compound annual growth rate (CAGR) of 13% from 2025 to 2033. This surge is driven primarily by the rising prevalence of diabetes, an aging population increasingly susceptible to the disease, and advancements in continuous glucose monitoring (CGM) technology offering improved convenience and accuracy compared to traditional self-monitoring blood glucose (SMBG) devices. Increased awareness of the importance of proactive diabetes management, coupled with greater insurance coverage for BGM devices and supplies, further fuels market expansion. However, high costs associated with CGM systems, particularly for the disposable sensors, and potential reimbursement challenges remain as key restraints. The market is segmented into SMBG devices (including glucometers, test strips, and lancets) and CGM devices (sensors and durables like receivers and transmitters). While SMBG remains a significant portion of the market, the CGM segment is experiencing the fastest growth, driven by its superior data insights and less invasive nature. Regional variations exist within the US, with states like California, Texas, and Florida exhibiting higher market penetration due to larger diabetic populations and better healthcare infrastructure. The competitive landscape is dominated by major players including Abbott Diabetes Care, Medtronic, Dexcom, and Roche, constantly innovating to improve device features and accessibility. Future growth hinges on technological advancements leading to smaller, more accurate, and user-friendly devices, expanding reimbursement policies, and improving patient education initiatives to enhance diabetes self-management.
The forecast for the US blood glucose monitoring market through 2033 paints a picture of continued expansion, driven by several key factors. The growing geriatric population, coupled with rising obesity rates and sedentary lifestyles, contributes to a steady increase in the diagnosed and undiagnosed diabetic population. Technological advancements will remain a crucial driver, with improvements focusing on minimizing device size, increasing accuracy, and integrating smart functionalities such as data connectivity and automated insulin delivery systems. Moreover, the ongoing development of non-invasive glucose monitoring technologies holds significant potential for disrupting the market in the coming years. Competitive intensity will likely increase as existing players strive to maintain market share and new entrants enter the arena. Regulatory approvals and reimbursement landscape changes will continue to influence market dynamics. Therefore, the US BGM market trajectory demonstrates considerable opportunity for growth, promising substantial market value by 2033.
Blood Glucose Monitoring Market in US: A Comprehensive Market Report (2019-2033)
This comprehensive report provides an in-depth analysis of the Blood Glucose Monitoring market in the US, encompassing both the parent market (diabetes management) and its key child segments: Self-monitoring Blood Glucose Devices (SMBGD) and Continuous Blood Glucose Monitoring (CGM) devices. The report covers the period from 2019 to 2033, with a focus on the forecast period from 2025 to 2033 and a base year of 2025. Key players such as Acon Laboratories Inc, Medtronic PLC, Agamatrix Inc, Abbott Diabetes Care, LifeScan, Dexcom Inc, Roche Holding AG, and more are analyzed for their market strategies and contributions. The report offers invaluable insights for industry professionals, investors, and strategic decision-makers. Expected market values are in million units.
Blood Glucose Monitoring Market in US Market Dynamics & Structure
This section analyzes the competitive landscape, technological advancements, regulatory influences, and market trends shaping the US blood glucose monitoring market. The market is characterized by a moderate level of concentration, with a few major players holding significant market share. However, smaller, innovative companies are also emerging. Technological advancements, particularly in CGM technology, are driving market growth.
Market Structure:
- Market Concentration: Moderately concentrated, with top 5 players holding approximately xx% of the market share in 2025.
- Technological Innovation: Continuous innovation in sensor technology, data analytics, and integration with mobile devices is a significant driver.
- Regulatory Framework: FDA regulations play a crucial role in product approvals and market access. Stringent quality and safety standards influence innovation and market entry.
- Competitive Substitutes: Limited direct substitutes exist; however, lifestyle modifications and alternative therapies indirectly compete for market share.
- End-User Demographics: The increasing prevalence of diabetes, particularly type 1 and type 2, among the aging population fuels market demand.
- M&A Trends: The past five years have seen xx M&A deals, primarily focused on expanding product portfolios and technological capabilities.
Blood Glucose Monitoring Market in US Growth Trends & Insights
The US blood glucose monitoring market has witnessed substantial growth over the past decade, driven by increasing diabetes prevalence, technological advancements, and improved healthcare access. The market size expanded from xx million units in 2019 to xx million units in 2024, exhibiting a CAGR of xx%. This positive trajectory is projected to continue through 2033, with a forecast CAGR of xx% during the period 2025-2033. The adoption rate of CGM devices is steadily increasing, surpassing that of SMBGD in specific demographics. Consumer behavior is shifting towards more convenient and less invasive monitoring methods, fueling the growth of CGM. Technological disruptions, including the development of integrated insulin delivery systems, are reshaping the market dynamics.
Dominant Regions, Countries, or Segments in Blood Glucose Monitoring Market in US
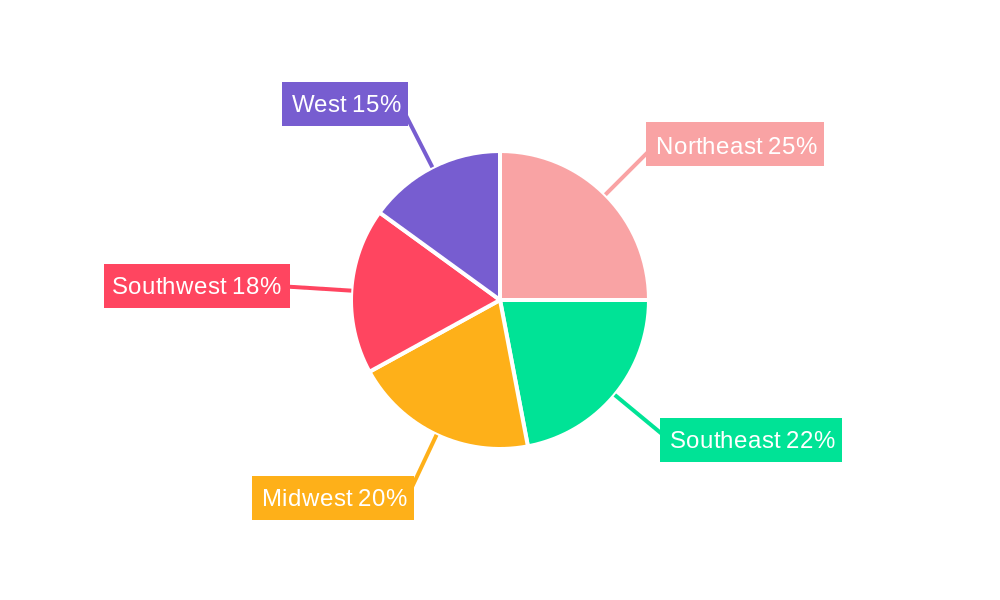
The US market is geographically diverse but exhibits regional variations in growth rates due to factors like healthcare infrastructure, socioeconomic conditions, and diabetes prevalence. Within the product segments, CGM devices are driving market growth at a faster pace compared to SMBGD, while within SMBGD, test strips continue to constitute a significant portion of the market volume.
Key Growth Drivers:
- High Prevalence of Diabetes: The rising incidence of type 1 and type 2 diabetes is the primary growth driver.
- Technological Advancements: The continuous innovation in CGM technology and improved accuracy of SMBGD devices are significant factors.
- Increased Healthcare Spending: Rising healthcare expenditure in the US supports market expansion.
- Government Initiatives: Public health programs aimed at diabetes management and prevention contribute to increased market access.
Dominant Segments:
- CGM: The CGM segment is experiencing rapid growth due to its convenience and improved clinical outcomes. This segment is projected to achieve a market value of xx million units by 2033.
- SMBGD (Test Strips): This segment continues to hold a substantial market share despite the rise of CGM, primarily due to its affordability and widespread availability. This segment is projected to achieve a market value of xx million units by 2033.
Blood Glucose Monitoring Market in US Product Landscape
The market offers a wide array of SMBGD and CGM devices, each with varying features and functionalities. Innovations include smaller, more accurate sensors, improved data management systems, and integration with smartphone applications for better patient compliance and remote monitoring. Unique selling propositions include enhanced accuracy, ease of use, and advanced data analytics capabilities. Technological advancements are primarily focused on improving sensor accuracy, reducing sensor calibration frequency, and extending sensor lifespan.
Key Drivers, Barriers & Challenges in Blood Glucose Monitoring Market in US
Key Drivers:
The increasing prevalence of diabetes, coupled with technological advancements leading to improved accuracy and convenience of blood glucose monitoring devices, is the primary driver for market growth. Furthermore, government initiatives and rising healthcare expenditure positively impact the market.
Key Challenges:
High costs associated with CGM devices, particularly for patients without robust insurance coverage, are a primary constraint. Regulatory hurdles for new device approvals and complexities in the reimbursement landscape also pose challenges. Additionally, intense competition among established and emerging players influences the market dynamics.
Emerging Opportunities in Blood Glucose Monitoring Market in US
The market presents several lucrative opportunities. The development of closed-loop systems integrating glucose monitoring with insulin delivery offers significant potential. Moreover, untapped markets in underserved populations and expanding applications in research and clinical trials present further growth avenues. The rising demand for remote patient monitoring solutions due to the increasing prevalence of chronic diseases is opening up substantial opportunities in the market.
Growth Accelerators in the Blood Glucose Monitoring Market in US Industry
Technological breakthroughs in sensor technology, miniaturization, and improved data analytics capabilities are driving the market’s future growth trajectory. Strategic partnerships between device manufacturers and healthcare providers enhance market penetration and patient access. Expansion strategies targeting underserved populations and the integration of glucose monitoring with other aspects of diabetes management further fuel growth.
Key Players Shaping the Blood Glucose Monitoring Market in US Market
- Acon Laboratories Inc
- Medtronic PLC
- Agamatrix Inc
- Rossmax International Ltd
- Bionime Corporation
- Trivida Functional Medicine
- Abbott Diabetes Care
- LifeScan
- Dexcom Inc
- Roche Holding AG
- Arkray Inc
- Ascensia Diabetes Care
Notable Milestones in Blood Glucose Monitoring Market in US Sector
- 2020: Dexcom launches G6 CGM system with improved accuracy and extended wear time.
- 2021: Abbott receives FDA approval for its FreeStyle Libre 2 system.
- 2022: Several companies announce partnerships to integrate CGM data with insulin pump systems.
- 2023: Continued innovation in sensor technology leads to smaller, less invasive, and more accurate devices. (Specific examples of launches or partnerships to be added based on actual data)
In-Depth Blood Glucose Monitoring Market in US Market Outlook
The future of the US blood glucose monitoring market is bright, characterized by continued technological innovation, increased market penetration of CGM devices, and expansion into new applications. Strategic partnerships and a focus on improving patient outcomes will play crucial roles in driving market growth. The market will continue to be shaped by the interplay of technological advancements, regulatory developments, and evolving consumer preferences. The market is poised for considerable expansion over the next decade, presenting attractive opportunities for industry players.
Blood Glucose Monitoring Market in US Segmentation
-
1. Self-mon
- 1.1. Glucometer Devices
- 1.2. Test Strips
- 1.3. Lancets
-
2. Continuo
- 2.1. Sensors
- 2.2. Durables (Receivers and Transmitters)
Blood Glucose Monitoring Market in US Segmentation By Geography
-
1. North America
- 1.1. United States
- 1.2. Canada
- 1.3. Mexico
-
2. South America
- 2.1. Brazil
- 2.2. Argentina
- 2.3. Rest of South America
-
3. Europe
- 3.1. United Kingdom
- 3.2. Germany
- 3.3. France
- 3.4. Italy
- 3.5. Spain
- 3.6. Russia
- 3.7. Benelux
- 3.8. Nordics
- 3.9. Rest of Europe
-
4. Middle East & Africa
- 4.1. Turkey
- 4.2. Israel
- 4.3. GCC
- 4.4. North Africa
- 4.5. South Africa
- 4.6. Rest of Middle East & Africa
-
5. Asia Pacific
- 5.1. China
- 5.2. India
- 5.3. Japan
- 5.4. South Korea
- 5.5. ASEAN
- 5.6. Oceania
- 5.7. Rest of Asia Pacific
Blood Glucose Monitoring Market in US REPORT HIGHLIGHTS
| Aspects | Details |
|---|---|
| Study Period | 2019-2033 |
| Base Year | 2024 |
| Estimated Year | 2025 |
| Forecast Period | 2025-2033 |
| Historical Period | 2019-2024 |
| Growth Rate | CAGR of 13.00% from 2019-2033 |
| Segmentation |
|
Table of Contents
- 1. Introduction
- 1.1. Research Scope
- 1.2. Market Segmentation
- 1.3. Research Methodology
- 1.4. Definitions and Assumptions
- 2. Executive Summary
- 2.1. Introduction
- 3. Market Dynamics
- 3.1. Introduction
- 3.2. Market Drivers
- 3.2.1. Rising Prevalence of Cancer Worldwide; Technological Advancements in Diagnostic Testing; Increasing Demand for Point-of-care Treatment
- 3.3. Market Restrains
- 3.3.1. High Cost of Molecular Diagnostic Tests; Lack of Skilled Workforce and Stringent Regulatory Framework
- 3.4. Market Trends
- 3.4.1. Rising Diabetes Prevalence in the United States
- 4. Market Factor Analysis
- 4.1. Porters Five Forces
- 4.2. Supply/Value Chain
- 4.3. PESTEL analysis
- 4.4. Market Entropy
- 4.5. Patent/Trademark Analysis
- 5. Global Blood Glucose Monitoring Market in US Analysis, Insights and Forecast, 2019-2031
- 5.1. Market Analysis, Insights and Forecast - by Self-mon
- 5.1.1. Glucometer Devices
- 5.1.2. Test Strips
- 5.1.3. Lancets
- 5.2. Market Analysis, Insights and Forecast - by Continuo
- 5.2.1. Sensors
- 5.2.2. Durables (Receivers and Transmitters)
- 5.3. Market Analysis, Insights and Forecast - by Region
- 5.3.1. North America
- 5.3.2. South America
- 5.3.3. Europe
- 5.3.4. Middle East & Africa
- 5.3.5. Asia Pacific
- 5.1. Market Analysis, Insights and Forecast - by Self-mon
- 6. North America Blood Glucose Monitoring Market in US Analysis, Insights and Forecast, 2019-2031
- 6.1. Market Analysis, Insights and Forecast - by Self-mon
- 6.1.1. Glucometer Devices
- 6.1.2. Test Strips
- 6.1.3. Lancets
- 6.2. Market Analysis, Insights and Forecast - by Continuo
- 6.2.1. Sensors
- 6.2.2. Durables (Receivers and Transmitters)
- 6.1. Market Analysis, Insights and Forecast - by Self-mon
- 7. South America Blood Glucose Monitoring Market in US Analysis, Insights and Forecast, 2019-2031
- 7.1. Market Analysis, Insights and Forecast - by Self-mon
- 7.1.1. Glucometer Devices
- 7.1.2. Test Strips
- 7.1.3. Lancets
- 7.2. Market Analysis, Insights and Forecast - by Continuo
- 7.2.1. Sensors
- 7.2.2. Durables (Receivers and Transmitters)
- 7.1. Market Analysis, Insights and Forecast - by Self-mon
- 8. Europe Blood Glucose Monitoring Market in US Analysis, Insights and Forecast, 2019-2031
- 8.1. Market Analysis, Insights and Forecast - by Self-mon
- 8.1.1. Glucometer Devices
- 8.1.2. Test Strips
- 8.1.3. Lancets
- 8.2. Market Analysis, Insights and Forecast - by Continuo
- 8.2.1. Sensors
- 8.2.2. Durables (Receivers and Transmitters)
- 8.1. Market Analysis, Insights and Forecast - by Self-mon
- 9. Middle East & Africa Blood Glucose Monitoring Market in US Analysis, Insights and Forecast, 2019-2031
- 9.1. Market Analysis, Insights and Forecast - by Self-mon
- 9.1.1. Glucometer Devices
- 9.1.2. Test Strips
- 9.1.3. Lancets
- 9.2. Market Analysis, Insights and Forecast - by Continuo
- 9.2.1. Sensors
- 9.2.2. Durables (Receivers and Transmitters)
- 9.1. Market Analysis, Insights and Forecast - by Self-mon
- 10. Asia Pacific Blood Glucose Monitoring Market in US Analysis, Insights and Forecast, 2019-2031
- 10.1. Market Analysis, Insights and Forecast - by Self-mon
- 10.1.1. Glucometer Devices
- 10.1.2. Test Strips
- 10.1.3. Lancets
- 10.2. Market Analysis, Insights and Forecast - by Continuo
- 10.2.1. Sensors
- 10.2.2. Durables (Receivers and Transmitters)
- 10.1. Market Analysis, Insights and Forecast - by Self-mon
- 11. Northeast Blood Glucose Monitoring Market in US Analysis, Insights and Forecast, 2019-2031
- 12. Southeast Blood Glucose Monitoring Market in US Analysis, Insights and Forecast, 2019-2031
- 13. Midwest Blood Glucose Monitoring Market in US Analysis, Insights and Forecast, 2019-2031
- 14. Southwest Blood Glucose Monitoring Market in US Analysis, Insights and Forecast, 2019-2031
- 15. West Blood Glucose Monitoring Market in US Analysis, Insights and Forecast, 2019-2031
- 16. Competitive Analysis
- 16.1. Global Market Share Analysis 2024
- 16.2. Company Profiles
- 16.2.1 Acon Laboratories Inc
- 16.2.1.1. Overview
- 16.2.1.2. Products
- 16.2.1.3. SWOT Analysis
- 16.2.1.4. Recent Developments
- 16.2.1.5. Financials (Based on Availability)
- 16.2.2 Medtronic PLC
- 16.2.2.1. Overview
- 16.2.2.2. Products
- 16.2.2.3. SWOT Analysis
- 16.2.2.4. Recent Developments
- 16.2.2.5. Financials (Based on Availability)
- 16.2.3 Agamatrix Inc
- 16.2.3.1. Overview
- 16.2.3.2. Products
- 16.2.3.3. SWOT Analysis
- 16.2.3.4. Recent Developments
- 16.2.3.5. Financials (Based on Availability)
- 16.2.4 Self-monitoring Blood Glucose Devices
- 16.2.4.1. Overview
- 16.2.4.2. Products
- 16.2.4.3. SWOT Analysis
- 16.2.4.4. Recent Developments
- 16.2.4.5. Financials (Based on Availability)
- 16.2.5 Rossmax International Ltd
- 16.2.5.1. Overview
- 16.2.5.2. Products
- 16.2.5.3. SWOT Analysis
- 16.2.5.4. Recent Developments
- 16.2.5.5. Financials (Based on Availability)
- 16.2.6 Bionime Corporation
- 16.2.6.1. Overview
- 16.2.6.2. Products
- 16.2.6.3. SWOT Analysis
- 16.2.6.4. Recent Developments
- 16.2.6.5. Financials (Based on Availability)
- 16.2.7 Trivida Functional Medicine
- 16.2.7.1. Overview
- 16.2.7.2. Products
- 16.2.7.3. SWOT Analysis
- 16.2.7.4. Recent Developments
- 16.2.7.5. Financials (Based on Availability)
- 16.2.8 Abbott Diabetes Care
- 16.2.8.1. Overview
- 16.2.8.2. Products
- 16.2.8.3. SWOT Analysis
- 16.2.8.4. Recent Developments
- 16.2.8.5. Financials (Based on Availability)
- 16.2.9 LifeScan
- 16.2.9.1. Overview
- 16.2.9.2. Products
- 16.2.9.3. SWOT Analysis
- 16.2.9.4. Recent Developments
- 16.2.9.5. Financials (Based on Availability)
- 16.2.10 Dexcom Inc
- 16.2.10.1. Overview
- 16.2.10.2. Products
- 16.2.10.3. SWOT Analysis
- 16.2.10.4. Recent Developments
- 16.2.10.5. Financials (Based on Availability)
- 16.2.11 Roche Holding AG
- 16.2.11.1. Overview
- 16.2.11.2. Products
- 16.2.11.3. SWOT Analysis
- 16.2.11.4. Recent Developments
- 16.2.11.5. Financials (Based on Availability)
- 16.2.12 Arkray Inc
- 16.2.12.1. Overview
- 16.2.12.2. Products
- 16.2.12.3. SWOT Analysis
- 16.2.12.4. Recent Developments
- 16.2.12.5. Financials (Based on Availability)
- 16.2.13 Ascensia Diabetes Care
- 16.2.13.1. Overview
- 16.2.13.2. Products
- 16.2.13.3. SWOT Analysis
- 16.2.13.4. Recent Developments
- 16.2.13.5. Financials (Based on Availability)
- 16.2.1 Acon Laboratories Inc
List of Figures
- Figure 1: Global Blood Glucose Monitoring Market in US Revenue Breakdown (Million, %) by Region 2024 & 2032
- Figure 2: Global Blood Glucose Monitoring Market in US Volume Breakdown (K Unit, %) by Region 2024 & 2032
- Figure 3: United states Blood Glucose Monitoring Market in US Revenue (Million), by Country 2024 & 2032
- Figure 4: United states Blood Glucose Monitoring Market in US Volume (K Unit), by Country 2024 & 2032
- Figure 5: United states Blood Glucose Monitoring Market in US Revenue Share (%), by Country 2024 & 2032
- Figure 6: United states Blood Glucose Monitoring Market in US Volume Share (%), by Country 2024 & 2032
- Figure 7: North America Blood Glucose Monitoring Market in US Revenue (Million), by Self-mon 2024 & 2032
- Figure 8: North America Blood Glucose Monitoring Market in US Volume (K Unit), by Self-mon 2024 & 2032
- Figure 9: North America Blood Glucose Monitoring Market in US Revenue Share (%), by Self-mon 2024 & 2032
- Figure 10: North America Blood Glucose Monitoring Market in US Volume Share (%), by Self-mon 2024 & 2032
- Figure 11: North America Blood Glucose Monitoring Market in US Revenue (Million), by Continuo 2024 & 2032
- Figure 12: North America Blood Glucose Monitoring Market in US Volume (K Unit), by Continuo 2024 & 2032
- Figure 13: North America Blood Glucose Monitoring Market in US Revenue Share (%), by Continuo 2024 & 2032
- Figure 14: North America Blood Glucose Monitoring Market in US Volume Share (%), by Continuo 2024 & 2032
- Figure 15: North America Blood Glucose Monitoring Market in US Revenue (Million), by Country 2024 & 2032
- Figure 16: North America Blood Glucose Monitoring Market in US Volume (K Unit), by Country 2024 & 2032
- Figure 17: North America Blood Glucose Monitoring Market in US Revenue Share (%), by Country 2024 & 2032
- Figure 18: North America Blood Glucose Monitoring Market in US Volume Share (%), by Country 2024 & 2032
- Figure 19: South America Blood Glucose Monitoring Market in US Revenue (Million), by Self-mon 2024 & 2032
- Figure 20: South America Blood Glucose Monitoring Market in US Volume (K Unit), by Self-mon 2024 & 2032
- Figure 21: South America Blood Glucose Monitoring Market in US Revenue Share (%), by Self-mon 2024 & 2032
- Figure 22: South America Blood Glucose Monitoring Market in US Volume Share (%), by Self-mon 2024 & 2032
- Figure 23: South America Blood Glucose Monitoring Market in US Revenue (Million), by Continuo 2024 & 2032
- Figure 24: South America Blood Glucose Monitoring Market in US Volume (K Unit), by Continuo 2024 & 2032
- Figure 25: South America Blood Glucose Monitoring Market in US Revenue Share (%), by Continuo 2024 & 2032
- Figure 26: South America Blood Glucose Monitoring Market in US Volume Share (%), by Continuo 2024 & 2032
- Figure 27: South America Blood Glucose Monitoring Market in US Revenue (Million), by Country 2024 & 2032
- Figure 28: South America Blood Glucose Monitoring Market in US Volume (K Unit), by Country 2024 & 2032
- Figure 29: South America Blood Glucose Monitoring Market in US Revenue Share (%), by Country 2024 & 2032
- Figure 30: South America Blood Glucose Monitoring Market in US Volume Share (%), by Country 2024 & 2032
- Figure 31: Europe Blood Glucose Monitoring Market in US Revenue (Million), by Self-mon 2024 & 2032
- Figure 32: Europe Blood Glucose Monitoring Market in US Volume (K Unit), by Self-mon 2024 & 2032
- Figure 33: Europe Blood Glucose Monitoring Market in US Revenue Share (%), by Self-mon 2024 & 2032
- Figure 34: Europe Blood Glucose Monitoring Market in US Volume Share (%), by Self-mon 2024 & 2032
- Figure 35: Europe Blood Glucose Monitoring Market in US Revenue (Million), by Continuo 2024 & 2032
- Figure 36: Europe Blood Glucose Monitoring Market in US Volume (K Unit), by Continuo 2024 & 2032
- Figure 37: Europe Blood Glucose Monitoring Market in US Revenue Share (%), by Continuo 2024 & 2032
- Figure 38: Europe Blood Glucose Monitoring Market in US Volume Share (%), by Continuo 2024 & 2032
- Figure 39: Europe Blood Glucose Monitoring Market in US Revenue (Million), by Country 2024 & 2032
- Figure 40: Europe Blood Glucose Monitoring Market in US Volume (K Unit), by Country 2024 & 2032
- Figure 41: Europe Blood Glucose Monitoring Market in US Revenue Share (%), by Country 2024 & 2032
- Figure 42: Europe Blood Glucose Monitoring Market in US Volume Share (%), by Country 2024 & 2032
- Figure 43: Middle East & Africa Blood Glucose Monitoring Market in US Revenue (Million), by Self-mon 2024 & 2032
- Figure 44: Middle East & Africa Blood Glucose Monitoring Market in US Volume (K Unit), by Self-mon 2024 & 2032
- Figure 45: Middle East & Africa Blood Glucose Monitoring Market in US Revenue Share (%), by Self-mon 2024 & 2032
- Figure 46: Middle East & Africa Blood Glucose Monitoring Market in US Volume Share (%), by Self-mon 2024 & 2032
- Figure 47: Middle East & Africa Blood Glucose Monitoring Market in US Revenue (Million), by Continuo 2024 & 2032
- Figure 48: Middle East & Africa Blood Glucose Monitoring Market in US Volume (K Unit), by Continuo 2024 & 2032
- Figure 49: Middle East & Africa Blood Glucose Monitoring Market in US Revenue Share (%), by Continuo 2024 & 2032
- Figure 50: Middle East & Africa Blood Glucose Monitoring Market in US Volume Share (%), by Continuo 2024 & 2032
- Figure 51: Middle East & Africa Blood Glucose Monitoring Market in US Revenue (Million), by Country 2024 & 2032
- Figure 52: Middle East & Africa Blood Glucose Monitoring Market in US Volume (K Unit), by Country 2024 & 2032
- Figure 53: Middle East & Africa Blood Glucose Monitoring Market in US Revenue Share (%), by Country 2024 & 2032
- Figure 54: Middle East & Africa Blood Glucose Monitoring Market in US Volume Share (%), by Country 2024 & 2032
- Figure 55: Asia Pacific Blood Glucose Monitoring Market in US Revenue (Million), by Self-mon 2024 & 2032
- Figure 56: Asia Pacific Blood Glucose Monitoring Market in US Volume (K Unit), by Self-mon 2024 & 2032
- Figure 57: Asia Pacific Blood Glucose Monitoring Market in US Revenue Share (%), by Self-mon 2024 & 2032
- Figure 58: Asia Pacific Blood Glucose Monitoring Market in US Volume Share (%), by Self-mon 2024 & 2032
- Figure 59: Asia Pacific Blood Glucose Monitoring Market in US Revenue (Million), by Continuo 2024 & 2032
- Figure 60: Asia Pacific Blood Glucose Monitoring Market in US Volume (K Unit), by Continuo 2024 & 2032
- Figure 61: Asia Pacific Blood Glucose Monitoring Market in US Revenue Share (%), by Continuo 2024 & 2032
- Figure 62: Asia Pacific Blood Glucose Monitoring Market in US Volume Share (%), by Continuo 2024 & 2032
- Figure 63: Asia Pacific Blood Glucose Monitoring Market in US Revenue (Million), by Country 2024 & 2032
- Figure 64: Asia Pacific Blood Glucose Monitoring Market in US Volume (K Unit), by Country 2024 & 2032
- Figure 65: Asia Pacific Blood Glucose Monitoring Market in US Revenue Share (%), by Country 2024 & 2032
- Figure 66: Asia Pacific Blood Glucose Monitoring Market in US Volume Share (%), by Country 2024 & 2032
List of Tables
- Table 1: Global Blood Glucose Monitoring Market in US Revenue Million Forecast, by Region 2019 & 2032
- Table 2: Global Blood Glucose Monitoring Market in US Volume K Unit Forecast, by Region 2019 & 2032
- Table 3: Global Blood Glucose Monitoring Market in US Revenue Million Forecast, by Self-mon 2019 & 2032
- Table 4: Global Blood Glucose Monitoring Market in US Volume K Unit Forecast, by Self-mon 2019 & 2032
- Table 5: Global Blood Glucose Monitoring Market in US Revenue Million Forecast, by Continuo 2019 & 2032
- Table 6: Global Blood Glucose Monitoring Market in US Volume K Unit Forecast, by Continuo 2019 & 2032
- Table 7: Global Blood Glucose Monitoring Market in US Revenue Million Forecast, by Region 2019 & 2032
- Table 8: Global Blood Glucose Monitoring Market in US Volume K Unit Forecast, by Region 2019 & 2032
- Table 9: Global Blood Glucose Monitoring Market in US Revenue Million Forecast, by Country 2019 & 2032
- Table 10: Global Blood Glucose Monitoring Market in US Volume K Unit Forecast, by Country 2019 & 2032
- Table 11: Northeast Blood Glucose Monitoring Market in US Revenue (Million) Forecast, by Application 2019 & 2032
- Table 12: Northeast Blood Glucose Monitoring Market in US Volume (K Unit) Forecast, by Application 2019 & 2032
- Table 13: Southeast Blood Glucose Monitoring Market in US Revenue (Million) Forecast, by Application 2019 & 2032
- Table 14: Southeast Blood Glucose Monitoring Market in US Volume (K Unit) Forecast, by Application 2019 & 2032
- Table 15: Midwest Blood Glucose Monitoring Market in US Revenue (Million) Forecast, by Application 2019 & 2032
- Table 16: Midwest Blood Glucose Monitoring Market in US Volume (K Unit) Forecast, by Application 2019 & 2032
- Table 17: Southwest Blood Glucose Monitoring Market in US Revenue (Million) Forecast, by Application 2019 & 2032
- Table 18: Southwest Blood Glucose Monitoring Market in US Volume (K Unit) Forecast, by Application 2019 & 2032
- Table 19: West Blood Glucose Monitoring Market in US Revenue (Million) Forecast, by Application 2019 & 2032
- Table 20: West Blood Glucose Monitoring Market in US Volume (K Unit) Forecast, by Application 2019 & 2032
- Table 21: Global Blood Glucose Monitoring Market in US Revenue Million Forecast, by Self-mon 2019 & 2032
- Table 22: Global Blood Glucose Monitoring Market in US Volume K Unit Forecast, by Self-mon 2019 & 2032
- Table 23: Global Blood Glucose Monitoring Market in US Revenue Million Forecast, by Continuo 2019 & 2032
- Table 24: Global Blood Glucose Monitoring Market in US Volume K Unit Forecast, by Continuo 2019 & 2032
- Table 25: Global Blood Glucose Monitoring Market in US Revenue Million Forecast, by Country 2019 & 2032
- Table 26: Global Blood Glucose Monitoring Market in US Volume K Unit Forecast, by Country 2019 & 2032
- Table 27: United States Blood Glucose Monitoring Market in US Revenue (Million) Forecast, by Application 2019 & 2032
- Table 28: United States Blood Glucose Monitoring Market in US Volume (K Unit) Forecast, by Application 2019 & 2032
- Table 29: Canada Blood Glucose Monitoring Market in US Revenue (Million) Forecast, by Application 2019 & 2032
- Table 30: Canada Blood Glucose Monitoring Market in US Volume (K Unit) Forecast, by Application 2019 & 2032
- Table 31: Mexico Blood Glucose Monitoring Market in US Revenue (Million) Forecast, by Application 2019 & 2032
- Table 32: Mexico Blood Glucose Monitoring Market in US Volume (K Unit) Forecast, by Application 2019 & 2032
- Table 33: Global Blood Glucose Monitoring Market in US Revenue Million Forecast, by Self-mon 2019 & 2032
- Table 34: Global Blood Glucose Monitoring Market in US Volume K Unit Forecast, by Self-mon 2019 & 2032
- Table 35: Global Blood Glucose Monitoring Market in US Revenue Million Forecast, by Continuo 2019 & 2032
- Table 36: Global Blood Glucose Monitoring Market in US Volume K Unit Forecast, by Continuo 2019 & 2032
- Table 37: Global Blood Glucose Monitoring Market in US Revenue Million Forecast, by Country 2019 & 2032
- Table 38: Global Blood Glucose Monitoring Market in US Volume K Unit Forecast, by Country 2019 & 2032
- Table 39: Brazil Blood Glucose Monitoring Market in US Revenue (Million) Forecast, by Application 2019 & 2032
- Table 40: Brazil Blood Glucose Monitoring Market in US Volume (K Unit) Forecast, by Application 2019 & 2032
- Table 41: Argentina Blood Glucose Monitoring Market in US Revenue (Million) Forecast, by Application 2019 & 2032
- Table 42: Argentina Blood Glucose Monitoring Market in US Volume (K Unit) Forecast, by Application 2019 & 2032
- Table 43: Rest of South America Blood Glucose Monitoring Market in US Revenue (Million) Forecast, by Application 2019 & 2032
- Table 44: Rest of South America Blood Glucose Monitoring Market in US Volume (K Unit) Forecast, by Application 2019 & 2032
- Table 45: Global Blood Glucose Monitoring Market in US Revenue Million Forecast, by Self-mon 2019 & 2032
- Table 46: Global Blood Glucose Monitoring Market in US Volume K Unit Forecast, by Self-mon 2019 & 2032
- Table 47: Global Blood Glucose Monitoring Market in US Revenue Million Forecast, by Continuo 2019 & 2032
- Table 48: Global Blood Glucose Monitoring Market in US Volume K Unit Forecast, by Continuo 2019 & 2032
- Table 49: Global Blood Glucose Monitoring Market in US Revenue Million Forecast, by Country 2019 & 2032
- Table 50: Global Blood Glucose Monitoring Market in US Volume K Unit Forecast, by Country 2019 & 2032
- Table 51: United Kingdom Blood Glucose Monitoring Market in US Revenue (Million) Forecast, by Application 2019 & 2032
- Table 52: United Kingdom Blood Glucose Monitoring Market in US Volume (K Unit) Forecast, by Application 2019 & 2032
- Table 53: Germany Blood Glucose Monitoring Market in US Revenue (Million) Forecast, by Application 2019 & 2032
- Table 54: Germany Blood Glucose Monitoring Market in US Volume (K Unit) Forecast, by Application 2019 & 2032
- Table 55: France Blood Glucose Monitoring Market in US Revenue (Million) Forecast, by Application 2019 & 2032
- Table 56: France Blood Glucose Monitoring Market in US Volume (K Unit) Forecast, by Application 2019 & 2032
- Table 57: Italy Blood Glucose Monitoring Market in US Revenue (Million) Forecast, by Application 2019 & 2032
- Table 58: Italy Blood Glucose Monitoring Market in US Volume (K Unit) Forecast, by Application 2019 & 2032
- Table 59: Spain Blood Glucose Monitoring Market in US Revenue (Million) Forecast, by Application 2019 & 2032
- Table 60: Spain Blood Glucose Monitoring Market in US Volume (K Unit) Forecast, by Application 2019 & 2032
- Table 61: Russia Blood Glucose Monitoring Market in US Revenue (Million) Forecast, by Application 2019 & 2032
- Table 62: Russia Blood Glucose Monitoring Market in US Volume (K Unit) Forecast, by Application 2019 & 2032
- Table 63: Benelux Blood Glucose Monitoring Market in US Revenue (Million) Forecast, by Application 2019 & 2032
- Table 64: Benelux Blood Glucose Monitoring Market in US Volume (K Unit) Forecast, by Application 2019 & 2032
- Table 65: Nordics Blood Glucose Monitoring Market in US Revenue (Million) Forecast, by Application 2019 & 2032
- Table 66: Nordics Blood Glucose Monitoring Market in US Volume (K Unit) Forecast, by Application 2019 & 2032
- Table 67: Rest of Europe Blood Glucose Monitoring Market in US Revenue (Million) Forecast, by Application 2019 & 2032
- Table 68: Rest of Europe Blood Glucose Monitoring Market in US Volume (K Unit) Forecast, by Application 2019 & 2032
- Table 69: Global Blood Glucose Monitoring Market in US Revenue Million Forecast, by Self-mon 2019 & 2032
- Table 70: Global Blood Glucose Monitoring Market in US Volume K Unit Forecast, by Self-mon 2019 & 2032
- Table 71: Global Blood Glucose Monitoring Market in US Revenue Million Forecast, by Continuo 2019 & 2032
- Table 72: Global Blood Glucose Monitoring Market in US Volume K Unit Forecast, by Continuo 2019 & 2032
- Table 73: Global Blood Glucose Monitoring Market in US Revenue Million Forecast, by Country 2019 & 2032
- Table 74: Global Blood Glucose Monitoring Market in US Volume K Unit Forecast, by Country 2019 & 2032
- Table 75: Turkey Blood Glucose Monitoring Market in US Revenue (Million) Forecast, by Application 2019 & 2032
- Table 76: Turkey Blood Glucose Monitoring Market in US Volume (K Unit) Forecast, by Application 2019 & 2032
- Table 77: Israel Blood Glucose Monitoring Market in US Revenue (Million) Forecast, by Application 2019 & 2032
- Table 78: Israel Blood Glucose Monitoring Market in US Volume (K Unit) Forecast, by Application 2019 & 2032
- Table 79: GCC Blood Glucose Monitoring Market in US Revenue (Million) Forecast, by Application 2019 & 2032
- Table 80: GCC Blood Glucose Monitoring Market in US Volume (K Unit) Forecast, by Application 2019 & 2032
- Table 81: North Africa Blood Glucose Monitoring Market in US Revenue (Million) Forecast, by Application 2019 & 2032
- Table 82: North Africa Blood Glucose Monitoring Market in US Volume (K Unit) Forecast, by Application 2019 & 2032
- Table 83: South Africa Blood Glucose Monitoring Market in US Revenue (Million) Forecast, by Application 2019 & 2032
- Table 84: South Africa Blood Glucose Monitoring Market in US Volume (K Unit) Forecast, by Application 2019 & 2032
- Table 85: Rest of Middle East & Africa Blood Glucose Monitoring Market in US Revenue (Million) Forecast, by Application 2019 & 2032
- Table 86: Rest of Middle East & Africa Blood Glucose Monitoring Market in US Volume (K Unit) Forecast, by Application 2019 & 2032
- Table 87: Global Blood Glucose Monitoring Market in US Revenue Million Forecast, by Self-mon 2019 & 2032
- Table 88: Global Blood Glucose Monitoring Market in US Volume K Unit Forecast, by Self-mon 2019 & 2032
- Table 89: Global Blood Glucose Monitoring Market in US Revenue Million Forecast, by Continuo 2019 & 2032
- Table 90: Global Blood Glucose Monitoring Market in US Volume K Unit Forecast, by Continuo 2019 & 2032
- Table 91: Global Blood Glucose Monitoring Market in US Revenue Million Forecast, by Country 2019 & 2032
- Table 92: Global Blood Glucose Monitoring Market in US Volume K Unit Forecast, by Country 2019 & 2032
- Table 93: China Blood Glucose Monitoring Market in US Revenue (Million) Forecast, by Application 2019 & 2032
- Table 94: China Blood Glucose Monitoring Market in US Volume (K Unit) Forecast, by Application 2019 & 2032
- Table 95: India Blood Glucose Monitoring Market in US Revenue (Million) Forecast, by Application 2019 & 2032
- Table 96: India Blood Glucose Monitoring Market in US Volume (K Unit) Forecast, by Application 2019 & 2032
- Table 97: Japan Blood Glucose Monitoring Market in US Revenue (Million) Forecast, by Application 2019 & 2032
- Table 98: Japan Blood Glucose Monitoring Market in US Volume (K Unit) Forecast, by Application 2019 & 2032
- Table 99: South Korea Blood Glucose Monitoring Market in US Revenue (Million) Forecast, by Application 2019 & 2032
- Table 100: South Korea Blood Glucose Monitoring Market in US Volume (K Unit) Forecast, by Application 2019 & 2032
- Table 101: ASEAN Blood Glucose Monitoring Market in US Revenue (Million) Forecast, by Application 2019 & 2032
- Table 102: ASEAN Blood Glucose Monitoring Market in US Volume (K Unit) Forecast, by Application 2019 & 2032
- Table 103: Oceania Blood Glucose Monitoring Market in US Revenue (Million) Forecast, by Application 2019 & 2032
- Table 104: Oceania Blood Glucose Monitoring Market in US Volume (K Unit) Forecast, by Application 2019 & 2032
- Table 105: Rest of Asia Pacific Blood Glucose Monitoring Market in US Revenue (Million) Forecast, by Application 2019 & 2032
- Table 106: Rest of Asia Pacific Blood Glucose Monitoring Market in US Volume (K Unit) Forecast, by Application 2019 & 2032
Frequently Asked Questions
1. What is the projected Compound Annual Growth Rate (CAGR) of the Blood Glucose Monitoring Market in US?
The projected CAGR is approximately 13.00%.
2. Which companies are prominent players in the Blood Glucose Monitoring Market in US?
Key companies in the market include Acon Laboratories Inc, Medtronic PLC, Agamatrix Inc, Self-monitoring Blood Glucose Devices, Rossmax International Ltd, Bionime Corporation, Trivida Functional Medicine, Abbott Diabetes Care, LifeScan, Dexcom Inc, Roche Holding AG, Arkray Inc, Ascensia Diabetes Care.
3. What are the main segments of the Blood Glucose Monitoring Market in US?
The market segments include Self-mon, Continuo.
4. Can you provide details about the market size?
The market size is estimated to be USD 14.24 Million as of 2022.
5. What are some drivers contributing to market growth?
Rising Prevalence of Cancer Worldwide; Technological Advancements in Diagnostic Testing; Increasing Demand for Point-of-care Treatment.
6. What are the notable trends driving market growth?
Rising Diabetes Prevalence in the United States.
7. Are there any restraints impacting market growth?
High Cost of Molecular Diagnostic Tests; Lack of Skilled Workforce and Stringent Regulatory Framework.
8. Can you provide examples of recent developments in the market?
N/A
9. What pricing options are available for accessing the report?
Pricing options include single-user, multi-user, and enterprise licenses priced at USD 3800, USD 4500, and USD 5800 respectively.
10. Is the market size provided in terms of value or volume?
The market size is provided in terms of value, measured in Million and volume, measured in K Unit.
11. Are there any specific market keywords associated with the report?
Yes, the market keyword associated with the report is "Blood Glucose Monitoring Market in US," which aids in identifying and referencing the specific market segment covered.
12. How do I determine which pricing option suits my needs best?
The pricing options vary based on user requirements and access needs. Individual users may opt for single-user licenses, while businesses requiring broader access may choose multi-user or enterprise licenses for cost-effective access to the report.
13. Are there any additional resources or data provided in the Blood Glucose Monitoring Market in US report?
While the report offers comprehensive insights, it's advisable to review the specific contents or supplementary materials provided to ascertain if additional resources or data are available.
14. How can I stay updated on further developments or reports in the Blood Glucose Monitoring Market in US?
To stay informed about further developments, trends, and reports in the Blood Glucose Monitoring Market in US, consider subscribing to industry newsletters, following relevant companies and organizations, or regularly checking reputable industry news sources and publications.
Methodology
Step 1 - Identification of Relevant Samples Size from Population Database


Step 2 - Approaches for Defining Global Market Size (Value, Volume* & Price*)

Note*: In applicable scenarios
Step 3 - Data Sources
Primary Research
- Web Analytics
- Survey Reports
- Research Institute
- Latest Research Reports
- Opinion Leaders
Secondary Research
- Annual Reports
- White Paper
- Latest Press Release
- Industry Association
- Paid Database
- Investor Presentations

Step 4 - Data Triangulation
Involves using different sources of information in order to increase the validity of a study
These sources are likely to be stakeholders in a program - participants, other researchers, program staff, other community members, and so on.
Then we put all data in single framework & apply various statistical tools to find out the dynamic on the market.
During the analysis stage, feedback from the stakeholder groups would be compared to determine areas of agreement as well as areas of divergence


