

Key Insights
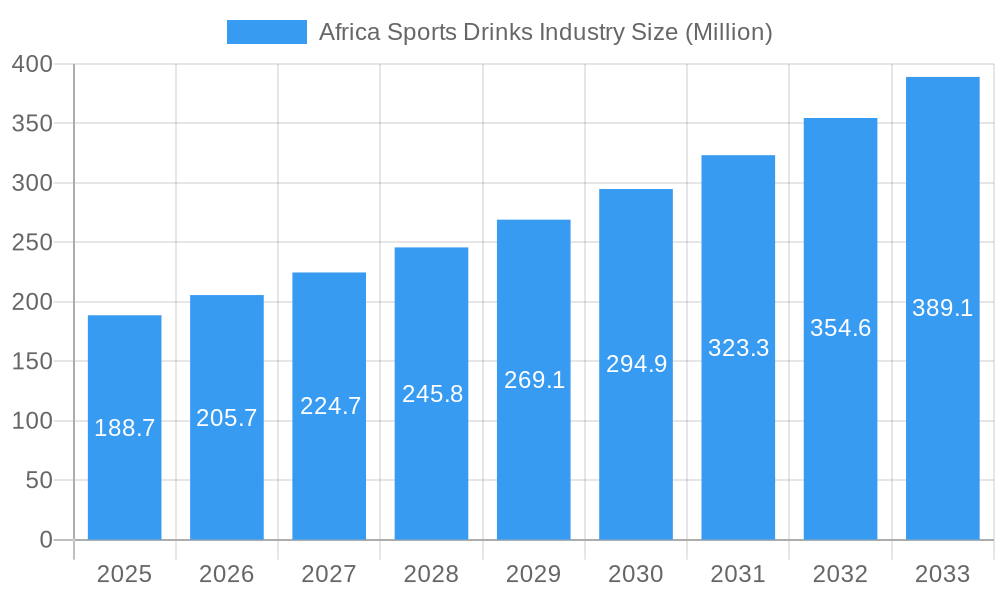
The African sports drinks market is poised for significant expansion, with an estimated market size of $188.7 million in 2025 and a projected Compound Annual Growth Rate (CAGR) of 9.01% through 2033. This robust growth is primarily fueled by increasing health and fitness consciousness across the continent, a rising disposable income among urban populations, and a growing appreciation for functional beverages that support active lifestyles. As awareness of the benefits of hydration and electrolyte replenishment during physical activity grows, so does the demand for specialized sports drinks. The market's dynamic nature is further supported by evolving distribution networks, with online retail and convenience stores emerging as crucial channels alongside traditional supermarkets and hypermarkets, making these products more accessible to a wider consumer base.
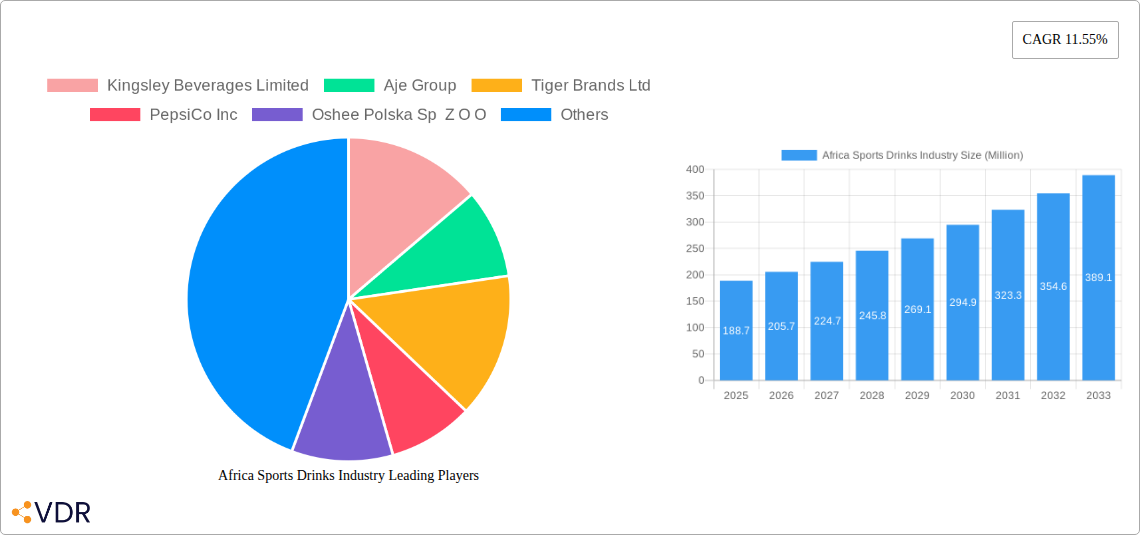
Africa Sports Drinks Industry Market Size (In Million)
The market's trajectory is shaped by a diverse range of product offerings and packaging innovations. Key segments include electrolyte-enhanced water, isotonic, and hypotonic drinks, catering to various hydration needs, alongside emerging protein-based sport drinks appealing to a more performance-oriented consumer. Innovations in packaging, such as aseptic packages and metal cans, are gaining traction due to their convenience, sustainability, and ability to preserve product quality. While the market is propelled by these positive trends, potential restraints such as fluctuating raw material costs and intense competition from established global players and emerging local brands necessitate strategic approaches from market participants. Key regions like Nigeria and South Africa are expected to lead this growth, driven by their large populations and developing economies.
Africa Sports Drinks Industry Company Market Share
Africa Sports Drinks Industry Report: Market Dynamics, Growth Trends, and Key Player Analysis (2019–2033)
This comprehensive report provides an in-depth analysis of the Africa Sports Drinks Industry, covering market dynamics, growth trends, regional dominance, product landscape, key drivers, challenges, opportunities, and the strategic moves of major players. With a study period from 2019 to 2033, including a base year of 2025 and a forecast period of 2025–2033, this report offers critical insights for industry stakeholders, investors, and market strategists looking to capitalize on the burgeoning African sports beverage market.
Africa Sports Drinks Industry Market Dynamics & Structure
The Africa sports drinks market is characterized by a moderate market concentration, with a few large multinational corporations holding significant share alongside a growing number of regional and local players. Technological innovation is primarily driven by the demand for healthier formulations, improved hydration benefits, and functional ingredients. Regulatory frameworks are evolving, with a growing focus on sugar content and health claims, influencing product development and marketing strategies. Competitive product substitutes, including water, juices, and other functional beverages, present a constant challenge. End-user demographics are shifting, with a rise in health-conscious consumers, athletes of all levels, and individuals seeking convenient hydration solutions. Merger and acquisition (M&A) trends are on the rise as larger companies seek to expand their reach and product portfolios in this dynamic continent.
- Market Concentration: Dominated by global giants, with increasing influence of local brands.
- Technological Innovation Drivers: Focus on low-sugar/sugar-free variants, natural ingredients, and enhanced electrolyte formulations.
- Regulatory Frameworks: Increasing scrutiny on sugar content and ingredient transparency, promoting healthier options.
- Competitive Product Substitutes: Traditional beverages and emerging functional drinks pose competition.
- End-User Demographics: Growing middle class, active lifestyles, and increasing health awareness drive demand.
- M&A Trends: Strategic acquisitions to gain market share and expand distribution networks.
Africa Sports Drinks Industry Growth Trends & Insights
The Africa sports drinks market is poised for significant expansion, projected to witness a robust Compound Annual Growth Rate (CAGR) during the forecast period. This growth is fueled by a confluence of factors including increasing disposable incomes, a growing awareness of health and fitness benefits associated with sports nutrition, and a youthful demographic actively participating in sports and recreational activities. The adoption rates of sports drinks are steadily rising across the continent, moving beyond elite athletes to encompass everyday consumers seeking performance enhancement and rapid recovery. Technological disruptions, such as advancements in ingredient sourcing and packaging innovations, are further shaping the market. Consumer behavior is shifting towards a preference for healthier, natural, and functional beverage options. The market penetration is expected to deepen as distribution networks expand into previously underserved urban and semi-urban areas, making these products more accessible to a wider population. The ongoing urbanization and increased media exposure to global sports trends are also playing a crucial role in driving consumer demand and awareness.
Dominant Regions, Countries, or Segments in Africa Sports Drinks Industry
The Africa sports drinks industry exhibits dynamic growth across various segments, with Electrolyte-Enhanced Water emerging as a dominant soft drink type. This segment's popularity is driven by its perceived health benefits, suitability for a broad consumer base, and its role in rehydration for both athletes and the general population. The PET Bottles packaging type leads the market due to its convenience, affordability, and widespread availability across diverse distribution channels. Supermarkets/Hypermarkets remain the primary sub-distribution channel, offering accessibility and a wide selection to consumers.
- Dominant Soft Drink Type: Electrolyte-Enhanced Water is a key growth driver, offering versatile hydration benefits.
- Market Share: Estimated at xx% of the total sports drinks market by value.
- Growth Potential: High due to increasing consumer focus on health and hydration.
- Dominant Packaging Type: PET Bottles are favored for their convenience and cost-effectiveness.
- Adoption Rate: High across all market segments, with an estimated xx million units distributed annually.
- Environmental Considerations: Increasing demand for sustainable packaging solutions may influence future trends.
- Dominant Sub-Distribution Channel: Supermarkets/Hypermarkets offer extensive reach and product visibility.
- Contribution to Sales: Account for approximately xx% of total sports drink sales.
- Strategic Importance: Essential for mass-market penetration and brand visibility.
- Key Regional Drivers: North Africa and Sub-Saharan Africa are experiencing significant growth due to rising disposable incomes, increased sporting activities, and a growing health-conscious population. Countries like South Africa, Nigeria, and Egypt are leading the charge in terms of market size and consumption. Economic policies favoring consumer goods and infrastructure development in these regions further propel market expansion.
Africa Sports Drinks Industry Product Landscape
The Africa sports drinks industry is witnessing a surge in product innovation driven by evolving consumer demands and technological advancements. Companies are focusing on developing low-sugar and sugar-free variants, catering to the growing health-conscious demographic. Innovations include the incorporation of natural flavors, functional ingredients such as electrolytes and vitamins, and extended shelf-life formulations. Protein-based sport drinks are gaining traction for post-workout recovery. Performance metrics are being enhanced through scientifically backed formulations aimed at optimizing hydration, energy replenishment, and muscle recovery. Unique selling propositions often revolve around natural ingredients, distinct flavor profiles, and targeted functional benefits for various athletic pursuits and lifestyle needs. Technological advancements in encapsulation and formulation are enabling the creation of more stable and effective sports beverage products.
Key Drivers, Barriers & Challenges in Africa Sports Drinks Industry
The Africa sports drinks industry is propelled by several key drivers. A rising middle class with increased disposable income and a growing emphasis on health and wellness are fundamental. The proliferation of sporting events and fitness culture fuels demand for performance-enhancing beverages. Technological advancements in product formulation and ingredient sourcing contribute to innovation.
Key challenges include supply chain complexities and logistics, particularly in reaching remote areas, leading to higher operational costs. Regulatory hurdles and varying food safety standards across different African nations can hinder market entry and expansion. Intense competition from established global brands and local alternatives, coupled with consumer price sensitivity, also pose significant restraints.
Emerging Opportunities in Africa Sports Drinks Industry
Emerging opportunities in the Africa sports drinks industry lie in the untapped potential of rural and peri-urban markets, where access to specialized beverages is limited. There is a growing demand for sports drinks with natural and organic ingredients, aligning with global health trends. Innovative applications, such as hydration solutions tailored for specific climates and indigenous sports, present unique market niches. Evolving consumer preferences for personalized nutrition and functional beverages beyond basic hydration offer avenues for product diversification. The development of sustainable and eco-friendly packaging also presents a significant opportunity for brands to differentiate themselves.
Growth Accelerators in the Africa Sports Drinks Industry Industry
Several catalysts are accelerating the growth of the Africa sports drinks industry. Technological breakthroughs in ingredient science, enabling the creation of more effective and healthier formulations, are a significant driver. Strategic partnerships between local distributors and international beverage giants are expanding market reach and product availability. Government initiatives promoting sports and healthy lifestyles, coupled with increased investment in sports infrastructure, create a more conducive environment for market expansion. The digitalization of retail channels, including online sales platforms and mobile commerce, is also opening new avenues for consumers to access and purchase sports drinks.
Key Players Shaping the Africa Sports Drinks Industry Market
- Kingsley Beverages Limited
- Aje Group
- Tiger Brands Ltd
- PepsiCo Inc
- Oshee Polska Sp Z O O
- Suntory Holdings Limited
- The Coca-Cola Company
- Thirsti Water (Pty) Ltd
- Ekhamanzi Springs (Pty) Ltd
- BOS Brands (Pty) Ltd
- Congo Brands
Notable Milestones in Africa Sports Drinks Industry Sector
- April 2023: Congo LLC announced a USD 8.25 million investment to relocate and expand its Louisville headquarters, creating 500 high-wage jobs. This strategic move signifies significant growth and operational expansion for the company.
- October 2022: Tiger Brands launched a "zero" Energade variant, a sugar-free and low-calorie option available in Lemon and Orange flavors in a 0.5L PET format, catering to health-conscious consumers.
- May 2022: Thirsti Water (Pty) Ltd secured a three-year hydration deal with SuperSport United, marking a significant marketing and sponsorship expansion into the football sector to promote its sports drinks.
In-Depth Africa Sports Drinks Industry Market Outlook
The future outlook for the Africa sports drinks industry is exceptionally promising, driven by a confluence of factors that signal substantial growth potential. The increasing disposable incomes across the continent, coupled with a pervasive shift towards health-conscious living and active lifestyles, will continue to be the primary demand drivers. As urbanization accelerates, so does the accessibility and awareness of specialized beverages like sports drinks, moving them from niche products to mainstream choices. Strategic investments by key players in distribution networks and product innovation, particularly in low-sugar and natural ingredient-based offerings, will further solidify market expansion. The untapped potential in emerging economies within Africa presents significant opportunities for market penetration and diversification, making the coming years crucial for stakeholders aiming to capitalize on this dynamic and expanding market landscape.
Africa Sports Drinks Industry Segmentation
-
1. Soft Drink Type
- 1.1. Electrolyte-Enhanced Water
- 1.2. Hypertonic
- 1.3. Hypotonic
- 1.4. Isotonic
- 1.5. Protein-based Sport Drinks
-
2. Packaging Type
- 2.1. Aseptic packages
- 2.2. Metal Can
- 2.3. PET Bottles
-
3. Sub Distribution Channel
- 3.1. Convenience Stores
- 3.2. Online Retail
- 3.3. Specialty Stores
- 3.4. Supermarket/Hypermarket
- 3.5. Others
Africa Sports Drinks Industry Segmentation By Geography
-
1. Africa
- 1.1. Nigeria
- 1.2. South Africa
- 1.3. Egypt
- 1.4. Kenya
- 1.5. Ethiopia
- 1.6. Morocco
- 1.7. Ghana
- 1.8. Algeria
- 1.9. Tanzania
- 1.10. Ivory Coast
Africa Sports Drinks Industry Regional Market Share
Geographic Coverage of Africa Sports Drinks Industry
Africa Sports Drinks Industry REPORT HIGHLIGHTS
| Aspects | Details |
|---|---|
| Study Period | 2020-2034 |
| Base Year | 2025 |
| Estimated Year | 2026 |
| Forecast Period | 2026-2034 |
| Historical Period | 2020-2025 |
| Growth Rate | CAGR of 6.15% from 2020-2034 |
| Segmentation |
|
Table of Contents
- 1. Introduction
- 1.1. Research Scope
- 1.2. Market Segmentation
- 1.3. Research Objective
- 1.4. Definitions and Assumptions
- 2. Executive Summary
- 2.1. Market Snapshot
- 3. Market Dynamics
- 3.1. Market Drivers
- 3.2. Market Restrains
- 3.3. Market Trends
- 3.4. Market Opportunities
- 4. Market Factor Analysis
- 4.1. Porters Five Forces
- 4.1.1. Bargaining Power of Suppliers
- 4.1.2. Bargaining Power of Buyers
- 4.1.3. Threat of New Entrants
- 4.1.4. Threat of Substitutes
- 4.1.5. Competitive Rivalry
- 4.2. PESTEL analysis
- 4.3. BCG Analysis
- 4.3.1. Stars (High Growth, High Market Share)
- 4.3.2. Cash Cows (Low Growth, High Market Share)
- 4.3.3. Question Mark (High Growth, Low Market Share)
- 4.3.4. Dogs (Low Growth, Low Market Share)
- 4.4. Ansoff Matrix Analysis
- 4.5. Supply Chain Analysis
- 4.6. Regulatory Landscape
- 4.7. Current Market Potential and Opportunity Assessment (TAM–SAM–SOM Framework)
- 4.8. VDR Analyst Note
- 4.1. Porters Five Forces
- 5. Market Analysis, Insights and Forecast 2021-2033
- 5.1. Market Analysis, Insights and Forecast - by Soft Drink Type
- 5.1.1. Electrolyte-Enhanced Water
- 5.1.2. Hypertonic
- 5.1.3. Hypotonic
- 5.1.4. Isotonic
- 5.1.5. Protein-based Sport Drinks
- 5.2. Market Analysis, Insights and Forecast - by Packaging Type
- 5.2.1. Aseptic packages
- 5.2.2. Metal Can
- 5.2.3. PET Bottles
- 5.3. Market Analysis, Insights and Forecast - by Sub Distribution Channel
- 5.3.1. Convenience Stores
- 5.3.2. Online Retail
- 5.3.3. Specialty Stores
- 5.3.4. Supermarket/Hypermarket
- 5.3.5. Others
- 5.4. Market Analysis, Insights and Forecast - by Region
- 5.4.1. Africa
- 5.1. Market Analysis, Insights and Forecast - by Soft Drink Type
- 6. Africa Sports Drinks Industry Analysis, Insights and Forecast, 2021-2033
- 6.1. Market Analysis, Insights and Forecast - by Soft Drink Type
- 6.1.1. Electrolyte-Enhanced Water
- 6.1.2. Hypertonic
- 6.1.3. Hypotonic
- 6.1.4. Isotonic
- 6.1.5. Protein-based Sport Drinks
- 6.2. Market Analysis, Insights and Forecast - by Packaging Type
- 6.2.1. Aseptic packages
- 6.2.2. Metal Can
- 6.2.3. PET Bottles
- 6.3. Market Analysis, Insights and Forecast - by Sub Distribution Channel
- 6.3.1. Convenience Stores
- 6.3.2. Online Retail
- 6.3.3. Specialty Stores
- 6.3.4. Supermarket/Hypermarket
- 6.3.5. Others
- 6.1. Market Analysis, Insights and Forecast - by Soft Drink Type
- 7. Competitive Analysis
- 7.1. Company Profiles
- 7.1.1 Kingsley Beverages Limited
- 7.1.1.1. Company Overview
- 7.1.1.2. Products
- 7.1.1.3. Company Financials
- 7.1.1.4. SWOT Analysis
- 7.1.2 Aje Group
- 7.1.2.1. Company Overview
- 7.1.2.2. Products
- 7.1.2.3. Company Financials
- 7.1.2.4. SWOT Analysis
- 7.1.3 Tiger Brands Ltd
- 7.1.3.1. Company Overview
- 7.1.3.2. Products
- 7.1.3.3. Company Financials
- 7.1.3.4. SWOT Analysis
- 7.1.4 PepsiCo Inc
- 7.1.4.1. Company Overview
- 7.1.4.2. Products
- 7.1.4.3. Company Financials
- 7.1.4.4. SWOT Analysis
- 7.1.5 Oshee Polska Sp Z O O
- 7.1.5.1. Company Overview
- 7.1.5.2. Products
- 7.1.5.3. Company Financials
- 7.1.5.4. SWOT Analysis
- 7.1.6 Suntory Holdings Limited
- 7.1.6.1. Company Overview
- 7.1.6.2. Products
- 7.1.6.3. Company Financials
- 7.1.6.4. SWOT Analysis
- 7.1.7 The Coca-Cola Company
- 7.1.7.1. Company Overview
- 7.1.7.2. Products
- 7.1.7.3. Company Financials
- 7.1.7.4. SWOT Analysis
- 7.1.8 Thirsti Water (Pty) Ltd
- 7.1.8.1. Company Overview
- 7.1.8.2. Products
- 7.1.8.3. Company Financials
- 7.1.8.4. SWOT Analysis
- 7.1.9 Ekhamanzi Springs (Pty) Ltd
- 7.1.9.1. Company Overview
- 7.1.9.2. Products
- 7.1.9.3. Company Financials
- 7.1.9.4. SWOT Analysis
- 7.1.10 BOS Brands (Pty) Ltd
- 7.1.10.1. Company Overview
- 7.1.10.2. Products
- 7.1.10.3. Company Financials
- 7.1.10.4. SWOT Analysis
- 7.1.11 Congo Brands
- 7.1.11.1. Company Overview
- 7.1.11.2. Products
- 7.1.11.3. Company Financials
- 7.1.11.4. SWOT Analysis
- 7.1.1 Kingsley Beverages Limited
- 7.2. Market Entropy
- 7.2.1 Company's Key Areas Served
- 7.2.2 Recent Developments
- 7.3. Company Market Share Analysis 2025
- 7.3.1 Top 5 Companies Market Share Analysis
- 7.3.2 Top 3 Companies Market Share Analysis
- 7.4. List of Potential Customers
- 8. Research Methodology
List of Figures
- Figure 1: Africa Sports Drinks Industry Revenue Breakdown (billion, %) by Product 2025 & 2033
- Figure 2: Africa Sports Drinks Industry Share (%) by Company 2025
List of Tables
- Table 1: Africa Sports Drinks Industry Revenue billion Forecast, by Soft Drink Type 2020 & 2033
- Table 2: Africa Sports Drinks Industry Revenue billion Forecast, by Packaging Type 2020 & 2033
- Table 3: Africa Sports Drinks Industry Revenue billion Forecast, by Sub Distribution Channel 2020 & 2033
- Table 4: Africa Sports Drinks Industry Revenue billion Forecast, by Region 2020 & 2033
- Table 5: Africa Sports Drinks Industry Revenue billion Forecast, by Soft Drink Type 2020 & 2033
- Table 6: Africa Sports Drinks Industry Revenue billion Forecast, by Packaging Type 2020 & 2033
- Table 7: Africa Sports Drinks Industry Revenue billion Forecast, by Sub Distribution Channel 2020 & 2033
- Table 8: Africa Sports Drinks Industry Revenue billion Forecast, by Country 2020 & 2033
- Table 9: Nigeria Africa Sports Drinks Industry Revenue (billion) Forecast, by Application 2020 & 2033
- Table 10: South Africa Africa Sports Drinks Industry Revenue (billion) Forecast, by Application 2020 & 2033
- Table 11: Egypt Africa Sports Drinks Industry Revenue (billion) Forecast, by Application 2020 & 2033
- Table 12: Kenya Africa Sports Drinks Industry Revenue (billion) Forecast, by Application 2020 & 2033
- Table 13: Ethiopia Africa Sports Drinks Industry Revenue (billion) Forecast, by Application 2020 & 2033
- Table 14: Morocco Africa Sports Drinks Industry Revenue (billion) Forecast, by Application 2020 & 2033
- Table 15: Ghana Africa Sports Drinks Industry Revenue (billion) Forecast, by Application 2020 & 2033
- Table 16: Algeria Africa Sports Drinks Industry Revenue (billion) Forecast, by Application 2020 & 2033
- Table 17: Tanzania Africa Sports Drinks Industry Revenue (billion) Forecast, by Application 2020 & 2033
- Table 18: Ivory Coast Africa Sports Drinks Industry Revenue (billion) Forecast, by Application 2020 & 2033
Frequently Asked Questions
1. What is the projected Compound Annual Growth Rate (CAGR) of the Africa Sports Drinks Industry?
The projected CAGR is approximately 6.15%.
2. Which companies are prominent players in the Africa Sports Drinks Industry?
Key companies in the market include Kingsley Beverages Limited, Aje Group, Tiger Brands Ltd, PepsiCo Inc, Oshee Polska Sp Z O O, Suntory Holdings Limited, The Coca-Cola Company, Thirsti Water (Pty) Ltd, Ekhamanzi Springs (Pty) Ltd, BOS Brands (Pty) Ltd, Congo Brands.
3. What are the main segments of the Africa Sports Drinks Industry?
The market segments include Soft Drink Type, Packaging Type, Sub Distribution Channel.
4. Can you provide details about the market size?
The market size is estimated to be USD 28.11 billion as of 2022.
5. What are some drivers contributing to market growth?
Increasing Demand for Protein-Rich Food; Increasing Demand for Plant-Based and Organic Ingredients.
6. What are the notable trends driving market growth?
OTHER KEY INDUSTRY TRENDS COVERED IN THE REPORT.
7. Are there any restraints impacting market growth?
Presence of Counterfeit Products.
8. Can you provide examples of recent developments in the market?
April 2023: Congo LLC to relocate, and expand Louisville headquarters with USD 8.25 million investment, creating 500 high-wage jobs. The company will relocate its Louisville headquarters to an existing 110,000-square-foot location at 13551 Triton Park Blvd., moving from its current 18,000-square-foot facility.October 2022: Tiger Brands also started producing a “zero” Energade variant, which is free from added sugar and contains very few calories. The product is available in the two classic flavors Lemon and Orange, in the practical 0.5L PET format.May 2022: To advertise its sports drinks, Thirsti Water (Pty) Ltd has expanded into football by signing a three-year hydration deal with SuperSport United.
9. What pricing options are available for accessing the report?
Pricing options include single-user, multi-user, and enterprise licenses priced at USD 3800, USD 4500, and USD 5800 respectively.
10. Is the market size provided in terms of value or volume?
The market size is provided in terms of value, measured in billion.
11. Are there any specific market keywords associated with the report?
Yes, the market keyword associated with the report is "Africa Sports Drinks Industry," which aids in identifying and referencing the specific market segment covered.
12. How do I determine which pricing option suits my needs best?
The pricing options vary based on user requirements and access needs. Individual users may opt for single-user licenses, while businesses requiring broader access may choose multi-user or enterprise licenses for cost-effective access to the report.
13. Are there any additional resources or data provided in the Africa Sports Drinks Industry report?
While the report offers comprehensive insights, it's advisable to review the specific contents or supplementary materials provided to ascertain if additional resources or data are available.
14. How can I stay updated on further developments or reports in the Africa Sports Drinks Industry?
To stay informed about further developments, trends, and reports in the Africa Sports Drinks Industry, consider subscribing to industry newsletters, following relevant companies and organizations, or regularly checking reputable industry news sources and publications.
Methodology
Step 1 - Identification of Relevant Samples Size from Population Database


Step 2 - Approaches for Defining Global Market Size (Value, Volume* & Price*)

Note*: In applicable scenarios
Step 3 - Data Sources
Primary Research
- Web Analytics
- Survey Reports
- Research Institute
- Latest Research Reports
- Opinion Leaders
Secondary Research
- Annual Reports
- White Paper
- Latest Press Release
- Industry Association
- Paid Database
- Investor Presentations

Step 4 - Data Triangulation
Involves using different sources of information in order to increase the validity of a study
These sources are likely to be stakeholders in a program - participants, other researchers, program staff, other community members, and so on.
Then we put all data in single framework & apply various statistical tools to find out the dynamic on the market.
During the analysis stage, feedback from the stakeholder groups would be compared to determine areas of agreement as well as areas of divergence