


Key Insights
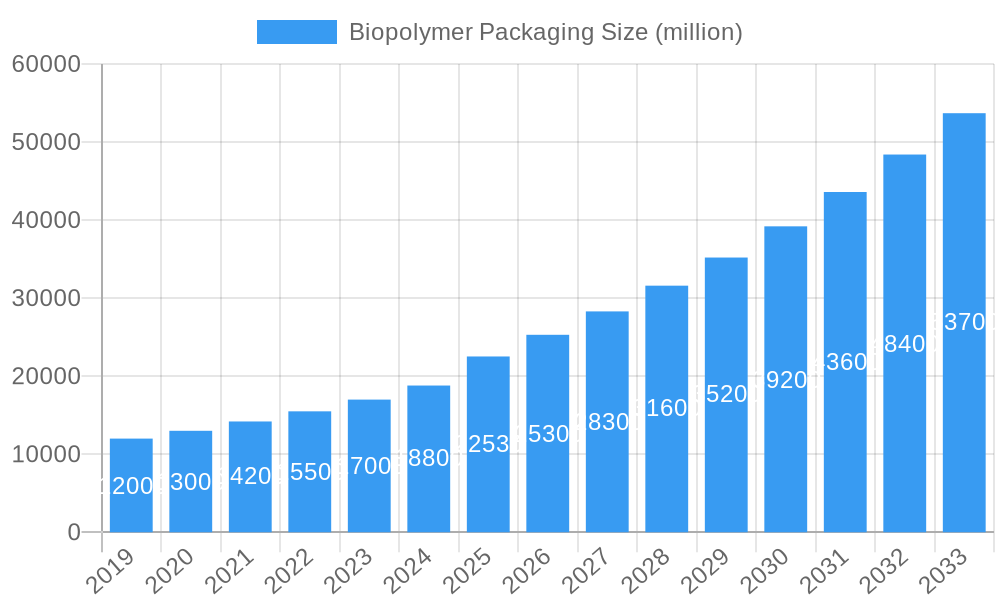
The global biopolymer packaging market is poised for substantial expansion, projected to reach an estimated USD 22530 million by 2025, driven by a robust Compound Annual Growth Rate (CAGR) of 12.5% throughout the forecast period of 2025-2033. This significant growth is underpinned by a growing consumer demand for sustainable and eco-friendly alternatives to conventional petroleum-based plastics. Increasing environmental consciousness, coupled with stringent government regulations worldwide aimed at reducing plastic waste and promoting biodegradable materials, are acting as potent catalysts for the adoption of biopolymer packaging solutions. Key market drivers include the development of advanced biopolymer formulations with enhanced performance characteristics, such as improved barrier properties and increased durability, making them viable substitutes across a wide array of packaging applications. Furthermore, a burgeoning awareness among brand owners regarding the positive impact of sustainable packaging on brand image and consumer loyalty is further fueling market penetration.
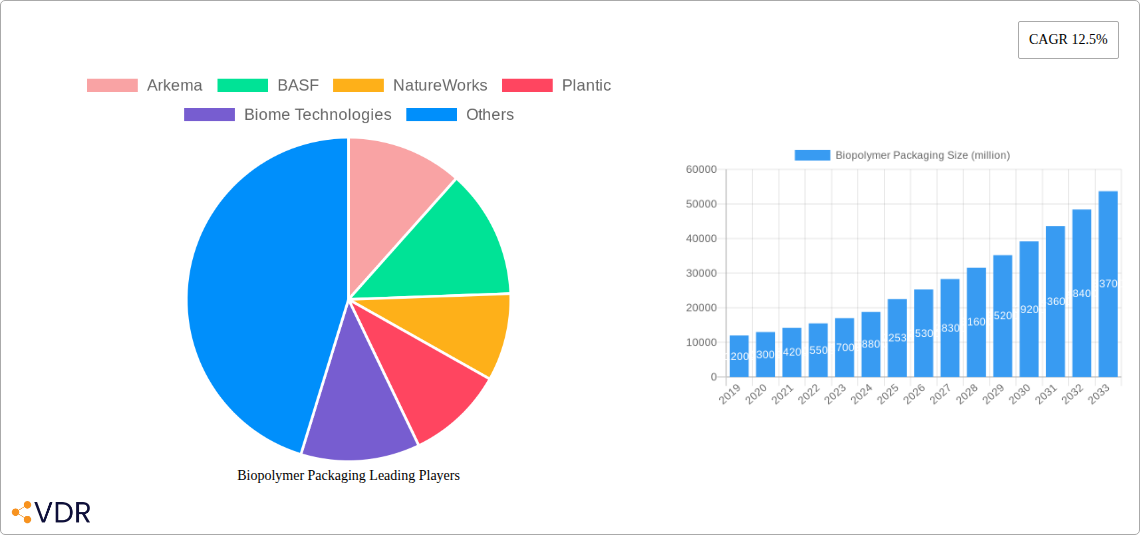
Biopolymer Packaging Market Size (In Billion)

The market segmentation reveals a dynamic landscape. In terms of applications, Cartons, Bags & Pouches, and Bottles & Cans are expected to dominate, reflecting their widespread use in food & beverage, healthcare, and consumer goods industries. Within the type segment, Polylactides (PLA), Bio-Polyethylene (PE), and Bio-Polyethylene Terephthalate (PET) are anticipated to witness the highest adoption rates due to their versatility, biodegradability, and compostability. Emerging trends include the innovation in bio-based composites and the development of novel biopolymer blends for specialized packaging needs. While the market exhibits strong growth potential, certain restraints, such as the higher initial cost of biopolymer production compared to conventional plastics and ongoing challenges in establishing robust collection and composting infrastructure in some regions, require strategic attention and industry-wide collaborative efforts to overcome. North America and Europe are expected to lead market adoption, driven by supportive policies and high consumer awareness, with the Asia Pacific region exhibiting the fastest growth trajectory owing to increasing industrialization and a rising middle class.
Biopolymer Packaging Company Market Share
Biopolymer Packaging Market Dynamics & Structure
The biopolymer packaging market is characterized by a dynamic interplay of innovation, evolving regulations, and increasing consumer demand for sustainable solutions. Market concentration is moderately fragmented, with a few large players like BASF, NatureWorks, and Toray Industries holding significant shares, alongside a growing number of agile startups and specialized manufacturers such as Plantic, Biome Technologies, and Spectra Packaging. Technological innovation is primarily driven by advancements in polymer science, leading to improved biodegradability, barrier properties, and cost-effectiveness. Regulatory frameworks, including bans on single-use plastics and incentives for bio-based materials, are increasingly shaping market entry and product development. Competitive product substitutes, including conventional plastics and other bioplastics like PLA and bio-PE, present ongoing challenges. End-user demographics are shifting, with a strong preference for sustainable packaging emerging across food & beverage, personal care, and pharmaceutical sectors. Mergers and acquisitions are active, with strategic alliances and acquisitions aimed at expanding product portfolios and geographical reach, though specific deal volumes are proprietary. Barriers to innovation include high production costs for certain biopolymers and the need for robust end-of-life infrastructure for composting or recycling.
- Market Concentration: Moderately fragmented with key players and emerging innovators.
- Technological Drivers: Advancements in polymer science, biodegradability, and barrier properties.
- Regulatory Frameworks: Growing support for bio-based materials, bans on single-use plastics.
- Competitive Substitutes: Conventional plastics, PLA, Bio-PE, and other biopolymer types.
- End-User Demographics: Increasing demand for sustainable packaging across various industries.
- M&A Trends: Active, focused on portfolio expansion and geographical reach.
- Innovation Barriers: Production costs, end-of-life infrastructure limitations.
Biopolymer Packaging Growth Trends & Insights
The global biopolymer packaging market is experiencing robust growth, driven by a confluence of environmental consciousness, governmental mandates, and technological advancements. The market size is projected to expand significantly, with a Compound Annual Growth Rate (CAGR) of approximately 10-12% over the forecast period. This expansion is fueled by a growing adoption rate across diverse applications, from flexible food packaging to rigid containers. Technological disruptions are continuously enhancing the performance characteristics of biopolymers, making them viable alternatives to traditional petroleum-based plastics. Innovations in material science are leading to improved mechanical strength, thermal stability, and moisture resistance, thereby broadening their applicability. Consumer behavior shifts are playing a pivotal role, with a marked preference for eco-friendly products and packaging. This demand is compelling brands to integrate biopolymer solutions to meet sustainability targets and appeal to environmentally conscious consumers. The market penetration of biopolymer packaging is steadily increasing, especially in developed economies where regulatory pressures and consumer awareness are high. The development of new bio-based feedstocks and advanced processing techniques is further accelerating this trend, making biopolymers more cost-competitive and accessible. The focus on circular economy principles is also driving innovation, with an emphasis on designing biopolymers that are either compostable or easily recyclable. This holistic approach to material lifecycle management is a key growth accelerator. The study will provide detailed market size evolution from 2019 to 2033, with a base year of 2025 and an estimated year of 2025, alongside a detailed forecast for 2025–2033 and historical data for 2019–2024.
Dominant Regions, Countries, or Segments in Biopolymer Packaging
North America is a leading region in the biopolymer packaging market, driven by strong consumer demand for sustainable products and supportive government policies. The United States, in particular, exhibits significant market dominance due to a robust industrial base, advanced research and development capabilities, and a heightened awareness of environmental issues among its population. The application segment of Bags & Pouches is experiencing remarkable growth, fueled by the food and beverage industry's shift towards more sustainable flexible packaging solutions. This trend is further amplified by the increasing popularity of e-commerce, which relies heavily on efficient and environmentally responsible packaging.
- Leading Region: North America, with the United States as a key country.
- Dominant Application: Bags & Pouches, due to the food & beverage and e-commerce sectors.
- Key Drivers in North America:
- Economic Policies: Incentives for bio-based materials and plastics reduction initiatives.
- Consumer Awareness: High demand for eco-friendly packaging solutions.
- Infrastructure: Growing availability of industrial composting facilities.
- Corporate Sustainability Goals: Major brands are setting ambitious targets for reducing plastic waste.
- Growth Potential in Bags & Pouches: Continued innovation in barrier properties and printability for food safety and brand appeal. The segment is expected to capture a substantial market share, estimated at over 35% of the total application market by 2033.
In terms of Type, Polylactides (PLA) are a significant driver of market growth. PLA's versatility, biodegradability, and relatively established production infrastructure make it a preferred choice for various packaging applications. The increasing availability of PLA derived from renewable resources like corn starch and sugarcane further bolsters its market position. The market share for PLA is projected to be around 40-45% of the total biopolymer type market by 2033, reflecting its widespread adoption and ongoing material improvements.
- Dominant Type: Polylactides (PLA) due to its versatility and biodegradability.
- Key Drivers for PLA:
- Renewable Feedstocks: Availability from corn, sugarcane, and other agricultural products.
- Material Performance: Continuous improvements in strength, clarity, and heat resistance.
- Scalability: Established production processes allow for large-scale manufacturing.
- Regulatory Support: Favorable policies promoting bio-based and biodegradable materials.
- Market Share of PLA: Expected to remain dominant, projected at 40-45% of the biopolymer type market.
The parent market for biopolymer packaging encompasses the broader packaging industry, valued at over $1 trillion globally, with bioplastics constituting a rapidly growing, albeit currently smaller, segment. The child markets include specific end-use industries such as food & beverage packaging (valued at approximately $400 billion), pharmaceuticals, and personal care, where the demand for sustainable and safe packaging is paramount. The growth within these child markets directly influences the adoption of biopolymer packaging.
Biopolymer Packaging Product Landscape
The biopolymer packaging product landscape is characterized by a surge in innovative materials and applications designed to meet stringent sustainability demands. Polylactide (PLA) films offer excellent clarity and printability, making them ideal for food wraps and clear containers. Bio-Polyethylene Terephthalate (PET) provides enhanced barrier properties, suitable for beverage bottles and cosmetic packaging. Starch-based materials are emerging in applications like biodegradable cutlery and foodservice ware, offering cost-effectiveness. Companies are continuously developing novel biopolymer blends and composites to enhance performance metrics such as tensile strength, elongation, and impact resistance, thereby competing directly with conventional plastics. Unique selling propositions often revolve around compostability, reduced carbon footprint, and non-toxicity.
Key Drivers, Barriers & Challenges in Biopolymer Packaging
Key Drivers: The biopolymer packaging market is propelled by a strong confluence of environmental consciousness among consumers and stringent government regulations aimed at reducing plastic waste. Technological advancements in material science are continuously improving the performance and cost-effectiveness of biopolymers, making them increasingly competitive. Corporate sustainability initiatives and a growing demand for eco-friendly branding are also significant growth accelerators. For instance, the widespread adoption of PLA for food packaging is a direct result of its compostability and renewable origin.
Key Barriers & Challenges: Despite its growth, the biopolymer packaging sector faces several hurdles. High production costs compared to traditional plastics remain a significant barrier, particularly for large-scale applications. Supply chain complexities, including the availability of consistent feedstock and the development of widespread industrial composting infrastructure, pose challenges. Furthermore, consumer confusion regarding the biodegradability and disposal of bioplastics can hinder adoption. For example, the lack of standardized composting facilities in many regions can lead to bioplastics ending up in landfills, negating their environmental benefits. The competitive pressure from established, low-cost conventional plastics also presents a continuous challenge, with an estimated impact on market penetration of 15-20% in price-sensitive segments.
Emerging Opportunities in Biopolymer Packaging
Emerging opportunities in biopolymer packaging lie in the development of high-performance bioplastics with advanced functionalities, such as improved barrier properties for extended shelf-life food packaging and heat-resistant materials for hot-fill applications. The untapped potential in flexible packaging for niche markets like medical devices and sensitive electronics, requiring specialized barrier and sterilization capabilities, is significant. Furthermore, the growing consumer preference for aesthetically pleasing and tactile packaging presents an opportunity for biopolymers with unique textures and natural finishes. Innovations in active and intelligent biopolymer packaging, incorporating features that monitor food freshness or provide antimicrobial properties, are also gaining traction. The development of novel bio-based composites and blends tailored for specific industrial applications, such as automotive components or durable consumer goods, represents another frontier.
Growth Accelerators in the Biopolymer Packaging Industry
Technological breakthroughs in polymerization techniques and feedstock diversification are key growth accelerators for the biopolymer packaging industry. The development of cost-effective processes for producing biopolymers from waste streams, such as agricultural residues and municipal solid waste, is revolutionizing the industry by reducing reliance on food crops and enhancing sustainability. Strategic partnerships between biopolymer manufacturers and major brand owners are critical, fostering co-development of customized solutions and ensuring market adoption. For instance, collaborations between companies like NatureWorks and large food corporations for PLA packaging have significantly boosted market penetration. Furthermore, global expansion strategies, particularly in emerging economies with rapidly growing middle classes and increasing environmental awareness, are poised to drive substantial long-term growth. Investments in advanced recycling and composting infrastructure will also accelerate the circularity of biopolymer packaging, further enhancing its appeal.
Key Players Shaping the Biopolymer Packaging Market
- Arkema
- BASF
- NatureWorks
- Plantic
- Biome Technologies
- Plantic Technologies
- Bio-On
- Toray Industries
- Spectra Packaging
- United Biopolymers
Notable Milestones in Biopolymer Packaging Sector
- 2019: BASF announces expansion of its biopolymer portfolio with new grades of ecovio®, a certified compostable polymer.
- 2020: NatureWorks launches Ingeo 3D, a new biopolymer designed for advanced 3D printing applications, expanding its market reach.
- 2021: Plantic Technologies secures funding for scaling up production of its starch-based barrier materials for food packaging.
- 2022: Biome Technologies focuses on developing bio-based adhesives and coatings for sustainable packaging solutions.
- 2023 (Q1): Spectra Packaging introduces a range of fully recyclable bio-based plastic bottles for the personal care industry.
- 2023 (Q3): Toray Industries develops a novel bio-PET with improved mechanical properties for beverage bottles.
- 2024 (Expected): Bio-On announces a breakthrough in PHB (polyhydroxyalkanoates) production, aiming for cost parity with conventional plastics.
- 2024 (Ongoing): United Biopolymers expands its production capacity for bio-polyethylene to meet rising demand in Europe.
In-Depth Biopolymer Packaging Market Outlook
The future outlook for the biopolymer packaging market is exceptionally bright, characterized by continuous innovation and expanding applications. Key growth accelerators include advancements in material science leading to enhanced performance characteristics and cost reductions, making bioplastics increasingly competitive with conventional counterparts. The growing global imperative to reduce plastic waste and carbon footprints will continue to drive legislative support and consumer preference for sustainable packaging solutions. Strategic partnerships between raw material suppliers, biopolymer manufacturers, and end-product brand owners will foster market penetration and drive economies of scale. The development of robust end-of-life infrastructure, including industrial composting facilities and advanced recycling technologies, will further solidify the long-term viability and appeal of biopolymer packaging. Emerging applications in niche sectors and the ongoing integration of circular economy principles will present significant strategic opportunities for market expansion.
Biopolymer Packaging Segmentation
-
1. Application
- 1.1. Cartons
- 1.2. Bags & Pouches
- 1.3. Bottles & Cans
- 1.4. Ampoules and Vials
- 1.5. Others
-
2. Type
- 2.1. Polylactides (PLA)
- 2.2. Bio-Polyethylene (PE)
- 2.3. Bio-PolyethyleneTerephthalate(PET)
- 2.4. Starch
- 2.5. Cellulose
- 2.6. Others
Biopolymer Packaging Segmentation By Geography
-
1. North America
- 1.1. United States
- 1.2. Canada
- 1.3. Mexico
-
2. South America
- 2.1. Brazil
- 2.2. Argentina
- 2.3. Rest of South America
-
3. Europe
- 3.1. United Kingdom
- 3.2. Germany
- 3.3. France
- 3.4. Italy
- 3.5. Spain
- 3.6. Russia
- 3.7. Benelux
- 3.8. Nordics
- 3.9. Rest of Europe
-
4. Middle East & Africa
- 4.1. Turkey
- 4.2. Israel
- 4.3. GCC
- 4.4. North Africa
- 4.5. South Africa
- 4.6. Rest of Middle East & Africa
-
5. Asia Pacific
- 5.1. China
- 5.2. India
- 5.3. Japan
- 5.4. South Korea
- 5.5. ASEAN
- 5.6. Oceania
- 5.7. Rest of Asia Pacific
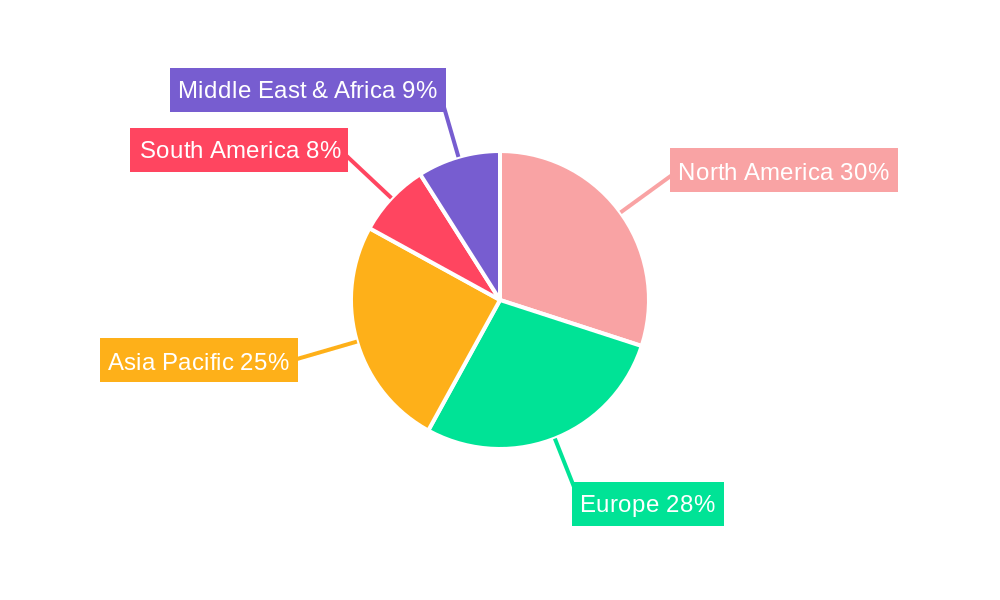
Biopolymer Packaging Regional Market Share
Geographic Coverage of Biopolymer Packaging
Biopolymer Packaging REPORT HIGHLIGHTS
| Aspects | Details |
|---|---|
| Study Period | 2020-2034 |
| Base Year | 2025 |
| Estimated Year | 2026 |
| Forecast Period | 2026-2034 |
| Historical Period | 2020-2025 |
| Growth Rate | CAGR of 17.2% from 2020-2034 |
| Segmentation |
|
Table of Contents
- 1. Introduction
- 1.1. Research Scope
- 1.2. Market Segmentation
- 1.3. Research Objective
- 1.4. Definitions and Assumptions
- 2. Executive Summary
- 2.1. Market Snapshot
- 3. Market Dynamics
- 3.1. Market Drivers
- 3.2. Market Restrains
- 3.3. Market Trends
- 3.4. Market Opportunities
- 4. Market Factor Analysis
- 4.1. Porters Five Forces
- 4.1.1. Bargaining Power of Suppliers
- 4.1.2. Bargaining Power of Buyers
- 4.1.3. Threat of New Entrants
- 4.1.4. Threat of Substitutes
- 4.1.5. Competitive Rivalry
- 4.2. PESTEL analysis
- 4.3. BCG Analysis
- 4.3.1. Stars (High Growth, High Market Share)
- 4.3.2. Cash Cows (Low Growth, High Market Share)
- 4.3.3. Question Mark (High Growth, Low Market Share)
- 4.3.4. Dogs (Low Growth, Low Market Share)
- 4.4. Ansoff Matrix Analysis
- 4.5. Supply Chain Analysis
- 4.6. Regulatory Landscape
- 4.7. Current Market Potential and Opportunity Assessment (TAM–SAM–SOM Framework)
- 4.8. VDR Analyst Note
- 4.1. Porters Five Forces
- 5. Market Analysis, Insights and Forecast 2021-2033
- 5.1. Market Analysis, Insights and Forecast - by Application
- 5.1.1. Cartons
- 5.1.2. Bags & Pouches
- 5.1.3. Bottles & Cans
- 5.1.4. Ampoules and Vials
- 5.1.5. Others
- 5.2. Market Analysis, Insights and Forecast - by Type
- 5.2.1. Polylactides (PLA)
- 5.2.2. Bio-Polyethylene (PE)
- 5.2.3. Bio-PolyethyleneTerephthalate(PET)
- 5.2.4. Starch
- 5.2.5. Cellulose
- 5.2.6. Others
- 5.3. Market Analysis, Insights and Forecast - by Region
- 5.3.1. North America
- 5.3.2. South America
- 5.3.3. Europe
- 5.3.4. Middle East & Africa
- 5.3.5. Asia Pacific
- 5.1. Market Analysis, Insights and Forecast - by Application
- 6. Global Biopolymer Packaging Analysis, Insights and Forecast, 2021-2033
- 6.1. Market Analysis, Insights and Forecast - by Application
- 6.1.1. Cartons
- 6.1.2. Bags & Pouches
- 6.1.3. Bottles & Cans
- 6.1.4. Ampoules and Vials
- 6.1.5. Others
- 6.2. Market Analysis, Insights and Forecast - by Type
- 6.2.1. Polylactides (PLA)
- 6.2.2. Bio-Polyethylene (PE)
- 6.2.3. Bio-PolyethyleneTerephthalate(PET)
- 6.2.4. Starch
- 6.2.5. Cellulose
- 6.2.6. Others
- 6.1. Market Analysis, Insights and Forecast - by Application
- 7. North America Biopolymer Packaging Analysis, Insights and Forecast, 2021-2033
- 7.1. Market Analysis, Insights and Forecast - by Application
- 7.1.1. Cartons
- 7.1.2. Bags & Pouches
- 7.1.3. Bottles & Cans
- 7.1.4. Ampoules and Vials
- 7.1.5. Others
- 7.2. Market Analysis, Insights and Forecast - by Type
- 7.2.1. Polylactides (PLA)
- 7.2.2. Bio-Polyethylene (PE)
- 7.2.3. Bio-PolyethyleneTerephthalate(PET)
- 7.2.4. Starch
- 7.2.5. Cellulose
- 7.2.6. Others
- 7.1. Market Analysis, Insights and Forecast - by Application
- 8. South America Biopolymer Packaging Analysis, Insights and Forecast, 2021-2033
- 8.1. Market Analysis, Insights and Forecast - by Application
- 8.1.1. Cartons
- 8.1.2. Bags & Pouches
- 8.1.3. Bottles & Cans
- 8.1.4. Ampoules and Vials
- 8.1.5. Others
- 8.2. Market Analysis, Insights and Forecast - by Type
- 8.2.1. Polylactides (PLA)
- 8.2.2. Bio-Polyethylene (PE)
- 8.2.3. Bio-PolyethyleneTerephthalate(PET)
- 8.2.4. Starch
- 8.2.5. Cellulose
- 8.2.6. Others
- 8.1. Market Analysis, Insights and Forecast - by Application
- 9. Europe Biopolymer Packaging Analysis, Insights and Forecast, 2021-2033
- 9.1. Market Analysis, Insights and Forecast - by Application
- 9.1.1. Cartons
- 9.1.2. Bags & Pouches
- 9.1.3. Bottles & Cans
- 9.1.4. Ampoules and Vials
- 9.1.5. Others
- 9.2. Market Analysis, Insights and Forecast - by Type
- 9.2.1. Polylactides (PLA)
- 9.2.2. Bio-Polyethylene (PE)
- 9.2.3. Bio-PolyethyleneTerephthalate(PET)
- 9.2.4. Starch
- 9.2.5. Cellulose
- 9.2.6. Others
- 9.1. Market Analysis, Insights and Forecast - by Application
- 10. Middle East & Africa Biopolymer Packaging Analysis, Insights and Forecast, 2021-2033
- 10.1. Market Analysis, Insights and Forecast - by Application
- 10.1.1. Cartons
- 10.1.2. Bags & Pouches
- 10.1.3. Bottles & Cans
- 10.1.4. Ampoules and Vials
- 10.1.5. Others
- 10.2. Market Analysis, Insights and Forecast - by Type
- 10.2.1. Polylactides (PLA)
- 10.2.2. Bio-Polyethylene (PE)
- 10.2.3. Bio-PolyethyleneTerephthalate(PET)
- 10.2.4. Starch
- 10.2.5. Cellulose
- 10.2.6. Others
- 10.1. Market Analysis, Insights and Forecast - by Application
- 11. Asia Pacific Biopolymer Packaging Analysis, Insights and Forecast, 2021-2033
- 11.1. Market Analysis, Insights and Forecast - by Application
- 11.1.1. Cartons
- 11.1.2. Bags & Pouches
- 11.1.3. Bottles & Cans
- 11.1.4. Ampoules and Vials
- 11.1.5. Others
- 11.2. Market Analysis, Insights and Forecast - by Type
- 11.2.1. Polylactides (PLA)
- 11.2.2. Bio-Polyethylene (PE)
- 11.2.3. Bio-PolyethyleneTerephthalate(PET)
- 11.2.4. Starch
- 11.2.5. Cellulose
- 11.2.6. Others
- 11.1. Market Analysis, Insights and Forecast - by Application
- 12. Competitive Analysis
- 12.1. Company Profiles
- 12.1.1 Arkema
- 12.1.1.1. Company Overview
- 12.1.1.2. Products
- 12.1.1.3. Company Financials
- 12.1.1.4. SWOT Analysis
- 12.1.2 BASF
- 12.1.2.1. Company Overview
- 12.1.2.2. Products
- 12.1.2.3. Company Financials
- 12.1.2.4. SWOT Analysis
- 12.1.3 NatureWorks
- 12.1.3.1. Company Overview
- 12.1.3.2. Products
- 12.1.3.3. Company Financials
- 12.1.3.4. SWOT Analysis
- 12.1.4 Plantic
- 12.1.4.1. Company Overview
- 12.1.4.2. Products
- 12.1.4.3. Company Financials
- 12.1.4.4. SWOT Analysis
- 12.1.5 Biome Technologies
- 12.1.5.1. Company Overview
- 12.1.5.2. Products
- 12.1.5.3. Company Financials
- 12.1.5.4. SWOT Analysis
- 12.1.6 Plantic Technologies
- 12.1.6.1. Company Overview
- 12.1.6.2. Products
- 12.1.6.3. Company Financials
- 12.1.6.4. SWOT Analysis
- 12.1.7 Bio-On
- 12.1.7.1. Company Overview
- 12.1.7.2. Products
- 12.1.7.3. Company Financials
- 12.1.7.4. SWOT Analysis
- 12.1.8 Toray Industries
- 12.1.8.1. Company Overview
- 12.1.8.2. Products
- 12.1.8.3. Company Financials
- 12.1.8.4. SWOT Analysis
- 12.1.9 Spectra Packaging
- 12.1.9.1. Company Overview
- 12.1.9.2. Products
- 12.1.9.3. Company Financials
- 12.1.9.4. SWOT Analysis
- 12.1.10 United Biopolymers
- 12.1.10.1. Company Overview
- 12.1.10.2. Products
- 12.1.10.3. Company Financials
- 12.1.10.4. SWOT Analysis
- 12.1.1 Arkema
- 12.2. Market Entropy
- 12.2.1 Company's Key Areas Served
- 12.2.2 Recent Developments
- 12.3. Company Market Share Analysis 2025
- 12.3.1 Top 5 Companies Market Share Analysis
- 12.3.2 Top 3 Companies Market Share Analysis
- 12.4. List of Potential Customers
- 13. Research Methodology
List of Figures
- Figure 1: Global Biopolymer Packaging Revenue Breakdown (billion, %) by Region 2025 & 2033
- Figure 2: Global Biopolymer Packaging Volume Breakdown (K, %) by Region 2025 & 2033
- Figure 3: North America Biopolymer Packaging Revenue (billion), by Application 2025 & 2033
- Figure 4: North America Biopolymer Packaging Volume (K), by Application 2025 & 2033
- Figure 5: North America Biopolymer Packaging Revenue Share (%), by Application 2025 & 2033
- Figure 6: North America Biopolymer Packaging Volume Share (%), by Application 2025 & 2033
- Figure 7: North America Biopolymer Packaging Revenue (billion), by Type 2025 & 2033
- Figure 8: North America Biopolymer Packaging Volume (K), by Type 2025 & 2033
- Figure 9: North America Biopolymer Packaging Revenue Share (%), by Type 2025 & 2033
- Figure 10: North America Biopolymer Packaging Volume Share (%), by Type 2025 & 2033
- Figure 11: North America Biopolymer Packaging Revenue (billion), by Country 2025 & 2033
- Figure 12: North America Biopolymer Packaging Volume (K), by Country 2025 & 2033
- Figure 13: North America Biopolymer Packaging Revenue Share (%), by Country 2025 & 2033
- Figure 14: North America Biopolymer Packaging Volume Share (%), by Country 2025 & 2033
- Figure 15: South America Biopolymer Packaging Revenue (billion), by Application 2025 & 2033
- Figure 16: South America Biopolymer Packaging Volume (K), by Application 2025 & 2033
- Figure 17: South America Biopolymer Packaging Revenue Share (%), by Application 2025 & 2033
- Figure 18: South America Biopolymer Packaging Volume Share (%), by Application 2025 & 2033
- Figure 19: South America Biopolymer Packaging Revenue (billion), by Type 2025 & 2033
- Figure 20: South America Biopolymer Packaging Volume (K), by Type 2025 & 2033
- Figure 21: South America Biopolymer Packaging Revenue Share (%), by Type 2025 & 2033
- Figure 22: South America Biopolymer Packaging Volume Share (%), by Type 2025 & 2033
- Figure 23: South America Biopolymer Packaging Revenue (billion), by Country 2025 & 2033
- Figure 24: South America Biopolymer Packaging Volume (K), by Country 2025 & 2033
- Figure 25: South America Biopolymer Packaging Revenue Share (%), by Country 2025 & 2033
- Figure 26: South America Biopolymer Packaging Volume Share (%), by Country 2025 & 2033
- Figure 27: Europe Biopolymer Packaging Revenue (billion), by Application 2025 & 2033
- Figure 28: Europe Biopolymer Packaging Volume (K), by Application 2025 & 2033
- Figure 29: Europe Biopolymer Packaging Revenue Share (%), by Application 2025 & 2033
- Figure 30: Europe Biopolymer Packaging Volume Share (%), by Application 2025 & 2033
- Figure 31: Europe Biopolymer Packaging Revenue (billion), by Type 2025 & 2033
- Figure 32: Europe Biopolymer Packaging Volume (K), by Type 2025 & 2033
- Figure 33: Europe Biopolymer Packaging Revenue Share (%), by Type 2025 & 2033
- Figure 34: Europe Biopolymer Packaging Volume Share (%), by Type 2025 & 2033
- Figure 35: Europe Biopolymer Packaging Revenue (billion), by Country 2025 & 2033
- Figure 36: Europe Biopolymer Packaging Volume (K), by Country 2025 & 2033
- Figure 37: Europe Biopolymer Packaging Revenue Share (%), by Country 2025 & 2033
- Figure 38: Europe Biopolymer Packaging Volume Share (%), by Country 2025 & 2033
- Figure 39: Middle East & Africa Biopolymer Packaging Revenue (billion), by Application 2025 & 2033
- Figure 40: Middle East & Africa Biopolymer Packaging Volume (K), by Application 2025 & 2033
- Figure 41: Middle East & Africa Biopolymer Packaging Revenue Share (%), by Application 2025 & 2033
- Figure 42: Middle East & Africa Biopolymer Packaging Volume Share (%), by Application 2025 & 2033
- Figure 43: Middle East & Africa Biopolymer Packaging Revenue (billion), by Type 2025 & 2033
- Figure 44: Middle East & Africa Biopolymer Packaging Volume (K), by Type 2025 & 2033
- Figure 45: Middle East & Africa Biopolymer Packaging Revenue Share (%), by Type 2025 & 2033
- Figure 46: Middle East & Africa Biopolymer Packaging Volume Share (%), by Type 2025 & 2033
- Figure 47: Middle East & Africa Biopolymer Packaging Revenue (billion), by Country 2025 & 2033
- Figure 48: Middle East & Africa Biopolymer Packaging Volume (K), by Country 2025 & 2033
- Figure 49: Middle East & Africa Biopolymer Packaging Revenue Share (%), by Country 2025 & 2033
- Figure 50: Middle East & Africa Biopolymer Packaging Volume Share (%), by Country 2025 & 2033
- Figure 51: Asia Pacific Biopolymer Packaging Revenue (billion), by Application 2025 & 2033
- Figure 52: Asia Pacific Biopolymer Packaging Volume (K), by Application 2025 & 2033
- Figure 53: Asia Pacific Biopolymer Packaging Revenue Share (%), by Application 2025 & 2033
- Figure 54: Asia Pacific Biopolymer Packaging Volume Share (%), by Application 2025 & 2033
- Figure 55: Asia Pacific Biopolymer Packaging Revenue (billion), by Type 2025 & 2033
- Figure 56: Asia Pacific Biopolymer Packaging Volume (K), by Type 2025 & 2033
- Figure 57: Asia Pacific Biopolymer Packaging Revenue Share (%), by Type 2025 & 2033
- Figure 58: Asia Pacific Biopolymer Packaging Volume Share (%), by Type 2025 & 2033
- Figure 59: Asia Pacific Biopolymer Packaging Revenue (billion), by Country 2025 & 2033
- Figure 60: Asia Pacific Biopolymer Packaging Volume (K), by Country 2025 & 2033
- Figure 61: Asia Pacific Biopolymer Packaging Revenue Share (%), by Country 2025 & 2033
- Figure 62: Asia Pacific Biopolymer Packaging Volume Share (%), by Country 2025 & 2033
List of Tables
- Table 1: Global Biopolymer Packaging Revenue billion Forecast, by Application 2020 & 2033
- Table 2: Global Biopolymer Packaging Volume K Forecast, by Application 2020 & 2033
- Table 3: Global Biopolymer Packaging Revenue billion Forecast, by Type 2020 & 2033
- Table 4: Global Biopolymer Packaging Volume K Forecast, by Type 2020 & 2033
- Table 5: Global Biopolymer Packaging Revenue billion Forecast, by Region 2020 & 2033
- Table 6: Global Biopolymer Packaging Volume K Forecast, by Region 2020 & 2033
- Table 7: Global Biopolymer Packaging Revenue billion Forecast, by Application 2020 & 2033
- Table 8: Global Biopolymer Packaging Volume K Forecast, by Application 2020 & 2033
- Table 9: Global Biopolymer Packaging Revenue billion Forecast, by Type 2020 & 2033
- Table 10: Global Biopolymer Packaging Volume K Forecast, by Type 2020 & 2033
- Table 11: Global Biopolymer Packaging Revenue billion Forecast, by Country 2020 & 2033
- Table 12: Global Biopolymer Packaging Volume K Forecast, by Country 2020 & 2033
- Table 13: United States Biopolymer Packaging Revenue (billion) Forecast, by Application 2020 & 2033
- Table 14: United States Biopolymer Packaging Volume (K) Forecast, by Application 2020 & 2033
- Table 15: Canada Biopolymer Packaging Revenue (billion) Forecast, by Application 2020 & 2033
- Table 16: Canada Biopolymer Packaging Volume (K) Forecast, by Application 2020 & 2033
- Table 17: Mexico Biopolymer Packaging Revenue (billion) Forecast, by Application 2020 & 2033
- Table 18: Mexico Biopolymer Packaging Volume (K) Forecast, by Application 2020 & 2033
- Table 19: Global Biopolymer Packaging Revenue billion Forecast, by Application 2020 & 2033
- Table 20: Global Biopolymer Packaging Volume K Forecast, by Application 2020 & 2033
- Table 21: Global Biopolymer Packaging Revenue billion Forecast, by Type 2020 & 2033
- Table 22: Global Biopolymer Packaging Volume K Forecast, by Type 2020 & 2033
- Table 23: Global Biopolymer Packaging Revenue billion Forecast, by Country 2020 & 2033
- Table 24: Global Biopolymer Packaging Volume K Forecast, by Country 2020 & 2033
- Table 25: Brazil Biopolymer Packaging Revenue (billion) Forecast, by Application 2020 & 2033
- Table 26: Brazil Biopolymer Packaging Volume (K) Forecast, by Application 2020 & 2033
- Table 27: Argentina Biopolymer Packaging Revenue (billion) Forecast, by Application 2020 & 2033
- Table 28: Argentina Biopolymer Packaging Volume (K) Forecast, by Application 2020 & 2033
- Table 29: Rest of South America Biopolymer Packaging Revenue (billion) Forecast, by Application 2020 & 2033
- Table 30: Rest of South America Biopolymer Packaging Volume (K) Forecast, by Application 2020 & 2033
- Table 31: Global Biopolymer Packaging Revenue billion Forecast, by Application 2020 & 2033
- Table 32: Global Biopolymer Packaging Volume K Forecast, by Application 2020 & 2033
- Table 33: Global Biopolymer Packaging Revenue billion Forecast, by Type 2020 & 2033
- Table 34: Global Biopolymer Packaging Volume K Forecast, by Type 2020 & 2033
- Table 35: Global Biopolymer Packaging Revenue billion Forecast, by Country 2020 & 2033
- Table 36: Global Biopolymer Packaging Volume K Forecast, by Country 2020 & 2033
- Table 37: United Kingdom Biopolymer Packaging Revenue (billion) Forecast, by Application 2020 & 2033
- Table 38: United Kingdom Biopolymer Packaging Volume (K) Forecast, by Application 2020 & 2033
- Table 39: Germany Biopolymer Packaging Revenue (billion) Forecast, by Application 2020 & 2033
- Table 40: Germany Biopolymer Packaging Volume (K) Forecast, by Application 2020 & 2033
- Table 41: France Biopolymer Packaging Revenue (billion) Forecast, by Application 2020 & 2033
- Table 42: France Biopolymer Packaging Volume (K) Forecast, by Application 2020 & 2033
- Table 43: Italy Biopolymer Packaging Revenue (billion) Forecast, by Application 2020 & 2033
- Table 44: Italy Biopolymer Packaging Volume (K) Forecast, by Application 2020 & 2033
- Table 45: Spain Biopolymer Packaging Revenue (billion) Forecast, by Application 2020 & 2033
- Table 46: Spain Biopolymer Packaging Volume (K) Forecast, by Application 2020 & 2033
- Table 47: Russia Biopolymer Packaging Revenue (billion) Forecast, by Application 2020 & 2033
- Table 48: Russia Biopolymer Packaging Volume (K) Forecast, by Application 2020 & 2033
- Table 49: Benelux Biopolymer Packaging Revenue (billion) Forecast, by Application 2020 & 2033
- Table 50: Benelux Biopolymer Packaging Volume (K) Forecast, by Application 2020 & 2033
- Table 51: Nordics Biopolymer Packaging Revenue (billion) Forecast, by Application 2020 & 2033
- Table 52: Nordics Biopolymer Packaging Volume (K) Forecast, by Application 2020 & 2033
- Table 53: Rest of Europe Biopolymer Packaging Revenue (billion) Forecast, by Application 2020 & 2033
- Table 54: Rest of Europe Biopolymer Packaging Volume (K) Forecast, by Application 2020 & 2033
- Table 55: Global Biopolymer Packaging Revenue billion Forecast, by Application 2020 & 2033
- Table 56: Global Biopolymer Packaging Volume K Forecast, by Application 2020 & 2033
- Table 57: Global Biopolymer Packaging Revenue billion Forecast, by Type 2020 & 2033
- Table 58: Global Biopolymer Packaging Volume K Forecast, by Type 2020 & 2033
- Table 59: Global Biopolymer Packaging Revenue billion Forecast, by Country 2020 & 2033
- Table 60: Global Biopolymer Packaging Volume K Forecast, by Country 2020 & 2033
- Table 61: Turkey Biopolymer Packaging Revenue (billion) Forecast, by Application 2020 & 2033
- Table 62: Turkey Biopolymer Packaging Volume (K) Forecast, by Application 2020 & 2033
- Table 63: Israel Biopolymer Packaging Revenue (billion) Forecast, by Application 2020 & 2033
- Table 64: Israel Biopolymer Packaging Volume (K) Forecast, by Application 2020 & 2033
- Table 65: GCC Biopolymer Packaging Revenue (billion) Forecast, by Application 2020 & 2033
- Table 66: GCC Biopolymer Packaging Volume (K) Forecast, by Application 2020 & 2033
- Table 67: North Africa Biopolymer Packaging Revenue (billion) Forecast, by Application 2020 & 2033
- Table 68: North Africa Biopolymer Packaging Volume (K) Forecast, by Application 2020 & 2033
- Table 69: South Africa Biopolymer Packaging Revenue (billion) Forecast, by Application 2020 & 2033
- Table 70: South Africa Biopolymer Packaging Volume (K) Forecast, by Application 2020 & 2033
- Table 71: Rest of Middle East & Africa Biopolymer Packaging Revenue (billion) Forecast, by Application 2020 & 2033
- Table 72: Rest of Middle East & Africa Biopolymer Packaging Volume (K) Forecast, by Application 2020 & 2033
- Table 73: Global Biopolymer Packaging Revenue billion Forecast, by Application 2020 & 2033
- Table 74: Global Biopolymer Packaging Volume K Forecast, by Application 2020 & 2033
- Table 75: Global Biopolymer Packaging Revenue billion Forecast, by Type 2020 & 2033
- Table 76: Global Biopolymer Packaging Volume K Forecast, by Type 2020 & 2033
- Table 77: Global Biopolymer Packaging Revenue billion Forecast, by Country 2020 & 2033
- Table 78: Global Biopolymer Packaging Volume K Forecast, by Country 2020 & 2033
- Table 79: China Biopolymer Packaging Revenue (billion) Forecast, by Application 2020 & 2033
- Table 80: China Biopolymer Packaging Volume (K) Forecast, by Application 2020 & 2033
- Table 81: India Biopolymer Packaging Revenue (billion) Forecast, by Application 2020 & 2033
- Table 82: India Biopolymer Packaging Volume (K) Forecast, by Application 2020 & 2033
- Table 83: Japan Biopolymer Packaging Revenue (billion) Forecast, by Application 2020 & 2033
- Table 84: Japan Biopolymer Packaging Volume (K) Forecast, by Application 2020 & 2033
- Table 85: South Korea Biopolymer Packaging Revenue (billion) Forecast, by Application 2020 & 2033
- Table 86: South Korea Biopolymer Packaging Volume (K) Forecast, by Application 2020 & 2033
- Table 87: ASEAN Biopolymer Packaging Revenue (billion) Forecast, by Application 2020 & 2033
- Table 88: ASEAN Biopolymer Packaging Volume (K) Forecast, by Application 2020 & 2033
- Table 89: Oceania Biopolymer Packaging Revenue (billion) Forecast, by Application 2020 & 2033
- Table 90: Oceania Biopolymer Packaging Volume (K) Forecast, by Application 2020 & 2033
- Table 91: Rest of Asia Pacific Biopolymer Packaging Revenue (billion) Forecast, by Application 2020 & 2033
- Table 92: Rest of Asia Pacific Biopolymer Packaging Volume (K) Forecast, by Application 2020 & 2033
Frequently Asked Questions
1. What is the projected Compound Annual Growth Rate (CAGR) of the Biopolymer Packaging?
The projected CAGR is approximately 17.2%.
2. Which companies are prominent players in the Biopolymer Packaging?
Key companies in the market include Arkema, BASF, NatureWorks, Plantic, Biome Technologies, Plantic Technologies, Bio-On, Toray Industries, Spectra Packaging, United Biopolymers.
3. What are the main segments of the Biopolymer Packaging?
The market segments include Application, Type.
4. Can you provide details about the market size?
The market size is estimated to be USD 24.71 billion as of 2022.
5. What are some drivers contributing to market growth?
N/A
6. What are the notable trends driving market growth?
N/A
7. Are there any restraints impacting market growth?
N/A
8. Can you provide examples of recent developments in the market?
N/A
9. What pricing options are available for accessing the report?
Pricing options include single-user, multi-user, and enterprise licenses priced at USD 3950.00, USD 5925.00, and USD 7900.00 respectively.
10. Is the market size provided in terms of value or volume?
The market size is provided in terms of value, measured in billion and volume, measured in K.
11. Are there any specific market keywords associated with the report?
Yes, the market keyword associated with the report is "Biopolymer Packaging," which aids in identifying and referencing the specific market segment covered.
12. How do I determine which pricing option suits my needs best?
The pricing options vary based on user requirements and access needs. Individual users may opt for single-user licenses, while businesses requiring broader access may choose multi-user or enterprise licenses for cost-effective access to the report.
13. Are there any additional resources or data provided in the Biopolymer Packaging report?
While the report offers comprehensive insights, it's advisable to review the specific contents or supplementary materials provided to ascertain if additional resources or data are available.
14. How can I stay updated on further developments or reports in the Biopolymer Packaging?
To stay informed about further developments, trends, and reports in the Biopolymer Packaging, consider subscribing to industry newsletters, following relevant companies and organizations, or regularly checking reputable industry news sources and publications.
Methodology
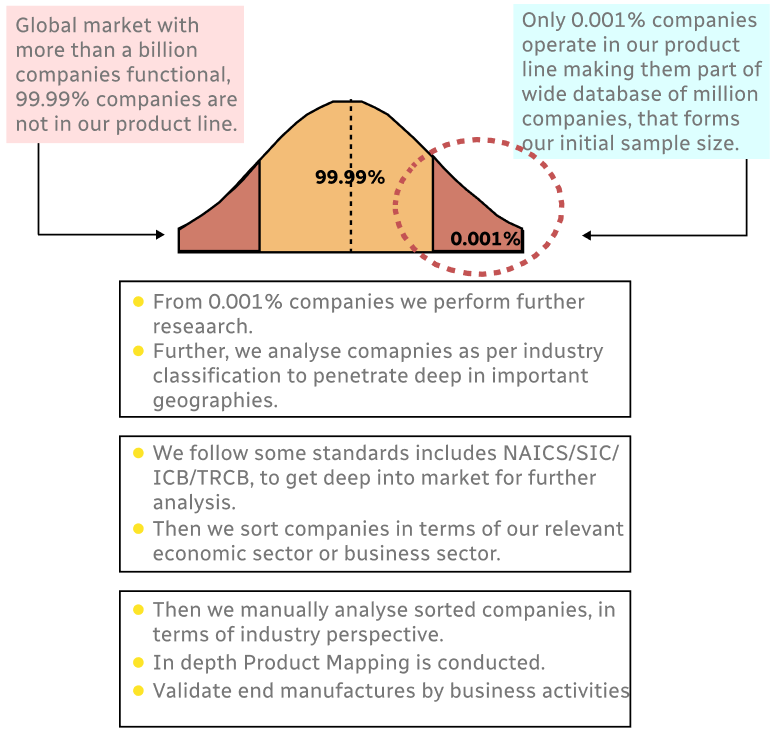
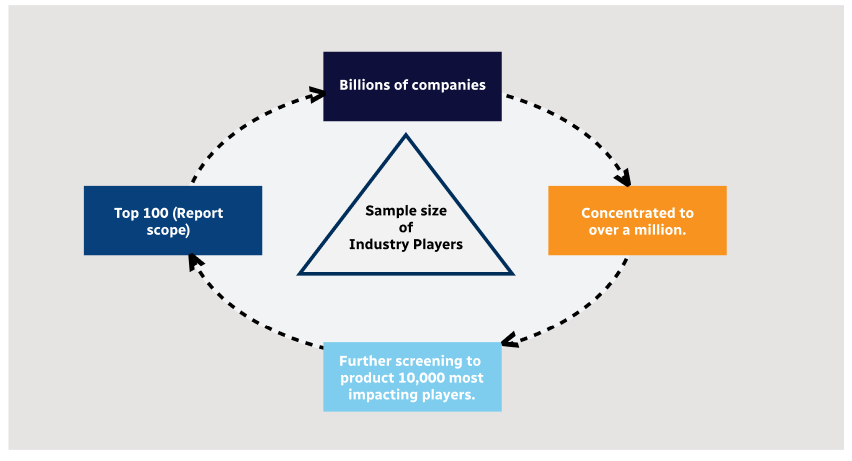
Step 1 - Identification of Relevant Samples Size from Population Database
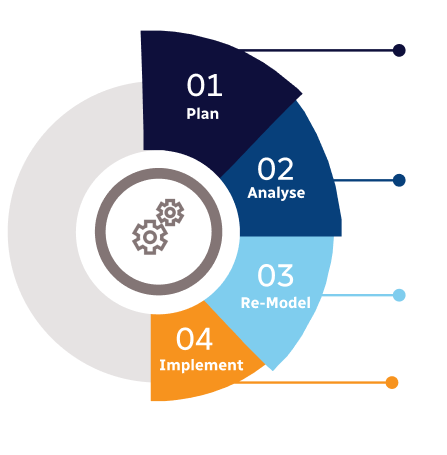
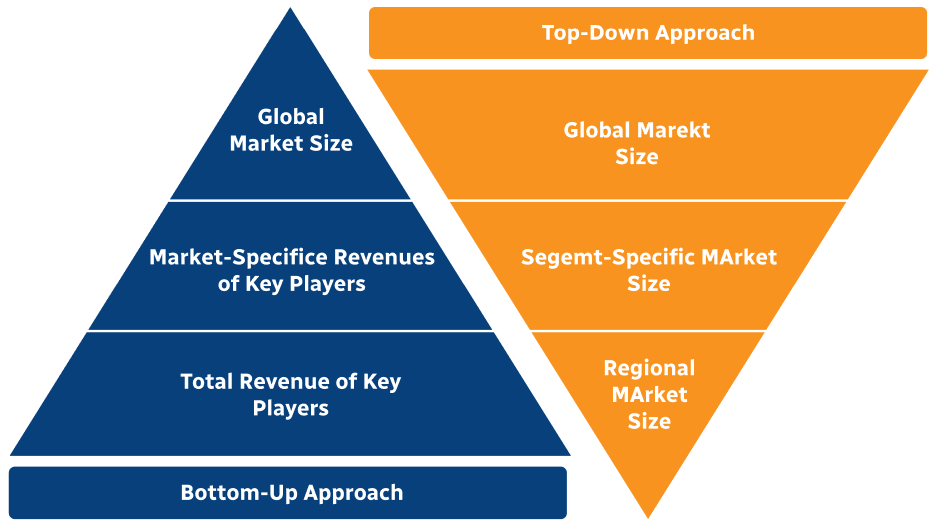
Step 2 - Approaches for Defining Global Market Size (Value, Volume* & Price*)
Note*: In applicable scenarios
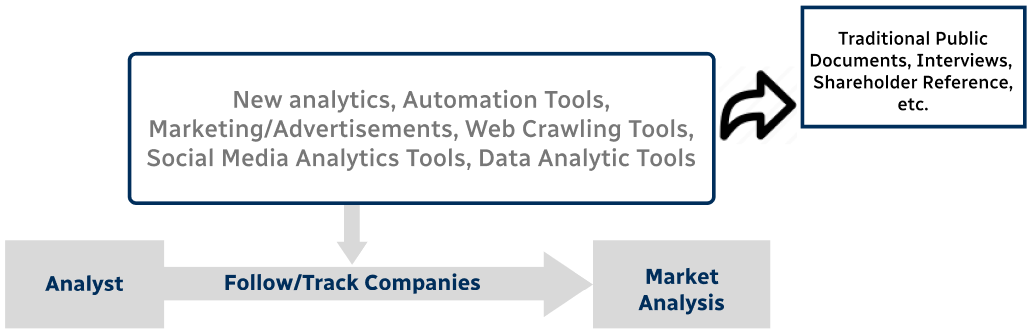
Step 3 - Data Sources
Primary Research
- Web Analytics
- Survey Reports
- Research Institute
- Latest Research Reports
- Opinion Leaders
Secondary Research
- Annual Reports
- White Paper
- Latest Press Release
- Industry Association
- Paid Database
- Investor Presentations
Step 4 - Data Triangulation
Involves using different sources of information in order to increase the validity of a study
These sources are likely to be stakeholders in a program - participants, other researchers, program staff, other community members, and so on.
Then we put all data in single framework & apply various statistical tools to find out the dynamic on the market.
During the analysis stage, feedback from the stakeholder groups would be compared to determine areas of agreement as well as areas of divergence