

Key Insights
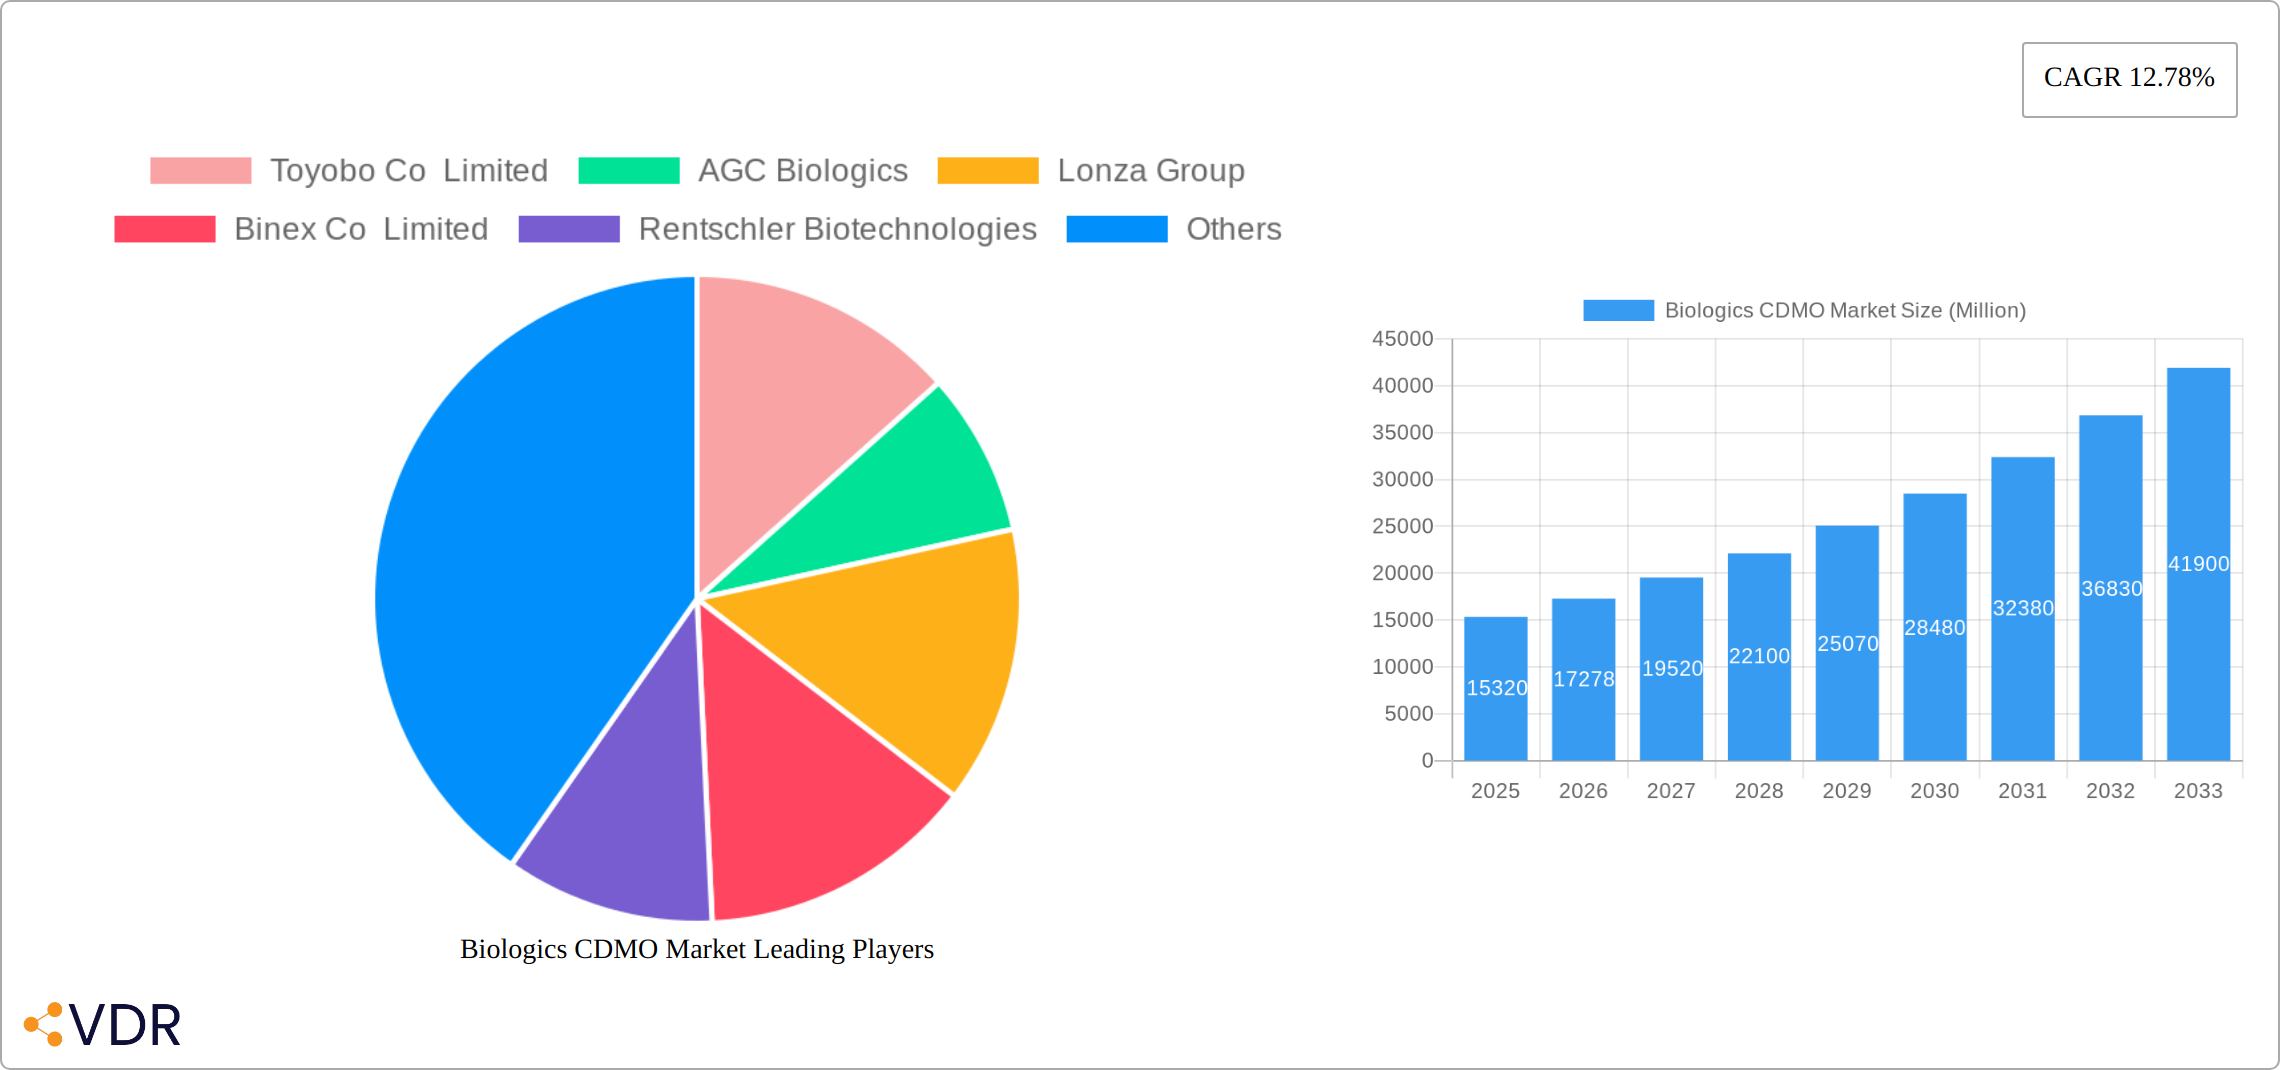
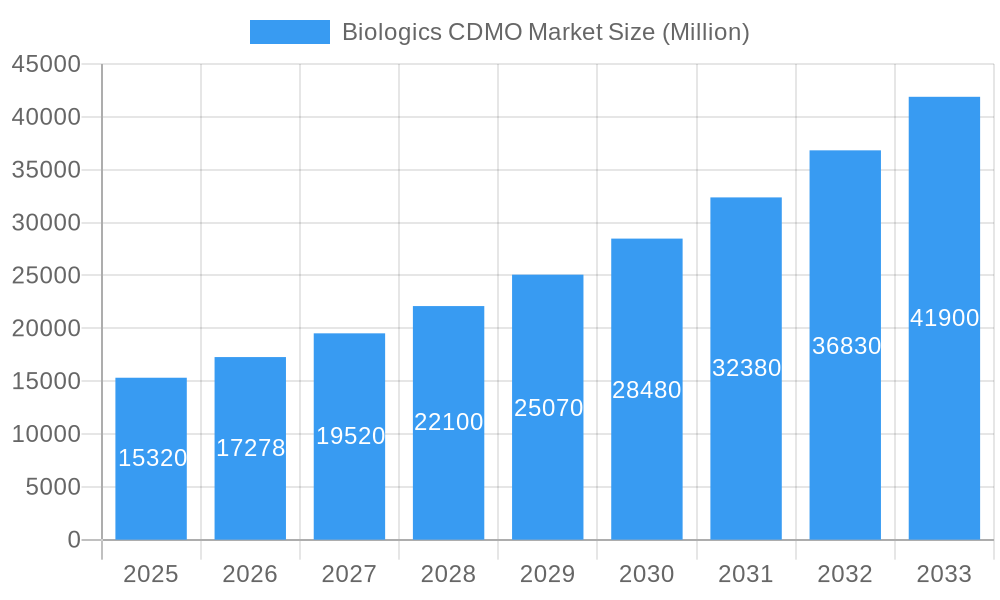
The Biologics Contract Development and Manufacturing Organization (CDMO) market is experiencing robust growth, projected to reach \$15.32 billion in 2025 and exhibiting a Compound Annual Growth Rate (CAGR) of 12.78% from 2025 to 2033. This expansion is driven by several key factors. The increasing prevalence of chronic diseases globally necessitates a higher demand for biologics, fueling the need for efficient and reliable CDMO services. Furthermore, the rising adoption of advanced technologies like cell line development and process analytical technology (PAT) within CDMOs is enhancing production efficiency and reducing time-to-market for new biologics. The growing pipeline of biosimilar drugs also contributes significantly to market growth, as companies seek cost-effective manufacturing solutions. Finally, the outsourcing trend among pharmaceutical and biotechnology companies continues to gain momentum, driven by the desire to focus on core competencies and leverage the specialized expertise of CDMOs. This trend is evident across all segments, including biosimilars, mammalian and microbial-derived biologics, and various product types. Key players like Samsung Biologics, Lonza Group, and Fujifilm Diosynth Biotechnologies are leading this growth with their advanced capabilities and global reach.
Biologics CDMO Market Market Size (In Billion)
The market segmentation reveals a dynamic landscape. Mammalian-derived biologics currently dominate the market due to their established use and efficacy, but non-mammalian (microbial) biologics are gaining traction due to their cost-effectiveness and suitability for large-scale production. The biosimilars segment is poised for significant growth, driven by patent expirations of blockbuster biologics and the increasing demand for affordable treatment options. Regional variations exist, with North America and Europe currently holding significant market shares. However, the Asia-Pacific region is anticipated to experience the fastest growth due to burgeoning pharmaceutical industries and increasing investment in biotechnology infrastructure. The competitive landscape is highly fragmented, with numerous established and emerging CDMOs vying for market share, resulting in a dynamic and innovative market environment. The market's future trajectory indicates continued expansion, driven by technological advancements, increasing demand for biologics, and the ongoing trend of outsourcing within the pharmaceutical industry.
Biologics CDMO Market Company Market Share
Biologics CDMO Market: A Comprehensive Report (2019-2033)
This in-depth report provides a comprehensive analysis of the Biologics CDMO market, encompassing market dynamics, growth trends, regional dominance, product landscape, key challenges, emerging opportunities, and key players. The study period covers 2019-2033, with a focus on the forecast period 2025-2033 and a base year of 2025. The report utilizes data from various sources to deliver actionable insights for industry professionals, investors, and stakeholders. Market values are presented in Million units.
Biologics CDMO Market Dynamics & Structure
The Biologics CDMO market is characterized by a moderately concentrated landscape with several major players vying for market share. Technological innovation, particularly in areas like cell and gene therapy manufacturing, is a significant growth driver. Stringent regulatory frameworks, especially those governing biologics approval and manufacturing processes, pose both challenges and opportunities. The emergence of biosimilars presents a significant competitive factor, pushing CDMOs to adapt and innovate.
- Market Concentration: The top five players hold approximately xx% of the market share (2024). The market exhibits moderate consolidation, with ongoing mergers and acquisitions (M&A) activity shaping the competitive landscape.
- Technological Innovation: Advancements in single-use technologies, process analytical technology (PAT), and continuous manufacturing are transforming the efficiency and scalability of biologics production. However, high capital investment and expertise requirements pose significant barriers to entry for smaller players.
- Regulatory Landscape: Stringent regulatory compliance requirements, varying across geographies, necessitate significant investment in quality control and assurance systems. This presents a substantial barrier to entry, particularly for smaller CDMOs.
- Competitive Product Substitutes: Biosimilars are emerging as significant competitive substitutes for originator biologics, impacting CDMOs' service demand, requiring them to diversify and adopt innovative approaches.
- End-User Demographics: The market comprises pharmaceutical and biotechnology companies of varying sizes, ranging from large multinational corporations to smaller biotech startups. This diverse customer base presents both growth opportunities and challenges for CDMOs.
- M&A Trends: The market has witnessed a significant rise in M&A activity in recent years (xx deals in 2024), driven by the pursuit of expanded capacity, technological capabilities, and broader market reach.
Biologics CDMO Market Growth Trends & Insights
The Biologics CDMO market experienced significant growth during the historical period (2019-2024), driven by increased biologics drug development and approvals. The market size is estimated to be xx Million in 2025, exhibiting a Compound Annual Growth Rate (CAGR) of xx% during the forecast period (2025-2033). This growth is primarily attributed to the rising prevalence of chronic diseases, increased demand for innovative biologics, and an upsurge in outsourcing by pharmaceutical companies. Technological advancements, particularly in cell and gene therapies, are further accelerating market expansion. The market penetration rate for CDMO services within the biologics industry is projected to increase from xx% in 2025 to xx% by 2033. This expansion is influenced by the growing complexity and cost associated with in-house biologics manufacturing. Consumer behavior shifts, such as increasing preference for personalized medicine, also contribute to market growth.
Dominant Regions, Countries, or Segments in Biologics CDMO Market
North America currently dominates the Biologics CDMO market, driven by a robust pharmaceutical and biotechnology ecosystem, substantial R&D investment, and the presence of several leading CDMOs. Within this region, the US holds the largest market share. The European market is also witnessing significant growth, fueled by increasing government support for the life sciences sector. Asia-Pacific is projected to showcase high growth potential driven by rising healthcare expenditure, growing biopharmaceutical industry, and strategic investments in CDMO facilities.
- By Type: The Mammalian segment dominates the market, driven by its superior ability to produce complex proteins.
- By Product Type: The monoclonal antibodies segment holds the largest market share due to the widespread application and effectiveness of this therapy.
- Other Biologics: The biosimilar segment experiences robust growth owing to increasing demand for cost-effective treatment options.
Key Drivers:
- Strong R&D investments by pharmaceutical and biotechnology companies
- Growing demand for biologics driven by increased prevalence of chronic diseases.
- Favorable regulatory environment in key regions.
- Strategic partnerships and collaborations among industry stakeholders.
Growth Potential:
- Emerging economies in Asia-Pacific and Latin America present untapped market opportunities.
- Advancements in cell and gene therapy manufacturing technologies fuel further expansion.
Biologics CDMO Market Product Landscape
The Biologics CDMO market offers a diverse range of services, encompassing process development, analytical testing, manufacturing, and formulation. CDMOs are increasingly integrating advanced technologies like single-use systems and continuous manufacturing to enhance efficiency and reduce costs. Unique selling propositions frequently center on specialized expertise in specific therapeutic areas (e.g., monoclonal antibodies, cell & gene therapy), advanced technological capabilities, and global manufacturing footprints. This leads to an increase in contract manufacturing of biologics to meet rising demand.
Key Drivers, Barriers & Challenges in Biologics CDMO Market
Key Drivers:
- Rising demand for biologics, driven by the prevalence of chronic diseases.
- Increasing outsourcing of manufacturing by pharmaceutical companies.
- Technological advancements enhancing manufacturing efficiency and cost-effectiveness.
- Favorable government policies and incentives promoting the growth of the biopharmaceutical industry.
Challenges:
- Stringent regulatory requirements for biologics manufacturing.
- High capital investment required for advanced technologies.
- Supply chain disruptions impacting raw material availability and manufacturing timelines.
- Intense competition from established CDMOs and new entrants. This competition puts downward pressure on pricing. Market share struggles lead to decreased profitability for certain players in the industry.
Emerging Opportunities in Biologics CDMO Market
The Biologics Contract Development and Manufacturing Organization (CDMO) market is experiencing explosive growth, fueled by several key trends. The burgeoning cell and gene therapy market, with its promise of personalized medicine, is a major driver. This is further amplified by the increasing demand for biosimilars, offering cost-effective alternatives to expensive biologics. Untapped potential exists in emerging economies, where access to advanced therapies is rapidly increasing. Furthermore, innovative manufacturing technologies, including continuous processing, automation, and single-use systems, are streamlining production, reducing costs, and accelerating time-to-market. Finally, a growing emphasis on sustainable and environmentally responsible manufacturing practices presents significant opportunities for CDMOs committed to responsible production.
Growth Accelerators in the Biologics CDMO Market Industry
Several factors are accelerating growth within the Biologics CDMO market. Technological advancements, such as the widespread adoption of single-use systems and continuous manufacturing, are dramatically improving efficiency and reducing manufacturing footprints. These technologies not only enhance productivity but also improve product quality and reduce operational risks. Strategic partnerships and collaborations are crucial, enabling CDMOs and pharmaceutical companies to leverage each other's expertise and resources, fostering innovation and expanding market reach. The expansion of manufacturing capacity in strategically important regions, particularly those with robust regulatory frameworks and skilled workforces, is essential to meet the escalating global demand. The continued growth and acceptance of biosimilars also significantly contributes to overall market expansion, offering cost-effective treatment options and opening new markets.
Key Players Shaping the Biologics CDMO Market Market
- Toyobo Co Limited
- AGC Biologics
- Lonza Group
- Binex Co Limited
- Rentschler Biotechnologies
- Wuxi Biologics
- AbbVie Contract Manufacturing
- Parexel International Corporation
- Sandoz Biopharmaceuticals (Novartis AG)
- Catalent Inc
- JRS Pharma
- Fujifilm Diosynth Biotechnologies USA Inc
- Samsung Biologics
- Boehringer Ingelheim Group
- Icon PLC
Notable Milestones in Biologics CDMO Market Sector
- December 2021: AstraZeneca and Samsung Biologics solidified their strategic partnership, significantly expanding their manufacturing capabilities and bolstering Samsung Biologics' position as a leading CDMO. This collaboration underscores the increasing reliance on strategic partnerships to scale biologics production.
- March 2022: Oasmia Pharmaceutical AB and Lonza's large-scale manufacturing agreement highlighted the surging demand for CDMO services in clinical development, particularly for complex and specialized biologics.
- April 2022: FUJIFILM Corporation's acquisition of a cell therapy manufacturing facility demonstrated a significant commitment to the rapidly expanding cell and gene therapy sector, further strengthening their position as a leading CDMO in this critical area.
- [Add a more recent milestone here - e.g., a major acquisition, partnership, or technological advancement in the Biologics CDMO space. Include date and brief description.]
In-Depth Biologics CDMO Market Market Outlook
The Biologics CDMO market is poised for sustained growth over the forecast period, driven by continuous technological advancements, increasing demand for biologics, and strategic partnerships. The expanding cell and gene therapy market, along with the growing adoption of biosimilars, presents significant opportunities for CDMOs to capitalize on. Strategic acquisitions and capacity expansion by leading players will further shape the market dynamics, creating a competitive yet promising landscape for innovation and growth.
Biologics CDMO Market Segmentation
-
1. Type
- 1.1. Mammalian
- 1.2. Non-mammalian (Microbial)
-
2. Product Type
-
2.1. Biologics
- 2.1.1. Monoclon
- 2.1.2. Recombinant Proteins
- 2.1.3. Antisense and Molecular Therapy
- 2.1.4. Vaccines
- 2.1.5. Other Biologics
- 2.2. Biosimilars
-
2.1. Biologics
Biologics CDMO Market Segmentation By Geography
- 1. North America
- 2. Europe
- 3. Asia
- 4. Australia and New Zealand
- 5. Latin America
- 6. Middle East and Africa
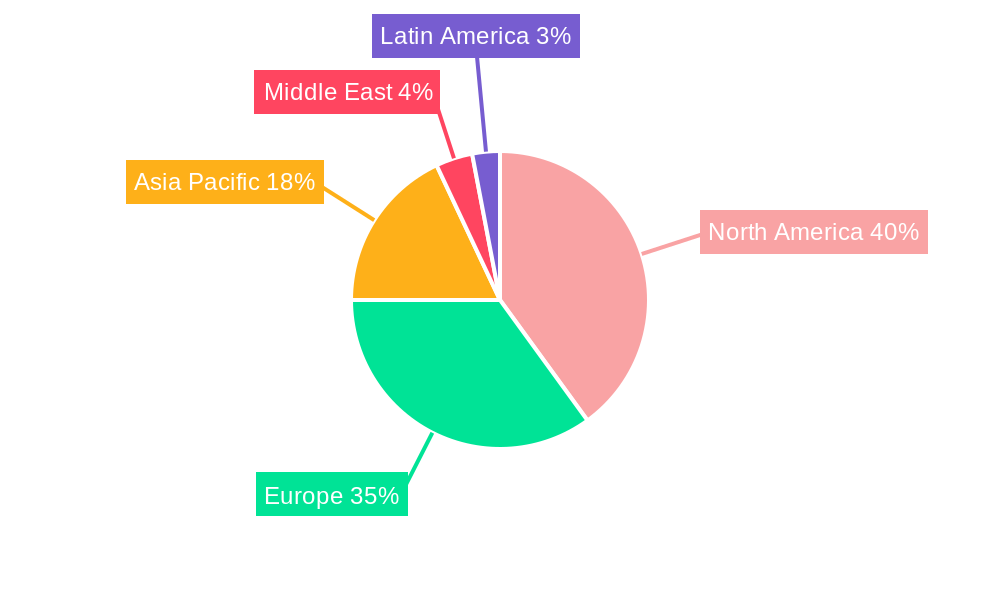
Biologics CDMO Market Regional Market Share
Geographic Coverage of Biologics CDMO Market
Biologics CDMO Market REPORT HIGHLIGHTS
| Aspects | Details |
|---|---|
| Study Period | 2020-2034 |
| Base Year | 2025 |
| Estimated Year | 2026 |
| Forecast Period | 2026-2034 |
| Historical Period | 2020-2025 |
| Growth Rate | CAGR of 12.78% from 2020-2034 |
| Segmentation |
|
Table of Contents
- 1. Introduction
- 1.1. Research Scope
- 1.2. Market Segmentation
- 1.3. Research Objective
- 1.4. Definitions and Assumptions
- 2. Executive Summary
- 2.1. Market Snapshot
- 3. Market Dynamics
- 3.1. Market Drivers
- 3.2. Market Restrains
- 3.3. Market Trends
- 3.4. Market Opportunities
- 4. Market Factor Analysis
- 4.1. Porters Five Forces
- 4.1.1. Bargaining Power of Suppliers
- 4.1.2. Bargaining Power of Buyers
- 4.1.3. Threat of New Entrants
- 4.1.4. Threat of Substitutes
- 4.1.5. Competitive Rivalry
- 4.2. PESTEL analysis
- 4.3. BCG Analysis
- 4.3.1. Stars (High Growth, High Market Share)
- 4.3.2. Cash Cows (Low Growth, High Market Share)
- 4.3.3. Question Mark (High Growth, Low Market Share)
- 4.3.4. Dogs (Low Growth, Low Market Share)
- 4.4. Ansoff Matrix Analysis
- 4.5. Supply Chain Analysis
- 4.6. Regulatory Landscape
- 4.7. Current Market Potential and Opportunity Assessment (TAM–SAM–SOM Framework)
- 4.8. VDR Analyst Note
- 4.1. Porters Five Forces
- 5. Market Analysis, Insights and Forecast 2021-2033
- 5.1. Market Analysis, Insights and Forecast - by Type
- 5.1.1. Mammalian
- 5.1.2. Non-mammalian (Microbial)
- 5.2. Market Analysis, Insights and Forecast - by Product Type
- 5.2.1. Biologics
- 5.2.1.1. Monoclon
- 5.2.1.2. Recombinant Proteins
- 5.2.1.3. Antisense and Molecular Therapy
- 5.2.1.4. Vaccines
- 5.2.1.5. Other Biologics
- 5.2.2. Biosimilars
- 5.2.1. Biologics
- 5.3. Market Analysis, Insights and Forecast - by Region
- 5.3.1. North America
- 5.3.2. Europe
- 5.3.3. Asia
- 5.3.4. Australia and New Zealand
- 5.3.5. Latin America
- 5.3.6. Middle East and Africa
- 5.1. Market Analysis, Insights and Forecast - by Type
- 6. Global Biologics CDMO Market Analysis, Insights and Forecast, 2021-2033
- 6.1. Market Analysis, Insights and Forecast - by Type
- 6.1.1. Mammalian
- 6.1.2. Non-mammalian (Microbial)
- 6.2. Market Analysis, Insights and Forecast - by Product Type
- 6.2.1. Biologics
- 6.2.1.1. Monoclon
- 6.2.1.2. Recombinant Proteins
- 6.2.1.3. Antisense and Molecular Therapy
- 6.2.1.4. Vaccines
- 6.2.1.5. Other Biologics
- 6.2.2. Biosimilars
- 6.2.1. Biologics
- 6.1. Market Analysis, Insights and Forecast - by Type
- 7. North America Biologics CDMO Market Analysis, Insights and Forecast, 2021-2033
- 7.1. Market Analysis, Insights and Forecast - by Type
- 7.1.1. Mammalian
- 7.1.2. Non-mammalian (Microbial)
- 7.2. Market Analysis, Insights and Forecast - by Product Type
- 7.2.1. Biologics
- 7.2.1.1. Monoclon
- 7.2.1.2. Recombinant Proteins
- 7.2.1.3. Antisense and Molecular Therapy
- 7.2.1.4. Vaccines
- 7.2.1.5. Other Biologics
- 7.2.2. Biosimilars
- 7.2.1. Biologics
- 7.1. Market Analysis, Insights and Forecast - by Type
- 8. Europe Biologics CDMO Market Analysis, Insights and Forecast, 2021-2033
- 8.1. Market Analysis, Insights and Forecast - by Type
- 8.1.1. Mammalian
- 8.1.2. Non-mammalian (Microbial)
- 8.2. Market Analysis, Insights and Forecast - by Product Type
- 8.2.1. Biologics
- 8.2.1.1. Monoclon
- 8.2.1.2. Recombinant Proteins
- 8.2.1.3. Antisense and Molecular Therapy
- 8.2.1.4. Vaccines
- 8.2.1.5. Other Biologics
- 8.2.2. Biosimilars
- 8.2.1. Biologics
- 8.1. Market Analysis, Insights and Forecast - by Type
- 9. Asia Biologics CDMO Market Analysis, Insights and Forecast, 2021-2033
- 9.1. Market Analysis, Insights and Forecast - by Type
- 9.1.1. Mammalian
- 9.1.2. Non-mammalian (Microbial)
- 9.2. Market Analysis, Insights and Forecast - by Product Type
- 9.2.1. Biologics
- 9.2.1.1. Monoclon
- 9.2.1.2. Recombinant Proteins
- 9.2.1.3. Antisense and Molecular Therapy
- 9.2.1.4. Vaccines
- 9.2.1.5. Other Biologics
- 9.2.2. Biosimilars
- 9.2.1. Biologics
- 9.1. Market Analysis, Insights and Forecast - by Type
- 10. Australia and New Zealand Biologics CDMO Market Analysis, Insights and Forecast, 2021-2033
- 10.1. Market Analysis, Insights and Forecast - by Type
- 10.1.1. Mammalian
- 10.1.2. Non-mammalian (Microbial)
- 10.2. Market Analysis, Insights and Forecast - by Product Type
- 10.2.1. Biologics
- 10.2.1.1. Monoclon
- 10.2.1.2. Recombinant Proteins
- 10.2.1.3. Antisense and Molecular Therapy
- 10.2.1.4. Vaccines
- 10.2.1.5. Other Biologics
- 10.2.2. Biosimilars
- 10.2.1. Biologics
- 10.1. Market Analysis, Insights and Forecast - by Type
- 11. Latin America Biologics CDMO Market Analysis, Insights and Forecast, 2021-2033
- 11.1. Market Analysis, Insights and Forecast - by Type
- 11.1.1. Mammalian
- 11.1.2. Non-mammalian (Microbial)
- 11.2. Market Analysis, Insights and Forecast - by Product Type
- 11.2.1. Biologics
- 11.2.1.1. Monoclon
- 11.2.1.2. Recombinant Proteins
- 11.2.1.3. Antisense and Molecular Therapy
- 11.2.1.4. Vaccines
- 11.2.1.5. Other Biologics
- 11.2.2. Biosimilars
- 11.2.1. Biologics
- 11.1. Market Analysis, Insights and Forecast - by Type
- 12. Middle East and Africa Biologics CDMO Market Analysis, Insights and Forecast, 2021-2033
- 12.1. Market Analysis, Insights and Forecast - by Type
- 12.1.1. Mammalian
- 12.1.2. Non-mammalian (Microbial)
- 12.2. Market Analysis, Insights and Forecast - by Product Type
- 12.2.1. Biologics
- 12.2.1.1. Monoclon
- 12.2.1.2. Recombinant Proteins
- 12.2.1.3. Antisense and Molecular Therapy
- 12.2.1.4. Vaccines
- 12.2.1.5. Other Biologics
- 12.2.2. Biosimilars
- 12.2.1. Biologics
- 12.1. Market Analysis, Insights and Forecast - by Type
- 13. Competitive Analysis
- 13.1. Company Profiles
- 13.1.1 Toyobo Co Limited
- 13.1.1.1. Company Overview
- 13.1.1.2. Products
- 13.1.1.3. Company Financials
- 13.1.1.4. SWOT Analysis
- 13.1.2 AGC Biologics
- 13.1.2.1. Company Overview
- 13.1.2.2. Products
- 13.1.2.3. Company Financials
- 13.1.2.4. SWOT Analysis
- 13.1.3 Lonza Group
- 13.1.3.1. Company Overview
- 13.1.3.2. Products
- 13.1.3.3. Company Financials
- 13.1.3.4. SWOT Analysis
- 13.1.4 Binex Co Limited
- 13.1.4.1. Company Overview
- 13.1.4.2. Products
- 13.1.4.3. Company Financials
- 13.1.4.4. SWOT Analysis
- 13.1.5 Rentschler Biotechnologies
- 13.1.5.1. Company Overview
- 13.1.5.2. Products
- 13.1.5.3. Company Financials
- 13.1.5.4. SWOT Analysis
- 13.1.6 Wuxi Biologics
- 13.1.6.1. Company Overview
- 13.1.6.2. Products
- 13.1.6.3. Company Financials
- 13.1.6.4. SWOT Analysis
- 13.1.7 AbbVie Contract Manufacturing*List Not Exhaustive
- 13.1.7.1. Company Overview
- 13.1.7.2. Products
- 13.1.7.3. Company Financials
- 13.1.7.4. SWOT Analysis
- 13.1.8 Parexel International Corporation
- 13.1.8.1. Company Overview
- 13.1.8.2. Products
- 13.1.8.3. Company Financials
- 13.1.8.4. SWOT Analysis
- 13.1.9 Sandoz Biopharmaceuticals (Novartis AG)
- 13.1.9.1. Company Overview
- 13.1.9.2. Products
- 13.1.9.3. Company Financials
- 13.1.9.4. SWOT Analysis
- 13.1.10 Catalent Inc
- 13.1.10.1. Company Overview
- 13.1.10.2. Products
- 13.1.10.3. Company Financials
- 13.1.10.4. SWOT Analysis
- 13.1.11 JRS Pharma
- 13.1.11.1. Company Overview
- 13.1.11.2. Products
- 13.1.11.3. Company Financials
- 13.1.11.4. SWOT Analysis
- 13.1.12 Fujifilm Diosynth Biotechnologies USA Inc
- 13.1.12.1. Company Overview
- 13.1.12.2. Products
- 13.1.12.3. Company Financials
- 13.1.12.4. SWOT Analysis
- 13.1.13 Samsung Biologics
- 13.1.13.1. Company Overview
- 13.1.13.2. Products
- 13.1.13.3. Company Financials
- 13.1.13.4. SWOT Analysis
- 13.1.14 Boehringer Ingelheim Group
- 13.1.14.1. Company Overview
- 13.1.14.2. Products
- 13.1.14.3. Company Financials
- 13.1.14.4. SWOT Analysis
- 13.1.15 Icon PLC
- 13.1.15.1. Company Overview
- 13.1.15.2. Products
- 13.1.15.3. Company Financials
- 13.1.15.4. SWOT Analysis
- 13.1.1 Toyobo Co Limited
- 13.2. Market Entropy
- 13.2.1 Company's Key Areas Served
- 13.2.2 Recent Developments
- 13.3. Company Market Share Analysis 2025
- 13.3.1 Top 5 Companies Market Share Analysis
- 13.3.2 Top 3 Companies Market Share Analysis
- 13.4. List of Potential Customers
- 14. Research Methodology
List of Figures
- Figure 1: Global Biologics CDMO Market Revenue Breakdown (Million, %) by Region 2025 & 2033
- Figure 2: North America Biologics CDMO Market Revenue (Million), by Type 2025 & 2033
- Figure 3: North America Biologics CDMO Market Revenue Share (%), by Type 2025 & 2033
- Figure 4: North America Biologics CDMO Market Revenue (Million), by Product Type 2025 & 2033
- Figure 5: North America Biologics CDMO Market Revenue Share (%), by Product Type 2025 & 2033
- Figure 6: North America Biologics CDMO Market Revenue (Million), by Country 2025 & 2033
- Figure 7: North America Biologics CDMO Market Revenue Share (%), by Country 2025 & 2033
- Figure 8: Europe Biologics CDMO Market Revenue (Million), by Type 2025 & 2033
- Figure 9: Europe Biologics CDMO Market Revenue Share (%), by Type 2025 & 2033
- Figure 10: Europe Biologics CDMO Market Revenue (Million), by Product Type 2025 & 2033
- Figure 11: Europe Biologics CDMO Market Revenue Share (%), by Product Type 2025 & 2033
- Figure 12: Europe Biologics CDMO Market Revenue (Million), by Country 2025 & 2033
- Figure 13: Europe Biologics CDMO Market Revenue Share (%), by Country 2025 & 2033
- Figure 14: Asia Biologics CDMO Market Revenue (Million), by Type 2025 & 2033
- Figure 15: Asia Biologics CDMO Market Revenue Share (%), by Type 2025 & 2033
- Figure 16: Asia Biologics CDMO Market Revenue (Million), by Product Type 2025 & 2033
- Figure 17: Asia Biologics CDMO Market Revenue Share (%), by Product Type 2025 & 2033
- Figure 18: Asia Biologics CDMO Market Revenue (Million), by Country 2025 & 2033
- Figure 19: Asia Biologics CDMO Market Revenue Share (%), by Country 2025 & 2033
- Figure 20: Australia and New Zealand Biologics CDMO Market Revenue (Million), by Type 2025 & 2033
- Figure 21: Australia and New Zealand Biologics CDMO Market Revenue Share (%), by Type 2025 & 2033
- Figure 22: Australia and New Zealand Biologics CDMO Market Revenue (Million), by Product Type 2025 & 2033
- Figure 23: Australia and New Zealand Biologics CDMO Market Revenue Share (%), by Product Type 2025 & 2033
- Figure 24: Australia and New Zealand Biologics CDMO Market Revenue (Million), by Country 2025 & 2033
- Figure 25: Australia and New Zealand Biologics CDMO Market Revenue Share (%), by Country 2025 & 2033
- Figure 26: Latin America Biologics CDMO Market Revenue (Million), by Type 2025 & 2033
- Figure 27: Latin America Biologics CDMO Market Revenue Share (%), by Type 2025 & 2033
- Figure 28: Latin America Biologics CDMO Market Revenue (Million), by Product Type 2025 & 2033
- Figure 29: Latin America Biologics CDMO Market Revenue Share (%), by Product Type 2025 & 2033
- Figure 30: Latin America Biologics CDMO Market Revenue (Million), by Country 2025 & 2033
- Figure 31: Latin America Biologics CDMO Market Revenue Share (%), by Country 2025 & 2033
- Figure 32: Middle East and Africa Biologics CDMO Market Revenue (Million), by Type 2025 & 2033
- Figure 33: Middle East and Africa Biologics CDMO Market Revenue Share (%), by Type 2025 & 2033
- Figure 34: Middle East and Africa Biologics CDMO Market Revenue (Million), by Product Type 2025 & 2033
- Figure 35: Middle East and Africa Biologics CDMO Market Revenue Share (%), by Product Type 2025 & 2033
- Figure 36: Middle East and Africa Biologics CDMO Market Revenue (Million), by Country 2025 & 2033
- Figure 37: Middle East and Africa Biologics CDMO Market Revenue Share (%), by Country 2025 & 2033
List of Tables
- Table 1: Global Biologics CDMO Market Revenue Million Forecast, by Type 2020 & 2033
- Table 2: Global Biologics CDMO Market Revenue Million Forecast, by Product Type 2020 & 2033
- Table 3: Global Biologics CDMO Market Revenue Million Forecast, by Region 2020 & 2033
- Table 4: Global Biologics CDMO Market Revenue Million Forecast, by Type 2020 & 2033
- Table 5: Global Biologics CDMO Market Revenue Million Forecast, by Product Type 2020 & 2033
- Table 6: Global Biologics CDMO Market Revenue Million Forecast, by Country 2020 & 2033
- Table 7: Global Biologics CDMO Market Revenue Million Forecast, by Type 2020 & 2033
- Table 8: Global Biologics CDMO Market Revenue Million Forecast, by Product Type 2020 & 2033
- Table 9: Global Biologics CDMO Market Revenue Million Forecast, by Country 2020 & 2033
- Table 10: Global Biologics CDMO Market Revenue Million Forecast, by Type 2020 & 2033
- Table 11: Global Biologics CDMO Market Revenue Million Forecast, by Product Type 2020 & 2033
- Table 12: Global Biologics CDMO Market Revenue Million Forecast, by Country 2020 & 2033
- Table 13: Global Biologics CDMO Market Revenue Million Forecast, by Type 2020 & 2033
- Table 14: Global Biologics CDMO Market Revenue Million Forecast, by Product Type 2020 & 2033
- Table 15: Global Biologics CDMO Market Revenue Million Forecast, by Country 2020 & 2033
- Table 16: Global Biologics CDMO Market Revenue Million Forecast, by Type 2020 & 2033
- Table 17: Global Biologics CDMO Market Revenue Million Forecast, by Product Type 2020 & 2033
- Table 18: Global Biologics CDMO Market Revenue Million Forecast, by Country 2020 & 2033
- Table 19: Global Biologics CDMO Market Revenue Million Forecast, by Type 2020 & 2033
- Table 20: Global Biologics CDMO Market Revenue Million Forecast, by Product Type 2020 & 2033
- Table 21: Global Biologics CDMO Market Revenue Million Forecast, by Country 2020 & 2033
Frequently Asked Questions
1. What is the projected Compound Annual Growth Rate (CAGR) of the Biologics CDMO Market?
The projected CAGR is approximately 12.78%.
2. Which companies are prominent players in the Biologics CDMO Market?
Key companies in the market include Toyobo Co Limited, AGC Biologics, Lonza Group, Binex Co Limited, Rentschler Biotechnologies, Wuxi Biologics, AbbVie Contract Manufacturing*List Not Exhaustive, Parexel International Corporation, Sandoz Biopharmaceuticals (Novartis AG), Catalent Inc, JRS Pharma, Fujifilm Diosynth Biotechnologies USA Inc, Samsung Biologics, Boehringer Ingelheim Group, Icon PLC.
3. What are the main segments of the Biologics CDMO Market?
The market segments include Type, Product Type.
4. Can you provide details about the market size?
The market size is estimated to be USD 15.32 Million as of 2022.
5. What are some drivers contributing to market growth?
Access to New Technologies and Higher Speed of Execution Realized by CDMOs; Need for High Capital Investments to Develop Capabilities Has Led to Firms Choosing the Outsourcing Model; Lack of In-house Capacity among Emerging Drug Development Companies.
6. What are the notable trends driving market growth?
CDMOs’ Access to New Technologies and Higher Speed of Execution Driving Market Growth.
7. Are there any restraints impacting market growth?
Presence of Alternative Printing Technology.
8. Can you provide examples of recent developments in the market?
April 2022 - FUJIFILM Corporation announced that it had completed the acquisition of a dedicated cell therapy manufacturing facility from Atara Biotherapeutics Inc. The facility, located in Thousand Oaks, California, will be operated as part of FUJIFILM DiosynthBiotechnologies' global network, a subsidiary of FUJIFILM Corporation and a world-leading contract development and manufacturing organization (CDMO).
9. What pricing options are available for accessing the report?
Pricing options include single-user, multi-user, and enterprise licenses priced at USD 4750, USD 5250, and USD 8750 respectively.
10. Is the market size provided in terms of value or volume?
The market size is provided in terms of value, measured in Million.
11. Are there any specific market keywords associated with the report?
Yes, the market keyword associated with the report is "Biologics CDMO Market," which aids in identifying and referencing the specific market segment covered.
12. How do I determine which pricing option suits my needs best?
The pricing options vary based on user requirements and access needs. Individual users may opt for single-user licenses, while businesses requiring broader access may choose multi-user or enterprise licenses for cost-effective access to the report.
13. Are there any additional resources or data provided in the Biologics CDMO Market report?
While the report offers comprehensive insights, it's advisable to review the specific contents or supplementary materials provided to ascertain if additional resources or data are available.
14. How can I stay updated on further developments or reports in the Biologics CDMO Market?
To stay informed about further developments, trends, and reports in the Biologics CDMO Market, consider subscribing to industry newsletters, following relevant companies and organizations, or regularly checking reputable industry news sources and publications.
Methodology
Step 1 - Identification of Relevant Samples Size from Population Database


Step 2 - Approaches for Defining Global Market Size (Value, Volume* & Price*)

Note*: In applicable scenarios
Step 3 - Data Sources
Primary Research
- Web Analytics
- Survey Reports
- Research Institute
- Latest Research Reports
- Opinion Leaders
Secondary Research
- Annual Reports
- White Paper
- Latest Press Release
- Industry Association
- Paid Database
- Investor Presentations

Step 4 - Data Triangulation
Involves using different sources of information in order to increase the validity of a study
These sources are likely to be stakeholders in a program - participants, other researchers, program staff, other community members, and so on.
Then we put all data in single framework & apply various statistical tools to find out the dynamic on the market.
During the analysis stage, feedback from the stakeholder groups would be compared to determine areas of agreement as well as areas of divergence