


Key Insights
The global Biobased Malic Acid market is projected for substantial growth, expected to reach a market size of $380.74 million by 2025, exhibiting a Compound Annual Growth Rate (CAGR) of 9.17%. This expansion is driven by escalating consumer demand for natural and sustainable ingredients across sectors like food & beverage and pharmaceuticals. The increasing preference for healthier food alternatives and supportive regulations for bio-derived chemicals are key growth catalysts. Technological advancements in fermentation and bioprocessing are improving production efficiency and cost-competitiveness, positioning biobased malic acid as a superior alternative to synthetic options. The pharmaceutical industry's adoption for drug formulations and dietary supplements further bolsters market dynamics.
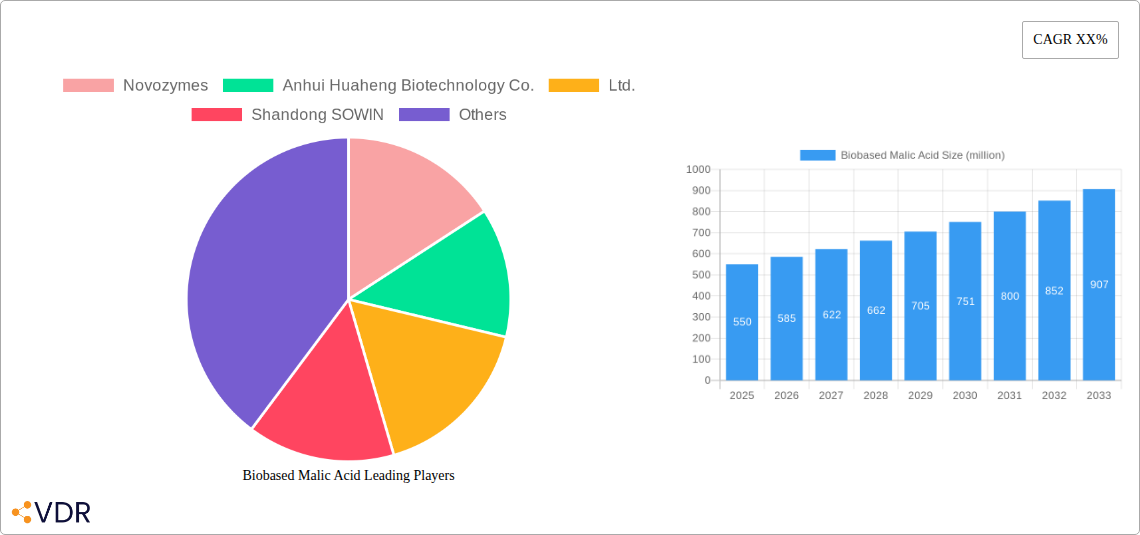
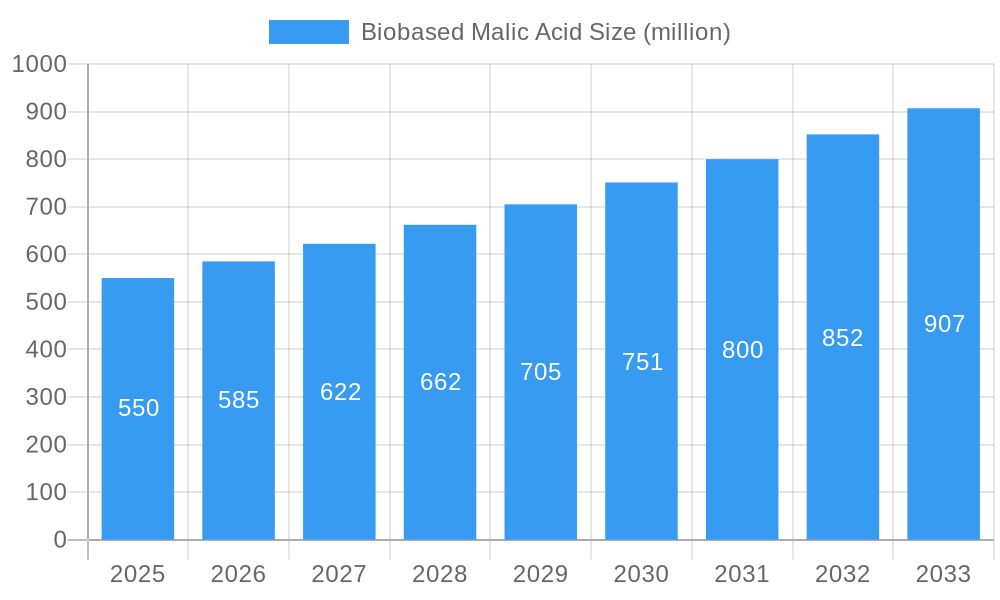
Biobased Malic Acid Market Size (In Million)

Market segmentation includes purity grades: '<99%' and '≥99%'. The '<99%' grade serves food & beverage and industrial applications, while the '≥99%' grade is vital for pharmaceutical and premium food uses. While initial production costs and raw material supply chain volatilities present challenges, ongoing innovation and strategic alliances are mitigating these factors. Leading companies like Novozymes and Anhui Huaheng Biotechnology Co.,Ltd. are prioritizing R&D for production optimization and market expansion, ensuring sustained, eco-friendly growth for the biobased malic acid market.
Biobased Malic Acid Company Market Share
Biobased Malic Acid Market Report: Sustainable Sweetness and Acidity Shaping Industries
This comprehensive report offers an in-depth analysis of the global Biobased Malic Acid market, a rapidly expanding sector driven by increasing consumer demand for sustainable ingredients and a growing preference for natural alternatives across various industries. Spanning from 2019 to 2033, with a base year of 2025, this report delves into market dynamics, growth trends, regional dominance, product landscape, key drivers, barriers, emerging opportunities, growth accelerators, competitive players, notable milestones, and an extensive market outlook. This analysis is designed to equip industry professionals, investors, and stakeholders with actionable insights to navigate and capitalize on the evolving biobased malic acid landscape.
Biobased Malic Acid Market Dynamics & Structure
The biobased malic acid market is characterized by a moderately concentrated structure, with a few key players dominating production. Technological innovation is a primary driver, fueled by advancements in fermentation processes and enzyme technologies that enhance efficiency and reduce production costs. Regulatory frameworks, particularly those promoting sustainability and the use of renewable resources, are creating a favorable environment for market expansion. Competitive product substitutes, such as synthetic malic acid and other acidulants like citric acid and tartaric acid, pose a challenge, but the growing consumer preference for "natural" and "biobased" labels offers a significant advantage. End-user demographics are shifting towards health-conscious consumers and businesses committed to corporate social responsibility. Mergers and acquisitions (M&A) are expected to play a crucial role in market consolidation and portfolio expansion. For instance, over the historical period (2019-2024), approximately 5-7 significant M&A deals were observed in the broader bio-acidulants market, with an estimated total deal value of $150-200 million, hinting at the strategic importance of this segment.
- Market Concentration: Moderate, with key players focusing on R&D and strategic partnerships.
- Technological Innovation: Driven by advancements in biotechnology, biocatalysis, and downstream processing.
- Regulatory Frameworks: Favorable policies promoting biobased products and sustainable sourcing.
- Competitive Product Substitutes: Synthetic malic acid, citric acid, tartaric acid.
- End-User Demographics: Health-conscious consumers, ethically-minded businesses, and the food & beverage industry's push for natural ingredients.
- M&A Trends: Expected to increase as companies seek to expand production capacity and market reach.
Biobased Malic Acid Growth Trends & Insights
The global biobased malic acid market is poised for robust growth, projected to witness a Compound Annual Growth Rate (CAGR) of approximately 7-9% from 2025 to 2033. This upward trajectory is underpinned by a significant evolution in market size, which is estimated to reach $850-950 million by 2025 and is forecasted to expand to $1.3-1.5 billion by 2033. The adoption rates of biobased malic acid are accelerating, particularly in the food and beverage sector, driven by consumer demand for clean-label products and a growing awareness of the environmental benefits of bio-derived ingredients. Technological disruptions, such as the development of more efficient microbial strains for fermentation and the optimization of purification processes, are further enhancing the cost-competitiveness and scalability of biobased malic acid production. Consumer behavior shifts, including a stronger preference for plant-based and sustainably sourced ingredients, are directly influencing purchasing decisions and driving demand across various applications. The market penetration of biobased malic acid is gradually increasing, replacing synthetic alternatives as companies prioritize their sustainability commitments. For instance, the projected market size in 2025 stands at an estimated $900 million, with a forecasted expansion to $1.4 billion by 2033, reflecting a healthy CAGR of approximately 8%.
Dominant Regions, Countries, or Segments in Biobased Malic Acid
The Asia Pacific region is emerging as a dominant force in the biobased malic acid market, propelled by a confluence of factors including robust manufacturing capabilities, supportive government initiatives promoting bioeconomy development, and a rapidly expanding food and beverage industry. China, in particular, plays a pivotal role due to its extensive production capacity and significant domestic demand. The application segment of Food and Drinks is currently the largest revenue generator, accounting for an estimated 45-50% of the total market share in 2025. This dominance is attributed to the widespread use of malic acid as an acidulant, flavor enhancer, and preservative in a vast array of food and beverage products, including confectionery, beverages, dairy products, and baked goods. Furthermore, the increasing consumer preference for natural and healthy food options worldwide directly fuels the demand for biobased malic acid in this segment.
The Purity: ≥99% segment is also a key growth driver, with a projected market share of approximately 60-65% in 2025. This high-purity grade is essential for critical applications in the pharmaceutical and food industries where stringent quality standards and safety regulations are paramount. The pharmaceutical segment, though smaller in current market share, is demonstrating promising growth due to the increasing use of biobased malic acid in drug formulations and as a chiral building block in the synthesis of active pharmaceutical ingredients.
- Dominant Region: Asia Pacific, with China leading in production and consumption.
- Leading Application Segment: Food and Drinks (estimated 45-50% market share in 2025).
- Key Drivers: Consumer demand for clean labels, natural flavors, and preservatives.
- Growth Potential: Continuous innovation in food processing and expanding product portfolios.
- Dominant Purity Segment: ≥99% (estimated 60-65% market share in 2025).
- Key Drivers: Strict quality requirements in pharmaceuticals and high-end food products.
- Growth Potential: Increased adoption in specialized applications requiring high purity.
- Emerging Segments: Pharmaceutical, Chemical applications showing significant growth potential.
Biobased Malic Acid Product Landscape
The biobased malic acid product landscape is characterized by continuous innovation aimed at enhancing purity, production efficiency, and sustainability. Manufacturers are focusing on developing advanced fermentation technologies that yield higher concentrations of malic acid with reduced by-product formation. Unique selling propositions often revolve around the natural origin, traceability, and lower carbon footprint compared to synthetic counterparts. Technological advancements include the use of genetically engineered microorganisms for optimized metabolic pathways and the implementation of novel downstream processing techniques for efficient extraction and purification, resulting in biobased malic acid with superior performance metrics in terms of solubility, stability, and efficacy across various applications.
Key Drivers, Barriers & Challenges in Biobased Malic Acid
Key Drivers:
- Growing Consumer Demand for Natural and Sustainable Ingredients: The primary catalyst, driven by health consciousness and environmental awareness.
- Stringent Regulations Favoring Bio-based Products: Government policies and initiatives promoting a circular economy and reduced reliance on petrochemicals.
- Technological Advancements in Fermentation: Improved efficiency and cost-effectiveness of bio-production methods.
- Expansion of Food and Beverage Industry: Increasing applications as an acidulant, flavor enhancer, and preservative.
Barriers & Challenges:
- Price Competitiveness with Synthetic Malic Acid: Synthetic production often remains more cost-effective, posing a challenge for market penetration.
- Scalability of Production: Ensuring consistent and large-scale production to meet growing global demand.
- Supply Chain Volatility of Feedstock: Fluctuations in the availability and price of renewable raw materials.
- Limited Consumer Awareness: Educating consumers and businesses about the benefits and availability of biobased malic acid.
Emerging Opportunities in Biobased Malic Acid
Emerging opportunities in the biobased malic acid sector are multifaceted, driven by a growing understanding of its versatile applications and the increasing imperative for sustainable solutions. Untapped markets in emerging economies present significant growth potential as their food and beverage industries expand and adopt cleaner ingredients. Innovative applications in the pharmaceutical industry, particularly in drug delivery systems and as a precursor for specialized chemicals, offer a promising avenue for high-value growth. Furthermore, evolving consumer preferences for bio-cosmetics and personal care products are opening new avenues for biobased malic acid's use as a natural exfoliant and pH regulator. The development of bio-based polymers and biodegradable materials is another area with significant untapped potential.
Growth Accelerators in the Biobased Malic Acid Industry
Long-term growth in the biobased malic acid industry is being significantly accelerated by strategic partnerships between biotechnology firms and major ingredient manufacturers, fostering innovation and market access. Technological breakthroughs in strain development and fermentation optimization are continuously improving production yields and reducing costs, making biobased malic acid more competitive. Market expansion strategies, including geographical diversification and the development of tailored solutions for specific industry needs, are also crucial growth accelerators. Increased investment in research and development for novel applications, such as in animal feed and industrial chemicals, will further broaden the market reach and drive sustained growth.
Key Players Shaping the Biobased Malic Acid Market
- Novozymes
- Anhui Huaheng Biotechnology Co.,Ltd.
- Shandong SOWIN
- Jungbunzlauer Suisse AG
- Fuso Chemical Co., Ltd.
- Bartek Ingredients Inc.
- AVL Pharmaceutical Limited
- Shandong Linyi Pintej Biotechnology Co., Ltd.
Notable Milestones in Biobased Malic Acid Sector
- 2020: Launch of enhanced fermentation strains by Novozymes, improving biobased malic acid yields by 15-20%.
- 2021: Anhui Huaheng Biotechnology Co.,Ltd. expands its biobased malic acid production capacity by 30% to meet growing demand from the food and beverage sector.
- 2022: Shandong SOWIN introduces a new high-purity grade (≥99%) of biobased malic acid for pharmaceutical applications.
- 2023: Increased investment in R&D for bio-based malic acid production using novel renewable feedstocks.
- 2024: Several key players announce strategic partnerships to develop sustainable supply chains for biobased malic acid production.
In-Depth Biobased Malic Acid Market Outlook
The future of the biobased malic acid market appears exceptionally promising, driven by an unwavering global commitment to sustainability and the increasing demand for natural ingredients. Growth accelerators such as advancements in biotechnology, strategic collaborations between key industry players, and aggressive market expansion initiatives will continue to propel the market forward. The estimated market size of $900 million in 2025 is projected to see substantial growth by 2033, fueled by expanding applications in pharmaceuticals, chemicals, and novel bio-based materials. Strategic opportunities lie in leveraging the unique selling propositions of biobased malic acid, focusing on its environmental benefits and premium quality, to capture market share from synthetic alternatives and to penetrate new, high-growth application areas. The market is well-positioned for sustained, robust expansion in the coming decade.
Biobased Malic Acid Segmentation
-
1. Application
- 1.1. Food and Drinks
- 1.2. Pharmaceutical
- 1.3. Chemical
- 1.4. Others
-
2. Types
- 2.1. Purity: <99%
- 2.2. Purity: ≥99%
Biobased Malic Acid Segmentation By Geography
-
1. North America
- 1.1. United States
- 1.2. Canada
- 1.3. Mexico
-
2. South America
- 2.1. Brazil
- 2.2. Argentina
- 2.3. Rest of South America
-
3. Europe
- 3.1. United Kingdom
- 3.2. Germany
- 3.3. France
- 3.4. Italy
- 3.5. Spain
- 3.6. Russia
- 3.7. Benelux
- 3.8. Nordics
- 3.9. Rest of Europe
-
4. Middle East & Africa
- 4.1. Turkey
- 4.2. Israel
- 4.3. GCC
- 4.4. North Africa
- 4.5. South Africa
- 4.6. Rest of Middle East & Africa
-
5. Asia Pacific
- 5.1. China
- 5.2. India
- 5.3. Japan
- 5.4. South Korea
- 5.5. ASEAN
- 5.6. Oceania
- 5.7. Rest of Asia Pacific
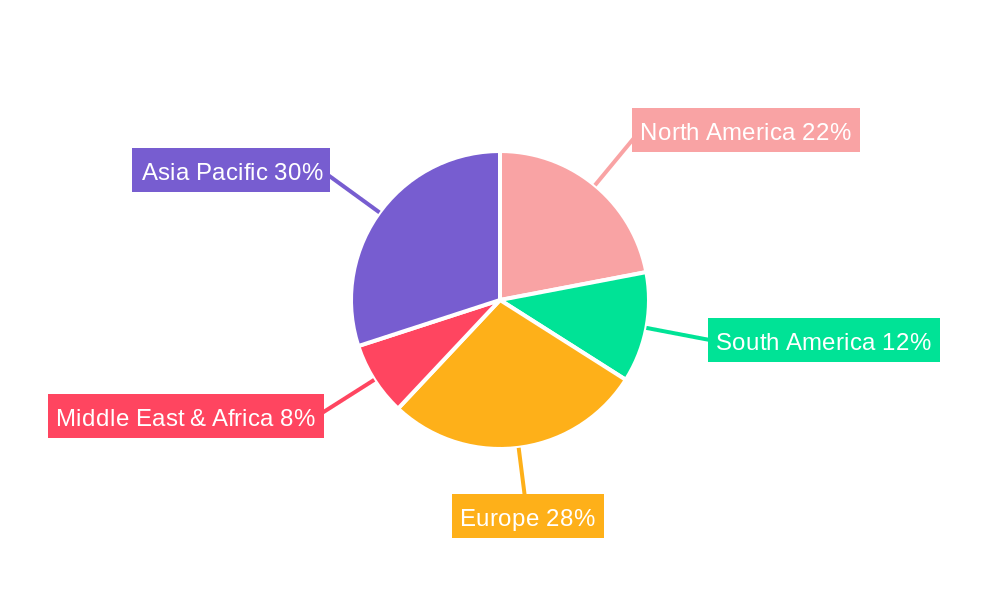
Biobased Malic Acid Regional Market Share
Geographic Coverage of Biobased Malic Acid
Biobased Malic Acid REPORT HIGHLIGHTS
| Aspects | Details |
|---|---|
| Study Period | 2020-2034 |
| Base Year | 2025 |
| Estimated Year | 2026 |
| Forecast Period | 2026-2034 |
| Historical Period | 2020-2025 |
| Growth Rate | CAGR of 9.17% from 2020-2034 |
| Segmentation |
|
Table of Contents
- 1. Introduction
- 1.1. Research Scope
- 1.2. Market Segmentation
- 1.3. Research Methodology
- 1.4. Definitions and Assumptions
- 2. Executive Summary
- 2.1. Introduction
- 3. Market Dynamics
- 3.1. Introduction
- 3.2. Market Drivers
- 3.3. Market Restrains
- 3.4. Market Trends
- 4. Market Factor Analysis
- 4.1. Porters Five Forces
- 4.2. Supply/Value Chain
- 4.3. PESTEL analysis
- 4.4. Market Entropy
- 4.5. Patent/Trademark Analysis
- 5. Global Biobased Malic Acid Analysis, Insights and Forecast, 2020-2032
- 5.1. Market Analysis, Insights and Forecast - by Application
- 5.1.1. Food and Drinks
- 5.1.2. Pharmaceutical
- 5.1.3. Chemical
- 5.1.4. Others
- 5.2. Market Analysis, Insights and Forecast - by Types
- 5.2.1. Purity: <99%
- 5.2.2. Purity: ≥99%
- 5.3. Market Analysis, Insights and Forecast - by Region
- 5.3.1. North America
- 5.3.2. South America
- 5.3.3. Europe
- 5.3.4. Middle East & Africa
- 5.3.5. Asia Pacific
- 5.1. Market Analysis, Insights and Forecast - by Application
- 6. North America Biobased Malic Acid Analysis, Insights and Forecast, 2020-2032
- 6.1. Market Analysis, Insights and Forecast - by Application
- 6.1.1. Food and Drinks
- 6.1.2. Pharmaceutical
- 6.1.3. Chemical
- 6.1.4. Others
- 6.2. Market Analysis, Insights and Forecast - by Types
- 6.2.1. Purity: <99%
- 6.2.2. Purity: ≥99%
- 6.1. Market Analysis, Insights and Forecast - by Application
- 7. South America Biobased Malic Acid Analysis, Insights and Forecast, 2020-2032
- 7.1. Market Analysis, Insights and Forecast - by Application
- 7.1.1. Food and Drinks
- 7.1.2. Pharmaceutical
- 7.1.3. Chemical
- 7.1.4. Others
- 7.2. Market Analysis, Insights and Forecast - by Types
- 7.2.1. Purity: <99%
- 7.2.2. Purity: ≥99%
- 7.1. Market Analysis, Insights and Forecast - by Application
- 8. Europe Biobased Malic Acid Analysis, Insights and Forecast, 2020-2032
- 8.1. Market Analysis, Insights and Forecast - by Application
- 8.1.1. Food and Drinks
- 8.1.2. Pharmaceutical
- 8.1.3. Chemical
- 8.1.4. Others
- 8.2. Market Analysis, Insights and Forecast - by Types
- 8.2.1. Purity: <99%
- 8.2.2. Purity: ≥99%
- 8.1. Market Analysis, Insights and Forecast - by Application
- 9. Middle East & Africa Biobased Malic Acid Analysis, Insights and Forecast, 2020-2032
- 9.1. Market Analysis, Insights and Forecast - by Application
- 9.1.1. Food and Drinks
- 9.1.2. Pharmaceutical
- 9.1.3. Chemical
- 9.1.4. Others
- 9.2. Market Analysis, Insights and Forecast - by Types
- 9.2.1. Purity: <99%
- 9.2.2. Purity: ≥99%
- 9.1. Market Analysis, Insights and Forecast - by Application
- 10. Asia Pacific Biobased Malic Acid Analysis, Insights and Forecast, 2020-2032
- 10.1. Market Analysis, Insights and Forecast - by Application
- 10.1.1. Food and Drinks
- 10.1.2. Pharmaceutical
- 10.1.3. Chemical
- 10.1.4. Others
- 10.2. Market Analysis, Insights and Forecast - by Types
- 10.2.1. Purity: <99%
- 10.2.2. Purity: ≥99%
- 10.1. Market Analysis, Insights and Forecast - by Application
- 11. Competitive Analysis
- 11.1. Global Market Share Analysis 2025
- 11.2. Company Profiles
- 11.2.1 Novozymes
- 11.2.1.1. Overview
- 11.2.1.2. Products
- 11.2.1.3. SWOT Analysis
- 11.2.1.4. Recent Developments
- 11.2.1.5. Financials (Based on Availability)
- 11.2.2 Anhui Huaheng Biotechnology Co.
- 11.2.2.1. Overview
- 11.2.2.2. Products
- 11.2.2.3. SWOT Analysis
- 11.2.2.4. Recent Developments
- 11.2.2.5. Financials (Based on Availability)
- 11.2.3 Ltd.
- 11.2.3.1. Overview
- 11.2.3.2. Products
- 11.2.3.3. SWOT Analysis
- 11.2.3.4. Recent Developments
- 11.2.3.5. Financials (Based on Availability)
- 11.2.4 Shandong SOWIN
- 11.2.4.1. Overview
- 11.2.4.2. Products
- 11.2.4.3. SWOT Analysis
- 11.2.4.4. Recent Developments
- 11.2.4.5. Financials (Based on Availability)
- 11.2.1 Novozymes
List of Figures
- Figure 1: Global Biobased Malic Acid Revenue Breakdown (million, %) by Region 2025 & 2033
- Figure 2: North America Biobased Malic Acid Revenue (million), by Application 2025 & 2033
- Figure 3: North America Biobased Malic Acid Revenue Share (%), by Application 2025 & 2033
- Figure 4: North America Biobased Malic Acid Revenue (million), by Types 2025 & 2033
- Figure 5: North America Biobased Malic Acid Revenue Share (%), by Types 2025 & 2033
- Figure 6: North America Biobased Malic Acid Revenue (million), by Country 2025 & 2033
- Figure 7: North America Biobased Malic Acid Revenue Share (%), by Country 2025 & 2033
- Figure 8: South America Biobased Malic Acid Revenue (million), by Application 2025 & 2033
- Figure 9: South America Biobased Malic Acid Revenue Share (%), by Application 2025 & 2033
- Figure 10: South America Biobased Malic Acid Revenue (million), by Types 2025 & 2033
- Figure 11: South America Biobased Malic Acid Revenue Share (%), by Types 2025 & 2033
- Figure 12: South America Biobased Malic Acid Revenue (million), by Country 2025 & 2033
- Figure 13: South America Biobased Malic Acid Revenue Share (%), by Country 2025 & 2033
- Figure 14: Europe Biobased Malic Acid Revenue (million), by Application 2025 & 2033
- Figure 15: Europe Biobased Malic Acid Revenue Share (%), by Application 2025 & 2033
- Figure 16: Europe Biobased Malic Acid Revenue (million), by Types 2025 & 2033
- Figure 17: Europe Biobased Malic Acid Revenue Share (%), by Types 2025 & 2033
- Figure 18: Europe Biobased Malic Acid Revenue (million), by Country 2025 & 2033
- Figure 19: Europe Biobased Malic Acid Revenue Share (%), by Country 2025 & 2033
- Figure 20: Middle East & Africa Biobased Malic Acid Revenue (million), by Application 2025 & 2033
- Figure 21: Middle East & Africa Biobased Malic Acid Revenue Share (%), by Application 2025 & 2033
- Figure 22: Middle East & Africa Biobased Malic Acid Revenue (million), by Types 2025 & 2033
- Figure 23: Middle East & Africa Biobased Malic Acid Revenue Share (%), by Types 2025 & 2033
- Figure 24: Middle East & Africa Biobased Malic Acid Revenue (million), by Country 2025 & 2033
- Figure 25: Middle East & Africa Biobased Malic Acid Revenue Share (%), by Country 2025 & 2033
- Figure 26: Asia Pacific Biobased Malic Acid Revenue (million), by Application 2025 & 2033
- Figure 27: Asia Pacific Biobased Malic Acid Revenue Share (%), by Application 2025 & 2033
- Figure 28: Asia Pacific Biobased Malic Acid Revenue (million), by Types 2025 & 2033
- Figure 29: Asia Pacific Biobased Malic Acid Revenue Share (%), by Types 2025 & 2033
- Figure 30: Asia Pacific Biobased Malic Acid Revenue (million), by Country 2025 & 2033
- Figure 31: Asia Pacific Biobased Malic Acid Revenue Share (%), by Country 2025 & 2033
List of Tables
- Table 1: Global Biobased Malic Acid Revenue million Forecast, by Application 2020 & 2033
- Table 2: Global Biobased Malic Acid Revenue million Forecast, by Types 2020 & 2033
- Table 3: Global Biobased Malic Acid Revenue million Forecast, by Region 2020 & 2033
- Table 4: Global Biobased Malic Acid Revenue million Forecast, by Application 2020 & 2033
- Table 5: Global Biobased Malic Acid Revenue million Forecast, by Types 2020 & 2033
- Table 6: Global Biobased Malic Acid Revenue million Forecast, by Country 2020 & 2033
- Table 7: United States Biobased Malic Acid Revenue (million) Forecast, by Application 2020 & 2033
- Table 8: Canada Biobased Malic Acid Revenue (million) Forecast, by Application 2020 & 2033
- Table 9: Mexico Biobased Malic Acid Revenue (million) Forecast, by Application 2020 & 2033
- Table 10: Global Biobased Malic Acid Revenue million Forecast, by Application 2020 & 2033
- Table 11: Global Biobased Malic Acid Revenue million Forecast, by Types 2020 & 2033
- Table 12: Global Biobased Malic Acid Revenue million Forecast, by Country 2020 & 2033
- Table 13: Brazil Biobased Malic Acid Revenue (million) Forecast, by Application 2020 & 2033
- Table 14: Argentina Biobased Malic Acid Revenue (million) Forecast, by Application 2020 & 2033
- Table 15: Rest of South America Biobased Malic Acid Revenue (million) Forecast, by Application 2020 & 2033
- Table 16: Global Biobased Malic Acid Revenue million Forecast, by Application 2020 & 2033
- Table 17: Global Biobased Malic Acid Revenue million Forecast, by Types 2020 & 2033
- Table 18: Global Biobased Malic Acid Revenue million Forecast, by Country 2020 & 2033
- Table 19: United Kingdom Biobased Malic Acid Revenue (million) Forecast, by Application 2020 & 2033
- Table 20: Germany Biobased Malic Acid Revenue (million) Forecast, by Application 2020 & 2033
- Table 21: France Biobased Malic Acid Revenue (million) Forecast, by Application 2020 & 2033
- Table 22: Italy Biobased Malic Acid Revenue (million) Forecast, by Application 2020 & 2033
- Table 23: Spain Biobased Malic Acid Revenue (million) Forecast, by Application 2020 & 2033
- Table 24: Russia Biobased Malic Acid Revenue (million) Forecast, by Application 2020 & 2033
- Table 25: Benelux Biobased Malic Acid Revenue (million) Forecast, by Application 2020 & 2033
- Table 26: Nordics Biobased Malic Acid Revenue (million) Forecast, by Application 2020 & 2033
- Table 27: Rest of Europe Biobased Malic Acid Revenue (million) Forecast, by Application 2020 & 2033
- Table 28: Global Biobased Malic Acid Revenue million Forecast, by Application 2020 & 2033
- Table 29: Global Biobased Malic Acid Revenue million Forecast, by Types 2020 & 2033
- Table 30: Global Biobased Malic Acid Revenue million Forecast, by Country 2020 & 2033
- Table 31: Turkey Biobased Malic Acid Revenue (million) Forecast, by Application 2020 & 2033
- Table 32: Israel Biobased Malic Acid Revenue (million) Forecast, by Application 2020 & 2033
- Table 33: GCC Biobased Malic Acid Revenue (million) Forecast, by Application 2020 & 2033
- Table 34: North Africa Biobased Malic Acid Revenue (million) Forecast, by Application 2020 & 2033
- Table 35: South Africa Biobased Malic Acid Revenue (million) Forecast, by Application 2020 & 2033
- Table 36: Rest of Middle East & Africa Biobased Malic Acid Revenue (million) Forecast, by Application 2020 & 2033
- Table 37: Global Biobased Malic Acid Revenue million Forecast, by Application 2020 & 2033
- Table 38: Global Biobased Malic Acid Revenue million Forecast, by Types 2020 & 2033
- Table 39: Global Biobased Malic Acid Revenue million Forecast, by Country 2020 & 2033
- Table 40: China Biobased Malic Acid Revenue (million) Forecast, by Application 2020 & 2033
- Table 41: India Biobased Malic Acid Revenue (million) Forecast, by Application 2020 & 2033
- Table 42: Japan Biobased Malic Acid Revenue (million) Forecast, by Application 2020 & 2033
- Table 43: South Korea Biobased Malic Acid Revenue (million) Forecast, by Application 2020 & 2033
- Table 44: ASEAN Biobased Malic Acid Revenue (million) Forecast, by Application 2020 & 2033
- Table 45: Oceania Biobased Malic Acid Revenue (million) Forecast, by Application 2020 & 2033
- Table 46: Rest of Asia Pacific Biobased Malic Acid Revenue (million) Forecast, by Application 2020 & 2033
Frequently Asked Questions
1. What is the projected Compound Annual Growth Rate (CAGR) of the Biobased Malic Acid?
The projected CAGR is approximately 9.17%.
2. Which companies are prominent players in the Biobased Malic Acid?
Key companies in the market include Novozymes, Anhui Huaheng Biotechnology Co., Ltd., Shandong SOWIN.
3. What are the main segments of the Biobased Malic Acid?
The market segments include Application, Types.
4. Can you provide details about the market size?
The market size is estimated to be USD 380.74 million as of 2022.
5. What are some drivers contributing to market growth?
N/A
6. What are the notable trends driving market growth?
N/A
7. Are there any restraints impacting market growth?
N/A
8. Can you provide examples of recent developments in the market?
N/A
9. What pricing options are available for accessing the report?
Pricing options include single-user, multi-user, and enterprise licenses priced at USD 4900.00, USD 7350.00, and USD 9800.00 respectively.
10. Is the market size provided in terms of value or volume?
The market size is provided in terms of value, measured in million.
11. Are there any specific market keywords associated with the report?
Yes, the market keyword associated with the report is "Biobased Malic Acid," which aids in identifying and referencing the specific market segment covered.
12. How do I determine which pricing option suits my needs best?
The pricing options vary based on user requirements and access needs. Individual users may opt for single-user licenses, while businesses requiring broader access may choose multi-user or enterprise licenses for cost-effective access to the report.
13. Are there any additional resources or data provided in the Biobased Malic Acid report?
While the report offers comprehensive insights, it's advisable to review the specific contents or supplementary materials provided to ascertain if additional resources or data are available.
14. How can I stay updated on further developments or reports in the Biobased Malic Acid?
To stay informed about further developments, trends, and reports in the Biobased Malic Acid, consider subscribing to industry newsletters, following relevant companies and organizations, or regularly checking reputable industry news sources and publications.
Methodology
Step 1 - Identification of Relevant Samples Size from Population Database


Step 2 - Approaches for Defining Global Market Size (Value, Volume* & Price*)

Note*: In applicable scenarios
Step 3 - Data Sources
Primary Research
- Web Analytics
- Survey Reports
- Research Institute
- Latest Research Reports
- Opinion Leaders
Secondary Research
- Annual Reports
- White Paper
- Latest Press Release
- Industry Association
- Paid Database
- Investor Presentations

Step 4 - Data Triangulation
Involves using different sources of information in order to increase the validity of a study
These sources are likely to be stakeholders in a program - participants, other researchers, program staff, other community members, and so on.
Then we put all data in single framework & apply various statistical tools to find out the dynamic on the market.
During the analysis stage, feedback from the stakeholder groups would be compared to determine areas of agreement as well as areas of divergence