
Key Insights
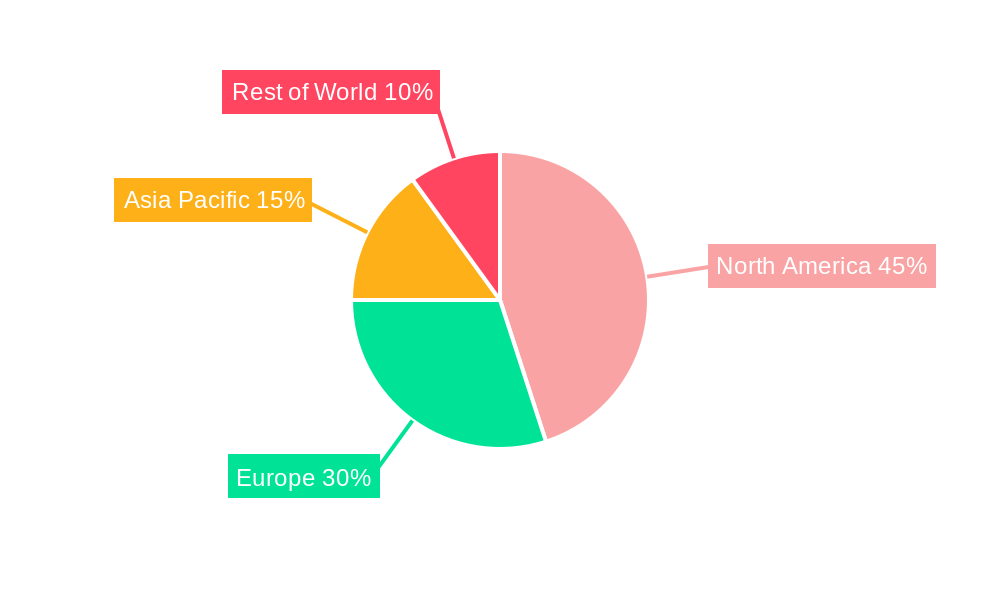
The biosimulation market is experiencing robust growth, driven by the increasing need for efficient and cost-effective drug discovery and development processes within the pharmaceutical and biotechnology industries. A compound annual growth rate (CAGR) of 10% from 2019 to 2024 suggests a significant market expansion, and this momentum is expected to continue through 2033. The market's segmentation reflects its diverse applications, with software and services playing crucial roles across preclinical and clinical drug development, drug discovery, and other related areas. Pharmaceutical and biotechnology companies, along with contract research organizations (CROs), are the primary end-users, highlighting the industry's reliance on these technologies for improved R&D outcomes. The substantial investment in R&D by major pharmaceutical players further fuels this market growth. Geographic distribution shows a strong presence in North America and Europe, reflecting established pharmaceutical hubs and advanced research infrastructure. However, the Asia-Pacific region is poised for significant expansion, fueled by growing investments in healthcare and biopharmaceutical research within countries like China and India. This growth reflects the increasing adoption of biosimulation to optimize drug development timelines and reduce overall costs associated with traditional methods.
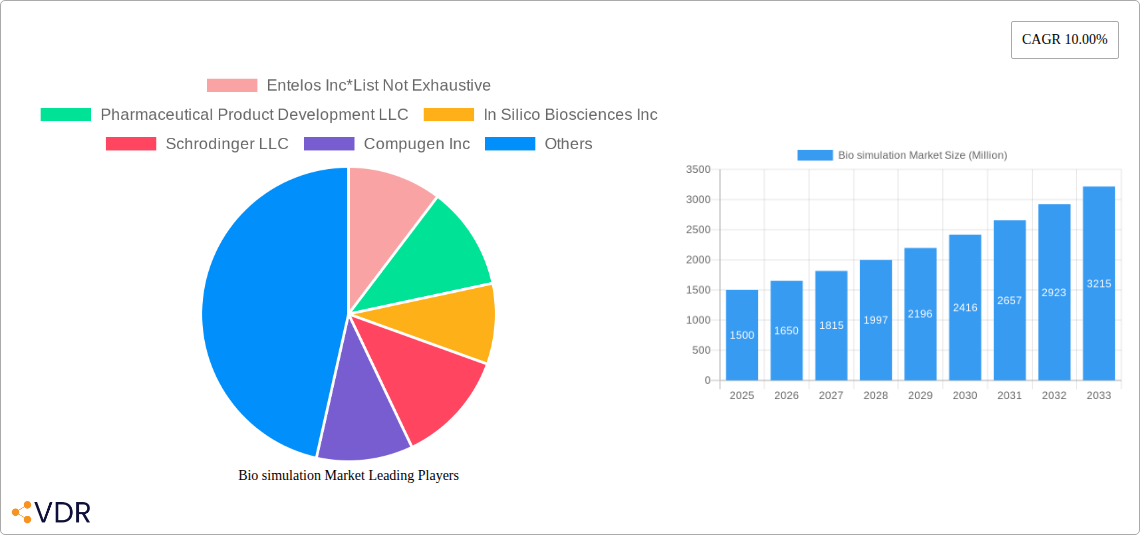
The competitive landscape is characterized by a mix of established players and emerging companies. Leading players like Entelos, Pharmaceutical Product Development, In Silico Biosciences, Schrödinger, and others are continually innovating to provide advanced software and services. The market's growth is further propelled by advancements in computational power, improved algorithms, and the increasing availability of large biological datasets. Regulatory pressures to streamline drug development processes and enhance patient safety also incentivize the adoption of biosimulation tools. While challenges remain, such as the need for data standardization and validation, the overall trajectory points towards continued expansion driven by the inherent efficiency and cost savings biosimulation offers the pharmaceutical and biotechnology sectors. Future growth will likely be shaped by technological advancements, increased collaborations between stakeholders, and the growing demand for personalized medicine.
Biosimulation Market Report: 2019-2033 Forecast
This comprehensive report provides an in-depth analysis of the Biosimulation Market, encompassing market dynamics, growth trends, regional analysis, product landscape, key players, and future outlook. The study period covers 2019-2033, with a base year of 2025 and a forecast period of 2025-2033. This report is invaluable for pharmaceutical companies, biotech firms, CROs, investors, and anyone seeking to understand this rapidly evolving market. The market is segmented by product (Software, Services), application (Preclinical and Clinical Drug Development, Drug Discovery, Others), and end-user (Pharmaceutical and Biotechnology Companies, Contract Research Organizations, Others).
Biosimulation Market Market Dynamics & Structure
The biosimulation market is characterized by a moderately concentrated landscape with a few major players holding significant market share. Technological innovation, particularly in AI and machine learning, is a key driver, while regulatory frameworks influence adoption rates. Competitive pressures arise from both established players and emerging startups. The market experiences consistent M&A activity, reflecting industry consolidation and the pursuit of synergistic capabilities.
- Market Concentration: The top 5 players hold approximately xx% of the market share in 2025.
- Technological Innovation: AI and machine learning are driving advancements in predictive modeling and simulation accuracy.
- Regulatory Landscape: Stringent regulatory approvals influence the time-to-market for new biosimulation solutions.
- Competitive Substitutes: Traditional experimental methods remain a competitive alternative, though biosimulation offers cost and time efficiencies.
- M&A Activity: An estimated xx M&A deals occurred in the biosimulation market between 2019 and 2024.
- Innovation Barriers: High development costs and the need for specialized expertise pose barriers to entry for new players.
Biosimulation Market Growth Trends & Insights
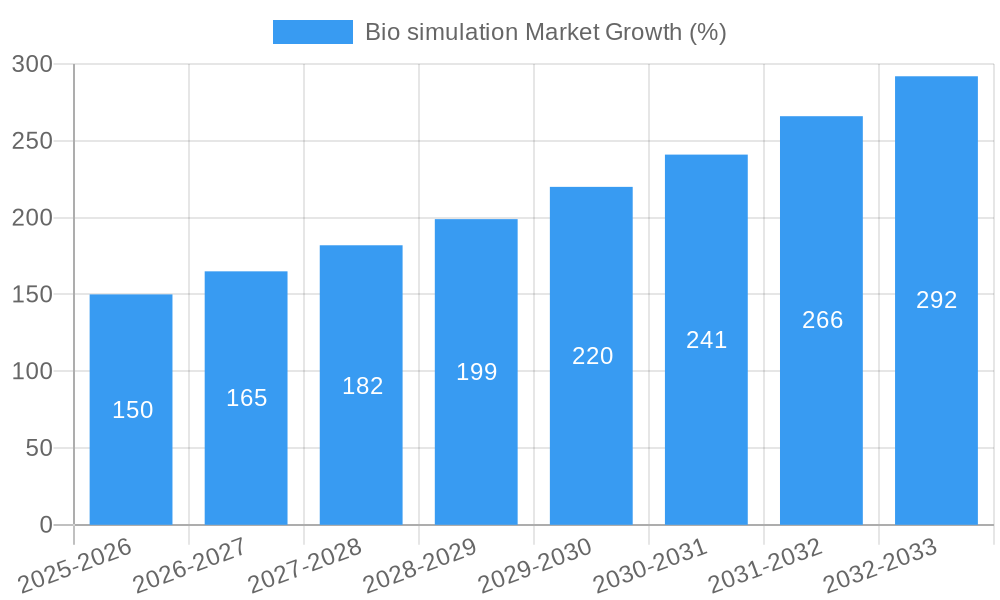
The biosimulation market is experiencing robust growth, driven by increased adoption across the pharmaceutical and biotechnology sectors. The market size reached xx million units in 2024 and is projected to reach xx million units by 2033, exhibiting a CAGR of xx% during the forecast period. This growth is fueled by the rising demand for efficient drug discovery and development processes, coupled with technological advancements that enhance simulation accuracy and predictive power. The market penetration of biosimulation tools is increasing steadily, with higher adoption rates observed in preclinical drug development.
Dominant Regions, Countries, or Segments in Biosimulation Market
North America currently dominates the biosimulation market, followed by Europe and Asia-Pacific. Within the segments, the Software segment holds the largest market share by product, owing to its scalability and ease of integration. Preclinical and Clinical Drug Development is the dominant application segment due to the extensive use of biosimulation in optimizing drug development pipelines. Pharmaceutical and Biotechnology Companies constitute the largest end-user segment due to their need for efficient R&D processes.
- North America Dominance: Strong R&D investments and the presence of major pharmaceutical companies drive market growth in this region.
- Software Segment Leadership: High demand for sophisticated software solutions with advanced features fuels this segment's growth.
- Preclinical Drug Development: The need to minimize risks and optimize drug candidates fuels this segment's dominance.
- Pharmaceutical & Biotech End-users: This segment's growth is driven by the increasing use of biosimulation for streamlining development processes.
- Future Growth Potential: Asia-Pacific is projected to experience significant growth due to rising investments in the life sciences sector.
Biosimulation Market Product Landscape
Biosimulation products are evolving rapidly, incorporating advanced algorithms and integrating diverse data sources. Software solutions offer streamlined workflows and sophisticated analytical capabilities, while services provide specialized expertise and customized solutions. The key selling propositions include improved prediction accuracy, reduced development costs, and faster time-to-market for new drugs. The incorporation of AI/ML enhances predictive capabilities, while cloud-based solutions ensure accessibility and scalability.
Key Drivers, Barriers & Challenges in Biosimulation Market
Key Drivers:
- Increased R&D spending in the pharmaceutical and biotechnology industries.
- Growing demand for efficient drug development processes.
- Advancements in computing power and algorithms.
- Stringent regulatory requirements driving adoption.
Challenges & Restraints:
- High initial investment costs for software and services.
- Complexity of simulations and the need for specialized expertise.
- Data availability and quality limitations.
- Competition from established experimental methods.
- Axx million units market revenue loss is predicted due to supply chain disruptions in 2023.
Emerging Opportunities in Biosimulation Market
- Expansion into personalized medicine and targeted therapies.
- Application of biosimulation in the development of advanced therapies.
- Integration with other technologies such as AI and big data analytics.
- Growing demand for biosimulation services in emerging markets.
Growth Accelerators in the Biosimulation Market Industry
Technological breakthroughs, especially in artificial intelligence and machine learning, are driving market growth. Strategic partnerships between biosimulation companies and pharmaceutical firms accelerate innovation and adoption. Expanding into emerging markets and addressing unmet medical needs further fuels market expansion.
Key Players Shaping the Biosimulation Market Market
- Entelos Inc
- Pharmaceutical Product Development LLC
- In Silico Biosciences Inc
- Schrodinger LLC
- Compugen Inc
- Biovia
- Leadscope Inc
- Certara L P
- Simulations Plus Inc
- Genedata
Notable Milestones in Biosimulation Market Sector
- June 2022: Certara launched a new version of its Immunogenicity (IG), Immuno-Oncology (IO), and Vaccine Simulators.
- April 2021: Applied BioMath launched its first software solution, Applied BioMath Assess.
In-Depth Biosimulation Market Market Outlook
The biosimulation market is poised for continued strong growth, driven by technological advancements, increasing R&D spending, and the rising need for efficient drug development. Strategic partnerships, market expansion into new therapeutic areas, and the development of innovative simulation tools will shape the future of this dynamic market. The market is projected to witness significant expansion across various therapeutic areas, presenting lucrative opportunities for existing players and new entrants.
Bio simulation Market Segmentation
-
1. Product
- 1.1. Software
- 1.2. Services
-
2. Application
- 2.1. Preclinical and Clinical Drug Development
- 2.2. Drug Discovery
- 2.3. Others
-
3. End User
- 3.1. Pharmaceutical and Biotechnology Companies
- 3.2. Contract Research Organizations
- 3.3. Others
Bio simulation Market Segmentation By Geography
-
1. North America
- 1.1. United States
- 1.2. Canada
- 1.3. Mexico
-
2. Europe
- 2.1. Germany
- 2.2. United Kingdom
- 2.3. France
- 2.4. Italy
- 2.5. Spain
- 2.6. Rest of Europe
-
3. Asia Pacific
- 3.1. China
- 3.2. Japan
- 3.3. India
- 3.4. Australia
- 3.5. South Korea
- 3.6. Rest of Asia Pacific
-
4. Middle East and Africa
- 4.1. GCC
- 4.2. South Africa
- 4.3. Rest of Middle East and Africa
-
5. South America
- 5.1. Brazil
- 5.2. Argentina
- 5.3. Rest of South America
Bio simulation Market REPORT HIGHLIGHTS
| Aspects | Details |
|---|---|
| Study Period | 2019-2033 |
| Base Year | 2024 |
| Estimated Year | 2025 |
| Forecast Period | 2025-2033 |
| Historical Period | 2019-2024 |
| Growth Rate | CAGR of 10.00% from 2019-2033 |
| Segmentation |
|
Table of Contents
- 1. Introduction
- 1.1. Research Scope
- 1.2. Market Segmentation
- 1.3. Research Methodology
- 1.4. Definitions and Assumptions
- 2. Executive Summary
- 2.1. Introduction
- 3. Market Dynamics
- 3.1. Introduction
- 3.2. Market Drivers
- 3.2.1. Increasing Healthcare Expenditure; Growing Adoption of Biosimulation Software; High Drug Discovery and Development Costs
- 3.3. Market Restrains
- 3.3.1. Lack of Awareness Among Healthcare Professionals; Lack of Skilled Personnel
- 3.4. Market Trends
- 3.4.1. Software Segment is Expected to Show Significant Growth Over the Forecast Period
- 4. Market Factor Analysis
- 4.1. Porters Five Forces
- 4.2. Supply/Value Chain
- 4.3. PESTEL analysis
- 4.4. Market Entropy
- 4.5. Patent/Trademark Analysis
- 5. Global Bio simulation Market Analysis, Insights and Forecast, 2019-2031
- 5.1. Market Analysis, Insights and Forecast - by Product
- 5.1.1. Software
- 5.1.2. Services
- 5.2. Market Analysis, Insights and Forecast - by Application
- 5.2.1. Preclinical and Clinical Drug Development
- 5.2.2. Drug Discovery
- 5.2.3. Others
- 5.3. Market Analysis, Insights and Forecast - by End User
- 5.3.1. Pharmaceutical and Biotechnology Companies
- 5.3.2. Contract Research Organizations
- 5.3.3. Others
- 5.4. Market Analysis, Insights and Forecast - by Region
- 5.4.1. North America
- 5.4.2. Europe
- 5.4.3. Asia Pacific
- 5.4.4. Middle East and Africa
- 5.4.5. South America
- 5.1. Market Analysis, Insights and Forecast - by Product
- 6. North America Bio simulation Market Analysis, Insights and Forecast, 2019-2031
- 6.1. Market Analysis, Insights and Forecast - by Product
- 6.1.1. Software
- 6.1.2. Services
- 6.2. Market Analysis, Insights and Forecast - by Application
- 6.2.1. Preclinical and Clinical Drug Development
- 6.2.2. Drug Discovery
- 6.2.3. Others
- 6.3. Market Analysis, Insights and Forecast - by End User
- 6.3.1. Pharmaceutical and Biotechnology Companies
- 6.3.2. Contract Research Organizations
- 6.3.3. Others
- 6.1. Market Analysis, Insights and Forecast - by Product
- 7. Europe Bio simulation Market Analysis, Insights and Forecast, 2019-2031
- 7.1. Market Analysis, Insights and Forecast - by Product
- 7.1.1. Software
- 7.1.2. Services
- 7.2. Market Analysis, Insights and Forecast - by Application
- 7.2.1. Preclinical and Clinical Drug Development
- 7.2.2. Drug Discovery
- 7.2.3. Others
- 7.3. Market Analysis, Insights and Forecast - by End User
- 7.3.1. Pharmaceutical and Biotechnology Companies
- 7.3.2. Contract Research Organizations
- 7.3.3. Others
- 7.1. Market Analysis, Insights and Forecast - by Product
- 8. Asia Pacific Bio simulation Market Analysis, Insights and Forecast, 2019-2031
- 8.1. Market Analysis, Insights and Forecast - by Product
- 8.1.1. Software
- 8.1.2. Services
- 8.2. Market Analysis, Insights and Forecast - by Application
- 8.2.1. Preclinical and Clinical Drug Development
- 8.2.2. Drug Discovery
- 8.2.3. Others
- 8.3. Market Analysis, Insights and Forecast - by End User
- 8.3.1. Pharmaceutical and Biotechnology Companies
- 8.3.2. Contract Research Organizations
- 8.3.3. Others
- 8.1. Market Analysis, Insights and Forecast - by Product
- 9. Middle East and Africa Bio simulation Market Analysis, Insights and Forecast, 2019-2031
- 9.1. Market Analysis, Insights and Forecast - by Product
- 9.1.1. Software
- 9.1.2. Services
- 9.2. Market Analysis, Insights and Forecast - by Application
- 9.2.1. Preclinical and Clinical Drug Development
- 9.2.2. Drug Discovery
- 9.2.3. Others
- 9.3. Market Analysis, Insights and Forecast - by End User
- 9.3.1. Pharmaceutical and Biotechnology Companies
- 9.3.2. Contract Research Organizations
- 9.3.3. Others
- 9.1. Market Analysis, Insights and Forecast - by Product
- 10. South America Bio simulation Market Analysis, Insights and Forecast, 2019-2031
- 10.1. Market Analysis, Insights and Forecast - by Product
- 10.1.1. Software
- 10.1.2. Services
- 10.2. Market Analysis, Insights and Forecast - by Application
- 10.2.1. Preclinical and Clinical Drug Development
- 10.2.2. Drug Discovery
- 10.2.3. Others
- 10.3. Market Analysis, Insights and Forecast - by End User
- 10.3.1. Pharmaceutical and Biotechnology Companies
- 10.3.2. Contract Research Organizations
- 10.3.3. Others
- 10.1. Market Analysis, Insights and Forecast - by Product
- 11. North America Bio simulation Market Analysis, Insights and Forecast, 2019-2031
- 11.1. Market Analysis, Insights and Forecast - By Country/Sub-region
- 11.1.1 United States
- 11.1.2 Canada
- 11.1.3 Mexico
- 12. Europe Bio simulation Market Analysis, Insights and Forecast, 2019-2031
- 12.1. Market Analysis, Insights and Forecast - By Country/Sub-region
- 12.1.1 Germany
- 12.1.2 United Kingdom
- 12.1.3 France
- 12.1.4 Italy
- 12.1.5 Spain
- 12.1.6 Rest of Europe
- 13. Asia Pacific Bio simulation Market Analysis, Insights and Forecast, 2019-2031
- 13.1. Market Analysis, Insights and Forecast - By Country/Sub-region
- 13.1.1 China
- 13.1.2 Japan
- 13.1.3 India
- 13.1.4 Australia
- 13.1.5 South Korea
- 13.1.6 Rest of Asia Pacific
- 14. Middle East and Africa Bio simulation Market Analysis, Insights and Forecast, 2019-2031
- 14.1. Market Analysis, Insights and Forecast - By Country/Sub-region
- 14.1.1 GCC
- 14.1.2 South Africa
- 14.1.3 Rest of Middle East and Africa
- 15. South America Bio simulation Market Analysis, Insights and Forecast, 2019-2031
- 15.1. Market Analysis, Insights and Forecast - By Country/Sub-region
- 15.1.1 Brazil
- 15.1.2 Argentina
- 15.1.3 Rest of South America
- 16. Competitive Analysis
- 16.1. Global Market Share Analysis 2024
- 16.2. Company Profiles
- 16.2.1 Entelos Inc*List Not Exhaustive
- 16.2.1.1. Overview
- 16.2.1.2. Products
- 16.2.1.3. SWOT Analysis
- 16.2.1.4. Recent Developments
- 16.2.1.5. Financials (Based on Availability)
- 16.2.2 Pharmaceutical Product Development LLC
- 16.2.2.1. Overview
- 16.2.2.2. Products
- 16.2.2.3. SWOT Analysis
- 16.2.2.4. Recent Developments
- 16.2.2.5. Financials (Based on Availability)
- 16.2.3 In Silico Biosciences Inc
- 16.2.3.1. Overview
- 16.2.3.2. Products
- 16.2.3.3. SWOT Analysis
- 16.2.3.4. Recent Developments
- 16.2.3.5. Financials (Based on Availability)
- 16.2.4 Schrodinger LLC
- 16.2.4.1. Overview
- 16.2.4.2. Products
- 16.2.4.3. SWOT Analysis
- 16.2.4.4. Recent Developments
- 16.2.4.5. Financials (Based on Availability)
- 16.2.5 Compugen Inc
- 16.2.5.1. Overview
- 16.2.5.2. Products
- 16.2.5.3. SWOT Analysis
- 16.2.5.4. Recent Developments
- 16.2.5.5. Financials (Based on Availability)
- 16.2.6 Biovia
- 16.2.6.1. Overview
- 16.2.6.2. Products
- 16.2.6.3. SWOT Analysis
- 16.2.6.4. Recent Developments
- 16.2.6.5. Financials (Based on Availability)
- 16.2.7 Leadscope Inc
- 16.2.7.1. Overview
- 16.2.7.2. Products
- 16.2.7.3. SWOT Analysis
- 16.2.7.4. Recent Developments
- 16.2.7.5. Financials (Based on Availability)
- 16.2.8 Certara L P
- 16.2.8.1. Overview
- 16.2.8.2. Products
- 16.2.8.3. SWOT Analysis
- 16.2.8.4. Recent Developments
- 16.2.8.5. Financials (Based on Availability)
- 16.2.9 Simulations Plus Inc
- 16.2.9.1. Overview
- 16.2.9.2. Products
- 16.2.9.3. SWOT Analysis
- 16.2.9.4. Recent Developments
- 16.2.9.5. Financials (Based on Availability)
- 16.2.10 Genedata
- 16.2.10.1. Overview
- 16.2.10.2. Products
- 16.2.10.3. SWOT Analysis
- 16.2.10.4. Recent Developments
- 16.2.10.5. Financials (Based on Availability)
- 16.2.1 Entelos Inc*List Not Exhaustive
List of Figures
- Figure 1: Global Bio simulation Market Revenue Breakdown (Million, %) by Region 2024 & 2032
- Figure 2: North America Bio simulation Market Revenue (Million), by Country 2024 & 2032
- Figure 3: North America Bio simulation Market Revenue Share (%), by Country 2024 & 2032
- Figure 4: Europe Bio simulation Market Revenue (Million), by Country 2024 & 2032
- Figure 5: Europe Bio simulation Market Revenue Share (%), by Country 2024 & 2032
- Figure 6: Asia Pacific Bio simulation Market Revenue (Million), by Country 2024 & 2032
- Figure 7: Asia Pacific Bio simulation Market Revenue Share (%), by Country 2024 & 2032
- Figure 8: Middle East and Africa Bio simulation Market Revenue (Million), by Country 2024 & 2032
- Figure 9: Middle East and Africa Bio simulation Market Revenue Share (%), by Country 2024 & 2032
- Figure 10: South America Bio simulation Market Revenue (Million), by Country 2024 & 2032
- Figure 11: South America Bio simulation Market Revenue Share (%), by Country 2024 & 2032
- Figure 12: North America Bio simulation Market Revenue (Million), by Product 2024 & 2032
- Figure 13: North America Bio simulation Market Revenue Share (%), by Product 2024 & 2032
- Figure 14: North America Bio simulation Market Revenue (Million), by Application 2024 & 2032
- Figure 15: North America Bio simulation Market Revenue Share (%), by Application 2024 & 2032
- Figure 16: North America Bio simulation Market Revenue (Million), by End User 2024 & 2032
- Figure 17: North America Bio simulation Market Revenue Share (%), by End User 2024 & 2032
- Figure 18: North America Bio simulation Market Revenue (Million), by Country 2024 & 2032
- Figure 19: North America Bio simulation Market Revenue Share (%), by Country 2024 & 2032
- Figure 20: Europe Bio simulation Market Revenue (Million), by Product 2024 & 2032
- Figure 21: Europe Bio simulation Market Revenue Share (%), by Product 2024 & 2032
- Figure 22: Europe Bio simulation Market Revenue (Million), by Application 2024 & 2032
- Figure 23: Europe Bio simulation Market Revenue Share (%), by Application 2024 & 2032
- Figure 24: Europe Bio simulation Market Revenue (Million), by End User 2024 & 2032
- Figure 25: Europe Bio simulation Market Revenue Share (%), by End User 2024 & 2032
- Figure 26: Europe Bio simulation Market Revenue (Million), by Country 2024 & 2032
- Figure 27: Europe Bio simulation Market Revenue Share (%), by Country 2024 & 2032
- Figure 28: Asia Pacific Bio simulation Market Revenue (Million), by Product 2024 & 2032
- Figure 29: Asia Pacific Bio simulation Market Revenue Share (%), by Product 2024 & 2032
- Figure 30: Asia Pacific Bio simulation Market Revenue (Million), by Application 2024 & 2032
- Figure 31: Asia Pacific Bio simulation Market Revenue Share (%), by Application 2024 & 2032
- Figure 32: Asia Pacific Bio simulation Market Revenue (Million), by End User 2024 & 2032
- Figure 33: Asia Pacific Bio simulation Market Revenue Share (%), by End User 2024 & 2032
- Figure 34: Asia Pacific Bio simulation Market Revenue (Million), by Country 2024 & 2032
- Figure 35: Asia Pacific Bio simulation Market Revenue Share (%), by Country 2024 & 2032
- Figure 36: Middle East and Africa Bio simulation Market Revenue (Million), by Product 2024 & 2032
- Figure 37: Middle East and Africa Bio simulation Market Revenue Share (%), by Product 2024 & 2032
- Figure 38: Middle East and Africa Bio simulation Market Revenue (Million), by Application 2024 & 2032
- Figure 39: Middle East and Africa Bio simulation Market Revenue Share (%), by Application 2024 & 2032
- Figure 40: Middle East and Africa Bio simulation Market Revenue (Million), by End User 2024 & 2032
- Figure 41: Middle East and Africa Bio simulation Market Revenue Share (%), by End User 2024 & 2032
- Figure 42: Middle East and Africa Bio simulation Market Revenue (Million), by Country 2024 & 2032
- Figure 43: Middle East and Africa Bio simulation Market Revenue Share (%), by Country 2024 & 2032
- Figure 44: South America Bio simulation Market Revenue (Million), by Product 2024 & 2032
- Figure 45: South America Bio simulation Market Revenue Share (%), by Product 2024 & 2032
- Figure 46: South America Bio simulation Market Revenue (Million), by Application 2024 & 2032
- Figure 47: South America Bio simulation Market Revenue Share (%), by Application 2024 & 2032
- Figure 48: South America Bio simulation Market Revenue (Million), by End User 2024 & 2032
- Figure 49: South America Bio simulation Market Revenue Share (%), by End User 2024 & 2032
- Figure 50: South America Bio simulation Market Revenue (Million), by Country 2024 & 2032
- Figure 51: South America Bio simulation Market Revenue Share (%), by Country 2024 & 2032
List of Tables
- Table 1: Global Bio simulation Market Revenue Million Forecast, by Region 2019 & 2032
- Table 2: Global Bio simulation Market Revenue Million Forecast, by Product 2019 & 2032
- Table 3: Global Bio simulation Market Revenue Million Forecast, by Application 2019 & 2032
- Table 4: Global Bio simulation Market Revenue Million Forecast, by End User 2019 & 2032
- Table 5: Global Bio simulation Market Revenue Million Forecast, by Region 2019 & 2032
- Table 6: Global Bio simulation Market Revenue Million Forecast, by Country 2019 & 2032
- Table 7: United States Bio simulation Market Revenue (Million) Forecast, by Application 2019 & 2032
- Table 8: Canada Bio simulation Market Revenue (Million) Forecast, by Application 2019 & 2032
- Table 9: Mexico Bio simulation Market Revenue (Million) Forecast, by Application 2019 & 2032
- Table 10: Global Bio simulation Market Revenue Million Forecast, by Country 2019 & 2032
- Table 11: Germany Bio simulation Market Revenue (Million) Forecast, by Application 2019 & 2032
- Table 12: United Kingdom Bio simulation Market Revenue (Million) Forecast, by Application 2019 & 2032
- Table 13: France Bio simulation Market Revenue (Million) Forecast, by Application 2019 & 2032
- Table 14: Italy Bio simulation Market Revenue (Million) Forecast, by Application 2019 & 2032
- Table 15: Spain Bio simulation Market Revenue (Million) Forecast, by Application 2019 & 2032
- Table 16: Rest of Europe Bio simulation Market Revenue (Million) Forecast, by Application 2019 & 2032
- Table 17: Global Bio simulation Market Revenue Million Forecast, by Country 2019 & 2032
- Table 18: China Bio simulation Market Revenue (Million) Forecast, by Application 2019 & 2032
- Table 19: Japan Bio simulation Market Revenue (Million) Forecast, by Application 2019 & 2032
- Table 20: India Bio simulation Market Revenue (Million) Forecast, by Application 2019 & 2032
- Table 21: Australia Bio simulation Market Revenue (Million) Forecast, by Application 2019 & 2032
- Table 22: South Korea Bio simulation Market Revenue (Million) Forecast, by Application 2019 & 2032
- Table 23: Rest of Asia Pacific Bio simulation Market Revenue (Million) Forecast, by Application 2019 & 2032
- Table 24: Global Bio simulation Market Revenue Million Forecast, by Country 2019 & 2032
- Table 25: GCC Bio simulation Market Revenue (Million) Forecast, by Application 2019 & 2032
- Table 26: South Africa Bio simulation Market Revenue (Million) Forecast, by Application 2019 & 2032
- Table 27: Rest of Middle East and Africa Bio simulation Market Revenue (Million) Forecast, by Application 2019 & 2032
- Table 28: Global Bio simulation Market Revenue Million Forecast, by Country 2019 & 2032
- Table 29: Brazil Bio simulation Market Revenue (Million) Forecast, by Application 2019 & 2032
- Table 30: Argentina Bio simulation Market Revenue (Million) Forecast, by Application 2019 & 2032
- Table 31: Rest of South America Bio simulation Market Revenue (Million) Forecast, by Application 2019 & 2032
- Table 32: Global Bio simulation Market Revenue Million Forecast, by Product 2019 & 2032
- Table 33: Global Bio simulation Market Revenue Million Forecast, by Application 2019 & 2032
- Table 34: Global Bio simulation Market Revenue Million Forecast, by End User 2019 & 2032
- Table 35: Global Bio simulation Market Revenue Million Forecast, by Country 2019 & 2032
- Table 36: United States Bio simulation Market Revenue (Million) Forecast, by Application 2019 & 2032
- Table 37: Canada Bio simulation Market Revenue (Million) Forecast, by Application 2019 & 2032
- Table 38: Mexico Bio simulation Market Revenue (Million) Forecast, by Application 2019 & 2032
- Table 39: Global Bio simulation Market Revenue Million Forecast, by Product 2019 & 2032
- Table 40: Global Bio simulation Market Revenue Million Forecast, by Application 2019 & 2032
- Table 41: Global Bio simulation Market Revenue Million Forecast, by End User 2019 & 2032
- Table 42: Global Bio simulation Market Revenue Million Forecast, by Country 2019 & 2032
- Table 43: Germany Bio simulation Market Revenue (Million) Forecast, by Application 2019 & 2032
- Table 44: United Kingdom Bio simulation Market Revenue (Million) Forecast, by Application 2019 & 2032
- Table 45: France Bio simulation Market Revenue (Million) Forecast, by Application 2019 & 2032
- Table 46: Italy Bio simulation Market Revenue (Million) Forecast, by Application 2019 & 2032
- Table 47: Spain Bio simulation Market Revenue (Million) Forecast, by Application 2019 & 2032
- Table 48: Rest of Europe Bio simulation Market Revenue (Million) Forecast, by Application 2019 & 2032
- Table 49: Global Bio simulation Market Revenue Million Forecast, by Product 2019 & 2032
- Table 50: Global Bio simulation Market Revenue Million Forecast, by Application 2019 & 2032
- Table 51: Global Bio simulation Market Revenue Million Forecast, by End User 2019 & 2032
- Table 52: Global Bio simulation Market Revenue Million Forecast, by Country 2019 & 2032
- Table 53: China Bio simulation Market Revenue (Million) Forecast, by Application 2019 & 2032
- Table 54: Japan Bio simulation Market Revenue (Million) Forecast, by Application 2019 & 2032
- Table 55: India Bio simulation Market Revenue (Million) Forecast, by Application 2019 & 2032
- Table 56: Australia Bio simulation Market Revenue (Million) Forecast, by Application 2019 & 2032
- Table 57: South Korea Bio simulation Market Revenue (Million) Forecast, by Application 2019 & 2032
- Table 58: Rest of Asia Pacific Bio simulation Market Revenue (Million) Forecast, by Application 2019 & 2032
- Table 59: Global Bio simulation Market Revenue Million Forecast, by Product 2019 & 2032
- Table 60: Global Bio simulation Market Revenue Million Forecast, by Application 2019 & 2032
- Table 61: Global Bio simulation Market Revenue Million Forecast, by End User 2019 & 2032
- Table 62: Global Bio simulation Market Revenue Million Forecast, by Country 2019 & 2032
- Table 63: GCC Bio simulation Market Revenue (Million) Forecast, by Application 2019 & 2032
- Table 64: South Africa Bio simulation Market Revenue (Million) Forecast, by Application 2019 & 2032
- Table 65: Rest of Middle East and Africa Bio simulation Market Revenue (Million) Forecast, by Application 2019 & 2032
- Table 66: Global Bio simulation Market Revenue Million Forecast, by Product 2019 & 2032
- Table 67: Global Bio simulation Market Revenue Million Forecast, by Application 2019 & 2032
- Table 68: Global Bio simulation Market Revenue Million Forecast, by End User 2019 & 2032
- Table 69: Global Bio simulation Market Revenue Million Forecast, by Country 2019 & 2032
- Table 70: Brazil Bio simulation Market Revenue (Million) Forecast, by Application 2019 & 2032
- Table 71: Argentina Bio simulation Market Revenue (Million) Forecast, by Application 2019 & 2032
- Table 72: Rest of South America Bio simulation Market Revenue (Million) Forecast, by Application 2019 & 2032
Frequently Asked Questions
1. What is the projected Compound Annual Growth Rate (CAGR) of the Bio simulation Market?
The projected CAGR is approximately 10.00%.
2. Which companies are prominent players in the Bio simulation Market?
Key companies in the market include Entelos Inc*List Not Exhaustive, Pharmaceutical Product Development LLC, In Silico Biosciences Inc, Schrodinger LLC, Compugen Inc, Biovia, Leadscope Inc, Certara L P, Simulations Plus Inc, Genedata.
3. What are the main segments of the Bio simulation Market?
The market segments include Product, Application, End User.
4. Can you provide details about the market size?
The market size is estimated to be USD XX Million as of 2022.
5. What are some drivers contributing to market growth?
Increasing Healthcare Expenditure; Growing Adoption of Biosimulation Software; High Drug Discovery and Development Costs.
6. What are the notable trends driving market growth?
Software Segment is Expected to Show Significant Growth Over the Forecast Period.
7. Are there any restraints impacting market growth?
Lack of Awareness Among Healthcare Professionals; Lack of Skilled Personnel.
8. Can you provide examples of recent developments in the market?
In June 2022, Certara announced a launch of a new version of its Immunogenicity (IG), Immuno-Oncology (IO), and Vaccine Simulators to help predict how drugs work and address key questions in the development of novel biologic therapies.
9. What pricing options are available for accessing the report?
Pricing options include single-user, multi-user, and enterprise licenses priced at USD 4750, USD 5250, and USD 8750 respectively.
10. Is the market size provided in terms of value or volume?
The market size is provided in terms of value, measured in Million.
11. Are there any specific market keywords associated with the report?
Yes, the market keyword associated with the report is "Bio simulation Market," which aids in identifying and referencing the specific market segment covered.
12. How do I determine which pricing option suits my needs best?
The pricing options vary based on user requirements and access needs. Individual users may opt for single-user licenses, while businesses requiring broader access may choose multi-user or enterprise licenses for cost-effective access to the report.
13. Are there any additional resources or data provided in the Bio simulation Market report?
While the report offers comprehensive insights, it's advisable to review the specific contents or supplementary materials provided to ascertain if additional resources or data are available.
14. How can I stay updated on further developments or reports in the Bio simulation Market?
To stay informed about further developments, trends, and reports in the Bio simulation Market, consider subscribing to industry newsletters, following relevant companies and organizations, or regularly checking reputable industry news sources and publications.
Methodology
Step 1 - Identification of Relevant Samples Size from Population Database


Step 2 - Approaches for Defining Global Market Size (Value, Volume* & Price*)

Note*: In applicable scenarios
Step 3 - Data Sources
Primary Research
- Web Analytics
- Survey Reports
- Research Institute
- Latest Research Reports
- Opinion Leaders
Secondary Research
- Annual Reports
- White Paper
- Latest Press Release
- Industry Association
- Paid Database
- Investor Presentations

Step 4 - Data Triangulation
Involves using different sources of information in order to increase the validity of a study
These sources are likely to be stakeholders in a program - participants, other researchers, program staff, other community members, and so on.
Then we put all data in single framework & apply various statistical tools to find out the dynamic on the market.
During the analysis stage, feedback from the stakeholder groups would be compared to determine areas of agreement as well as areas of divergence


