

Key Insights
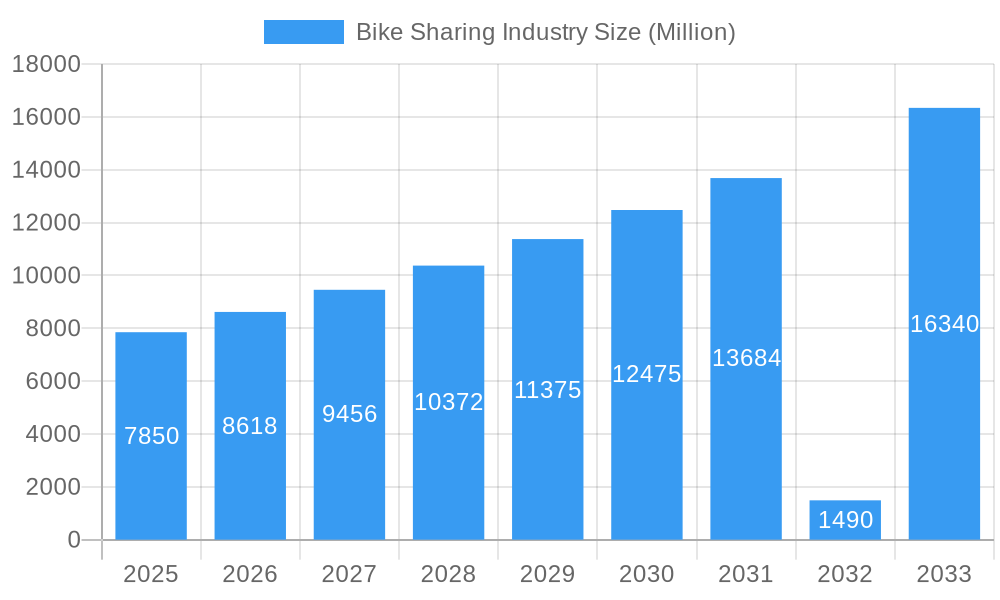
The global bike-sharing market, valued at $7.85 billion in 2025, is projected to experience robust growth, driven by increasing urbanization, rising environmental concerns, and the expanding adoption of e-bikes and dockless systems. The market's Compound Annual Growth Rate (CAGR) of 9.65% from 2025 to 2033 indicates a significant expansion over the forecast period. Several factors contribute to this growth trajectory. Firstly, the convenience and affordability of bike-sharing compared to private vehicle ownership are powerful attractors, particularly among younger demographics and in densely populated urban areas. Secondly, technological advancements, such as improved GPS tracking, mobile payment integration, and the development of increasingly sophisticated e-bike models with longer ranges and enhanced battery life, are fueling market expansion. Government initiatives promoting sustainable transportation and reducing traffic congestion further bolster the industry's growth potential. The rise of micromobility solutions – encompassing e-scooters and e-bikes – is further contributing to the overall expansion of urban shared mobility services.
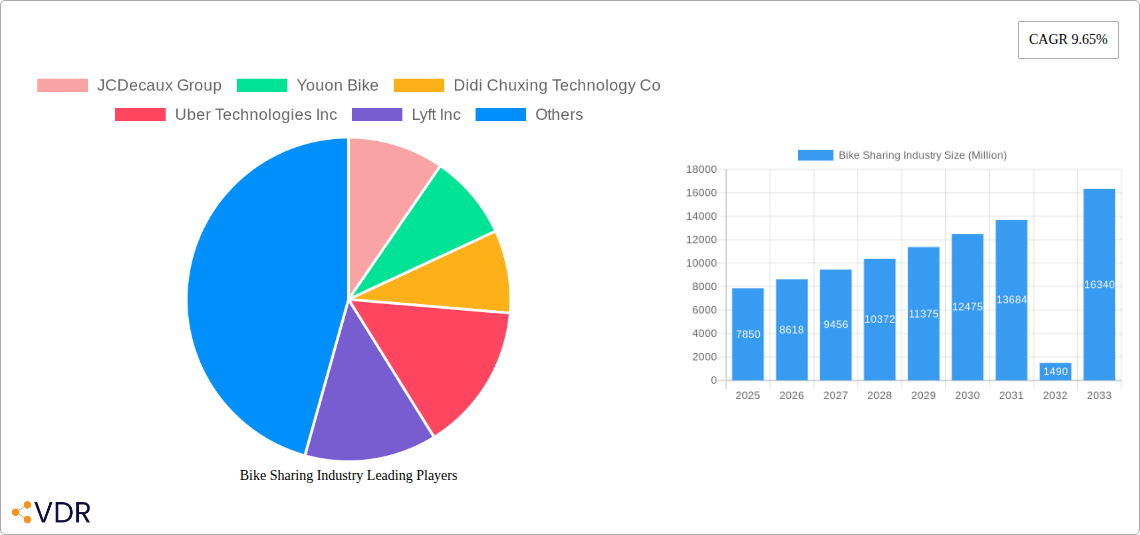
Bike Sharing Industry Market Size (In Billion)
However, the market faces certain challenges. Operational costs, including maintenance, insurance, and theft prevention, can significantly impact profitability. Regulatory hurdles, varying across different regions, can create complexities in market entry and expansion. Competition from other micromobility providers and the need to address issues of responsible usage and parking contribute to a dynamic and evolving market landscape. The segmentation of the market into traditional bikes, e-bikes, and sharing systems (docked and dockless) reflects the diverse user needs and technological innovations shaping the industry. Key players such as JCDecaux Group, Didi Chuxing, Uber, and Lyft are continuously adapting their strategies to maintain competitiveness in this rapidly expanding sector. The Asia-Pacific region is expected to dominate the market, owing to high population density, growing urbanization, and supportive government policies. North America and Europe will also contribute significantly to market growth, driven by increased environmental awareness and the rising adoption of sustainable transportation solutions.
Bike Sharing Industry Company Market Share
Bike Sharing Industry Market Report: 2019-2033
This comprehensive report provides an in-depth analysis of the bike-sharing industry, encompassing market dynamics, growth trends, key players, and future projections. The study period covers 2019-2033, with 2025 as the base and estimated year. This report is essential for industry professionals, investors, and anyone seeking to understand this dynamic market. We analyze both parent markets (micro-mobility) and child markets (e-bike sharing, docked vs. dockless systems) for a complete picture.
Bike Sharing Industry Market Dynamics & Structure
The bike-sharing market, a vibrant sub-segment of the broader micro-mobility sector, is characterized by intense competition, rapid technological advancements, and evolving regulatory landscapes. Market concentration is currently moderate, with a few dominant players and numerous smaller regional operators. Technological innovation, particularly in e-bike technology and smart-locking systems, is a key driver, while regulatory frameworks concerning permits, safety standards, and parking regulations significantly influence market growth. The market faces competition from other last-mile solutions like ride-hailing services and public transport.
- Market Concentration: Moderate, with the top 5 players holding approximately xx% of the global market share in 2025 (estimated).
- Technological Innovation: Focus on e-bikes, improved GPS tracking, and enhanced security features. Innovation barriers include high R&D costs and the need for robust infrastructure.
- Regulatory Frameworks: Vary significantly across regions, impacting operational costs and market access.
- Competitive Substitutes: Ride-hailing services, public transportation, and privately owned bicycles.
- End-User Demographics: Primarily young adults and urban professionals seeking convenient and sustainable transportation.
- M&A Trends: Consolidation is expected, with larger players acquiring smaller companies to expand market share and geographical reach. xx M&A deals were recorded between 2019 and 2024.
Bike Sharing Industry Growth Trends & Insights
The global bike-sharing market experienced significant growth during the historical period (2019-2024), driven by increasing urbanization, rising environmental concerns, and the adoption of e-bikes. Market size reached approximately xx million units in 2024 and is projected to reach xx million units by 2025, exhibiting a CAGR of xx% during the forecast period (2025-2033). Technological advancements, such as the introduction of lighter, more durable e-bikes and improved app-based booking systems, are further accelerating market growth. Consumer behavior shifts towards sustainable transportation options are also fueling adoption. Market penetration remains relatively low in many regions, indicating substantial growth potential.
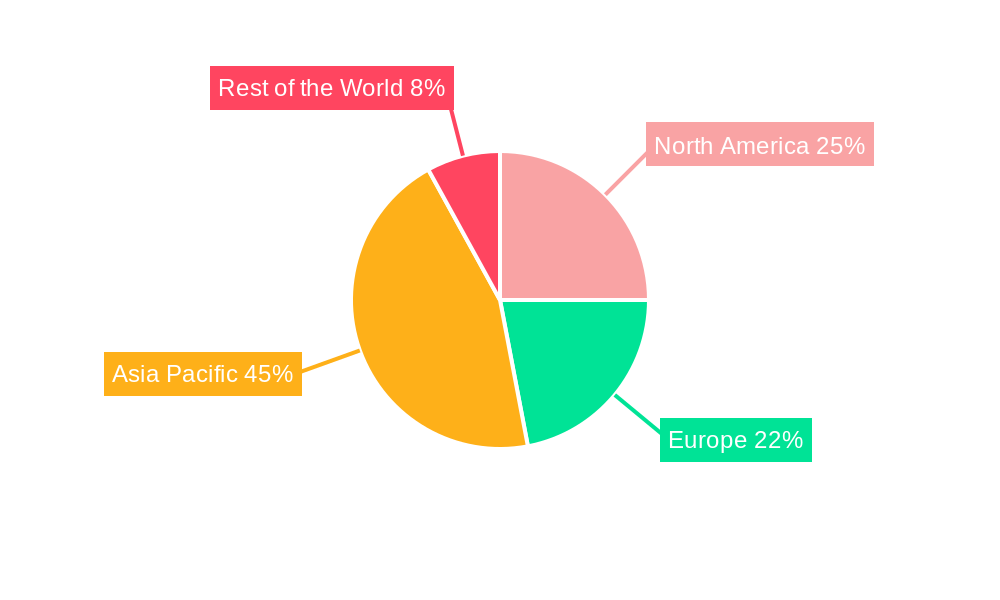
Dominant Regions, Countries, or Segments in Bike Sharing Industry
Asia-Pacific, particularly China, currently dominates the global bike-sharing market, accounting for xx% of the total market share in 2025. This dominance is attributed to factors such as high population density in urban centers, supportive government policies promoting cycling infrastructure, and the affordability of shared bicycles. However, North America and Europe are experiencing rapid growth with increasing adoption of e-bikes and dockless systems.
Key Drivers:
- Asia-Pacific: High population density, government initiatives, relatively low bike costs.
- North America: Growing environmental awareness, increasing investment in cycling infrastructure.
- Europe: Focus on sustainable transport, supportive urban planning policies.
Dominant Segments: E-bikes are gaining traction, exhibiting a higher growth rate than traditional bikes. Dockless systems offer greater flexibility and convenience, leading to increased adoption compared to docked systems.
Bike Sharing Industry Product Landscape
The bike-sharing market features a diverse range of products, including traditional bicycles and e-bikes, with both docked and dockless sharing systems. Innovations are focused on enhancing durability, security features (GPS tracking, smart locks), and user experience through improved mobile applications. Key features attracting users include ease of use, affordability, and environmental friendliness. Technological advancements are primarily centered around battery technology for e-bikes and enhanced GPS capabilities for improved tracking and security.
Key Drivers, Barriers & Challenges in Bike Sharing Industry
Key Drivers: Growing urbanization, rising environmental awareness, government initiatives to promote sustainable transportation, and advancements in e-bike technology are driving market growth. The convenience and affordability offered by bike-sharing services also play a significant role.
Key Challenges: High initial investment costs, operational challenges (maintenance, vandalism, theft), competition from other mobility solutions, and regulatory hurdles (permits, parking restrictions) pose significant obstacles. Supply chain disruptions can also impact the availability of bikes and parts. For instance, xx% of bike-sharing operators reported supply chain issues in 2024 (estimated).
Emerging Opportunities in Bike Sharing Industry
Untapped markets in developing countries, integration with public transportation systems, and expansion into niche applications (e.g., campus-based sharing, tourist-oriented services) represent key opportunities. The increasing demand for last-mile delivery solutions also presents a lucrative segment for e-cargo bikes. Personalized subscription models and the integration of advanced features like connected devices could enhance user experience.
Growth Accelerators in the Bike Sharing Industry
Technological breakthroughs in battery technology, leading to longer-range and faster-charging e-bikes, will play a crucial role. Strategic partnerships between bike-sharing operators and municipalities to improve cycling infrastructure and integrate with public transit networks will also drive growth. Expansion into new geographical markets and the development of innovative business models will further fuel expansion.
Key Players Shaping the Bike Sharing Industry Market
- JCDecaux Group
- Youon Bike
- Didi Chuxing Technology Co
- Uber Technologies Inc
- Lyft Inc
- Bluegogo
- Hellobike
- Meituan Bik
- Bird Rides Inc
- Neutron Holdings Inc
Notable Milestones in Bike Sharing Industry Sector
- March 2023: MYBYK launched two electric bicycle variants, impacting the e-bike segment.
- March 2023: Brighton and Hove launched a bike-sharing scheme with Beryl, expanding market reach.
- December 2023: USD 23 million investment in Tembici signifies significant growth potential in Latin America.
In-Depth Bike Sharing Industry Market Outlook
The bike-sharing industry is poised for substantial growth over the next decade, driven by ongoing technological advancements, supportive government policies, and a growing preference for sustainable transportation. Strategic partnerships, expansion into untapped markets, and the development of innovative business models will unlock significant market opportunities. The increasing adoption of e-bikes, particularly in last-mile delivery, will be a key driver of growth. The market will continue to evolve, with a focus on enhanced user experience, improved security, and environmental sustainability.
Bike Sharing Industry Segmentation
-
1. Bike
- 1.1. Traditional/Regular Bike
- 1.2. E-bike
-
2. Sharing System
- 2.1. Docked
- 2.2. Dockless
Bike Sharing Industry Segmentation By Geography
- 1. North America
- 2. Europe
- 3. Asia Pacific
- 4. Rest of the World
Bike Sharing Industry Regional Market Share
Geographic Coverage of Bike Sharing Industry
Bike Sharing Industry REPORT HIGHLIGHTS
| Aspects | Details |
|---|---|
| Study Period | 2020-2034 |
| Base Year | 2025 |
| Estimated Year | 2026 |
| Forecast Period | 2026-2034 |
| Historical Period | 2020-2025 |
| Growth Rate | CAGR of 9.65% from 2020-2034 |
| Segmentation |
|
Table of Contents
- 1. Introduction
- 1.1. Research Scope
- 1.2. Market Segmentation
- 1.3. Research Objective
- 1.4. Definitions and Assumptions
- 2. Executive Summary
- 2.1. Market Snapshot
- 3. Market Dynamics
- 3.1. Market Drivers
- 3.2. Market Restrains
- 3.3. Market Trends
- 3.4. Market Opportunities
- 4. Market Factor Analysis
- 4.1. Porters Five Forces
- 4.1.1. Bargaining Power of Suppliers
- 4.1.2. Bargaining Power of Buyers
- 4.1.3. Threat of New Entrants
- 4.1.4. Threat of Substitutes
- 4.1.5. Competitive Rivalry
- 4.2. PESTEL analysis
- 4.3. BCG Analysis
- 4.3.1. Stars (High Growth, High Market Share)
- 4.3.2. Cash Cows (Low Growth, High Market Share)
- 4.3.3. Question Mark (High Growth, Low Market Share)
- 4.3.4. Dogs (Low Growth, Low Market Share)
- 4.4. Ansoff Matrix Analysis
- 4.5. Supply Chain Analysis
- 4.6. Regulatory Landscape
- 4.7. Current Market Potential and Opportunity Assessment (TAM–SAM–SOM Framework)
- 4.8. VDR Analyst Note
- 4.1. Porters Five Forces
- 5. Market Analysis, Insights and Forecast 2021-2033
- 5.1. Market Analysis, Insights and Forecast - by Bike
- 5.1.1. Traditional/Regular Bike
- 5.1.2. E-bike
- 5.2. Market Analysis, Insights and Forecast - by Sharing System
- 5.2.1. Docked
- 5.2.2. Dockless
- 5.3. Market Analysis, Insights and Forecast - by Region
- 5.3.1. North America
- 5.3.2. Europe
- 5.3.3. Asia Pacific
- 5.3.4. Rest of the World
- 5.1. Market Analysis, Insights and Forecast - by Bike
- 6. Global Bike Sharing Industry Analysis, Insights and Forecast, 2021-2033
- 6.1. Market Analysis, Insights and Forecast - by Bike
- 6.1.1. Traditional/Regular Bike
- 6.1.2. E-bike
- 6.2. Market Analysis, Insights and Forecast - by Sharing System
- 6.2.1. Docked
- 6.2.2. Dockless
- 6.1. Market Analysis, Insights and Forecast - by Bike
- 7. North America Bike Sharing Industry Analysis, Insights and Forecast, 2021-2033
- 7.1. Market Analysis, Insights and Forecast - by Bike
- 7.1.1. Traditional/Regular Bike
- 7.1.2. E-bike
- 7.2. Market Analysis, Insights and Forecast - by Sharing System
- 7.2.1. Docked
- 7.2.2. Dockless
- 7.1. Market Analysis, Insights and Forecast - by Bike
- 8. Europe Bike Sharing Industry Analysis, Insights and Forecast, 2021-2033
- 8.1. Market Analysis, Insights and Forecast - by Bike
- 8.1.1. Traditional/Regular Bike
- 8.1.2. E-bike
- 8.2. Market Analysis, Insights and Forecast - by Sharing System
- 8.2.1. Docked
- 8.2.2. Dockless
- 8.1. Market Analysis, Insights and Forecast - by Bike
- 9. Asia Pacific Bike Sharing Industry Analysis, Insights and Forecast, 2021-2033
- 9.1. Market Analysis, Insights and Forecast - by Bike
- 9.1.1. Traditional/Regular Bike
- 9.1.2. E-bike
- 9.2. Market Analysis, Insights and Forecast - by Sharing System
- 9.2.1. Docked
- 9.2.2. Dockless
- 9.1. Market Analysis, Insights and Forecast - by Bike
- 10. Rest of the World Bike Sharing Industry Analysis, Insights and Forecast, 2021-2033
- 10.1. Market Analysis, Insights and Forecast - by Bike
- 10.1.1. Traditional/Regular Bike
- 10.1.2. E-bike
- 10.2. Market Analysis, Insights and Forecast - by Sharing System
- 10.2.1. Docked
- 10.2.2. Dockless
- 10.1. Market Analysis, Insights and Forecast - by Bike
- 11. Competitive Analysis
- 11.1. Company Profiles
- 11.1.1 JCDecaux Group
- 11.1.1.1. Company Overview
- 11.1.1.2. Products
- 11.1.1.3. Company Financials
- 11.1.1.4. SWOT Analysis
- 11.1.2 Youon Bike
- 11.1.2.1. Company Overview
- 11.1.2.2. Products
- 11.1.2.3. Company Financials
- 11.1.2.4. SWOT Analysis
- 11.1.3 Didi Chuxing Technology Co
- 11.1.3.1. Company Overview
- 11.1.3.2. Products
- 11.1.3.3. Company Financials
- 11.1.3.4. SWOT Analysis
- 11.1.4 Uber Technologies Inc
- 11.1.4.1. Company Overview
- 11.1.4.2. Products
- 11.1.4.3. Company Financials
- 11.1.4.4. SWOT Analysis
- 11.1.5 Lyft Inc
- 11.1.5.1. Company Overview
- 11.1.5.2. Products
- 11.1.5.3. Company Financials
- 11.1.5.4. SWOT Analysis
- 11.1.6 Bluegogo
- 11.1.6.1. Company Overview
- 11.1.6.2. Products
- 11.1.6.3. Company Financials
- 11.1.6.4. SWOT Analysis
- 11.1.7 Hellobike
- 11.1.7.1. Company Overview
- 11.1.7.2. Products
- 11.1.7.3. Company Financials
- 11.1.7.4. SWOT Analysis
- 11.1.8 Meituan Bik
- 11.1.8.1. Company Overview
- 11.1.8.2. Products
- 11.1.8.3. Company Financials
- 11.1.8.4. SWOT Analysis
- 11.1.9 Bird Rides Inc
- 11.1.9.1. Company Overview
- 11.1.9.2. Products
- 11.1.9.3. Company Financials
- 11.1.9.4. SWOT Analysis
- 11.1.10 Neutron Holdings Inc
- 11.1.10.1. Company Overview
- 11.1.10.2. Products
- 11.1.10.3. Company Financials
- 11.1.10.4. SWOT Analysis
- 11.1.1 JCDecaux Group
- 11.2. Market Entropy
- 11.2.1 Company's Key Areas Served
- 11.2.2 Recent Developments
- 11.3. Company Market Share Analysis 2025
- 11.3.1 Top 5 Companies Market Share Analysis
- 11.3.2 Top 3 Companies Market Share Analysis
- 11.4. List of Potential Customers
- 12. Research Methodology
List of Figures
- Figure 1: Global Bike Sharing Industry Revenue Breakdown (Million, %) by Region 2025 & 2033
- Figure 2: North America Bike Sharing Industry Revenue (Million), by Bike 2025 & 2033
- Figure 3: North America Bike Sharing Industry Revenue Share (%), by Bike 2025 & 2033
- Figure 4: North America Bike Sharing Industry Revenue (Million), by Sharing System 2025 & 2033
- Figure 5: North America Bike Sharing Industry Revenue Share (%), by Sharing System 2025 & 2033
- Figure 6: North America Bike Sharing Industry Revenue (Million), by Country 2025 & 2033
- Figure 7: North America Bike Sharing Industry Revenue Share (%), by Country 2025 & 2033
- Figure 8: Europe Bike Sharing Industry Revenue (Million), by Bike 2025 & 2033
- Figure 9: Europe Bike Sharing Industry Revenue Share (%), by Bike 2025 & 2033
- Figure 10: Europe Bike Sharing Industry Revenue (Million), by Sharing System 2025 & 2033
- Figure 11: Europe Bike Sharing Industry Revenue Share (%), by Sharing System 2025 & 2033
- Figure 12: Europe Bike Sharing Industry Revenue (Million), by Country 2025 & 2033
- Figure 13: Europe Bike Sharing Industry Revenue Share (%), by Country 2025 & 2033
- Figure 14: Asia Pacific Bike Sharing Industry Revenue (Million), by Bike 2025 & 2033
- Figure 15: Asia Pacific Bike Sharing Industry Revenue Share (%), by Bike 2025 & 2033
- Figure 16: Asia Pacific Bike Sharing Industry Revenue (Million), by Sharing System 2025 & 2033
- Figure 17: Asia Pacific Bike Sharing Industry Revenue Share (%), by Sharing System 2025 & 2033
- Figure 18: Asia Pacific Bike Sharing Industry Revenue (Million), by Country 2025 & 2033
- Figure 19: Asia Pacific Bike Sharing Industry Revenue Share (%), by Country 2025 & 2033
- Figure 20: Rest of the World Bike Sharing Industry Revenue (Million), by Bike 2025 & 2033
- Figure 21: Rest of the World Bike Sharing Industry Revenue Share (%), by Bike 2025 & 2033
- Figure 22: Rest of the World Bike Sharing Industry Revenue (Million), by Sharing System 2025 & 2033
- Figure 23: Rest of the World Bike Sharing Industry Revenue Share (%), by Sharing System 2025 & 2033
- Figure 24: Rest of the World Bike Sharing Industry Revenue (Million), by Country 2025 & 2033
- Figure 25: Rest of the World Bike Sharing Industry Revenue Share (%), by Country 2025 & 2033
List of Tables
- Table 1: Global Bike Sharing Industry Revenue Million Forecast, by Bike 2020 & 2033
- Table 2: Global Bike Sharing Industry Revenue Million Forecast, by Sharing System 2020 & 2033
- Table 3: Global Bike Sharing Industry Revenue Million Forecast, by Region 2020 & 2033
- Table 4: Global Bike Sharing Industry Revenue Million Forecast, by Bike 2020 & 2033
- Table 5: Global Bike Sharing Industry Revenue Million Forecast, by Sharing System 2020 & 2033
- Table 6: Global Bike Sharing Industry Revenue Million Forecast, by Country 2020 & 2033
- Table 7: Global Bike Sharing Industry Revenue Million Forecast, by Bike 2020 & 2033
- Table 8: Global Bike Sharing Industry Revenue Million Forecast, by Sharing System 2020 & 2033
- Table 9: Global Bike Sharing Industry Revenue Million Forecast, by Country 2020 & 2033
- Table 10: Global Bike Sharing Industry Revenue Million Forecast, by Bike 2020 & 2033
- Table 11: Global Bike Sharing Industry Revenue Million Forecast, by Sharing System 2020 & 2033
- Table 12: Global Bike Sharing Industry Revenue Million Forecast, by Country 2020 & 2033
- Table 13: Global Bike Sharing Industry Revenue Million Forecast, by Bike 2020 & 2033
- Table 14: Global Bike Sharing Industry Revenue Million Forecast, by Sharing System 2020 & 2033
- Table 15: Global Bike Sharing Industry Revenue Million Forecast, by Country 2020 & 2033
Frequently Asked Questions
1. What is the projected Compound Annual Growth Rate (CAGR) of the Bike Sharing Industry?
The projected CAGR is approximately 9.65%.
2. Which companies are prominent players in the Bike Sharing Industry?
Key companies in the market include JCDecaux Group, Youon Bike, Didi Chuxing Technology Co, Uber Technologies Inc, Lyft Inc, Bluegogo, Hellobike, Meituan Bik, Bird Rides Inc, Neutron Holdings Inc.
3. What are the main segments of the Bike Sharing Industry?
The market segments include Bike, Sharing System.
4. Can you provide details about the market size?
The market size is estimated to be USD 7.85 Million as of 2022.
5. What are some drivers contributing to market growth?
Increasing Inclusion of E-bikes in the Sharing Fleet.
6. What are the notable trends driving market growth?
E-bike Segment Expected to be the Fastest-growing Segment Over the Forecast Period.
7. Are there any restraints impacting market growth?
Limited Infrastructure May Hinder Market Growth.
8. Can you provide examples of recent developments in the market?
December 2023: The US International Development Finance Corporation (DFC) and IDB Invest announced that they were co-investing a combined USD 23 million in equity in micro-mobility platform Tembici to support the expansion of bicycle-sharing services in Latin America.
9. What pricing options are available for accessing the report?
Pricing options include single-user, multi-user, and enterprise licenses priced at USD 4750, USD 5250, and USD 8750 respectively.
10. Is the market size provided in terms of value or volume?
The market size is provided in terms of value, measured in Million.
11. Are there any specific market keywords associated with the report?
Yes, the market keyword associated with the report is "Bike Sharing Industry," which aids in identifying and referencing the specific market segment covered.
12. How do I determine which pricing option suits my needs best?
The pricing options vary based on user requirements and access needs. Individual users may opt for single-user licenses, while businesses requiring broader access may choose multi-user or enterprise licenses for cost-effective access to the report.
13. Are there any additional resources or data provided in the Bike Sharing Industry report?
While the report offers comprehensive insights, it's advisable to review the specific contents or supplementary materials provided to ascertain if additional resources or data are available.
14. How can I stay updated on further developments or reports in the Bike Sharing Industry?
To stay informed about further developments, trends, and reports in the Bike Sharing Industry, consider subscribing to industry newsletters, following relevant companies and organizations, or regularly checking reputable industry news sources and publications.
Methodology
Step 1 - Identification of Relevant Samples Size from Population Database


Step 2 - Approaches for Defining Global Market Size (Value, Volume* & Price*)

Note*: In applicable scenarios
Step 3 - Data Sources
Primary Research
- Web Analytics
- Survey Reports
- Research Institute
- Latest Research Reports
- Opinion Leaders
Secondary Research
- Annual Reports
- White Paper
- Latest Press Release
- Industry Association
- Paid Database
- Investor Presentations

Step 4 - Data Triangulation
Involves using different sources of information in order to increase the validity of a study
These sources are likely to be stakeholders in a program - participants, other researchers, program staff, other community members, and so on.
Then we put all data in single framework & apply various statistical tools to find out the dynamic on the market.
During the analysis stage, feedback from the stakeholder groups would be compared to determine areas of agreement as well as areas of divergence