Unveiling Bicycle Market Growth Patterns: CAGR Analysis and Forecasts 2025-2033

Bicycle Market by Type (Road Bicycle, Hybrid Bicycle, All Terrain Bicycle, E-bicycle, Other Types), by Distribution Channel (Offline Retail Stores, Online Retail Stores), by North America (United States, Canada, Mexico, Rest of North America), by Europe (United Kingdom, Germany, Spain, France, Italy, Russia, Netherlands, Rest of Europe), by Asia Pacific (China, Japan, India, Australia, Rest of Asia Pacific), by South America (Brazil, Argentina, Chile, Rest of South America), by Middle East and Africa (United Arab Emirates, South Africa, Rest of Middle East and Africa) Forecast 2025-2033

Jun 25 2025
Base Year: 2024

234 Pages
Main Logo

Unveiling Bicycle Market Growth Patterns: CAGR Analysis and Forecasts 2025-2033


Home
Industries
Consumer Goods and Services

Tailored for you

  • In-depth Analysis Tailored to Specified Regions or Segments
  • Company Profiles Customized to User Preferences
  • Comprehensive Insights Focused on Specific Segments or Regions
  • Customized Evaluation of Competitive Landscape to Meet Your Needs
  • Tailored Customization to Address Other Specific Requirements
Ask for customization


Key Insights

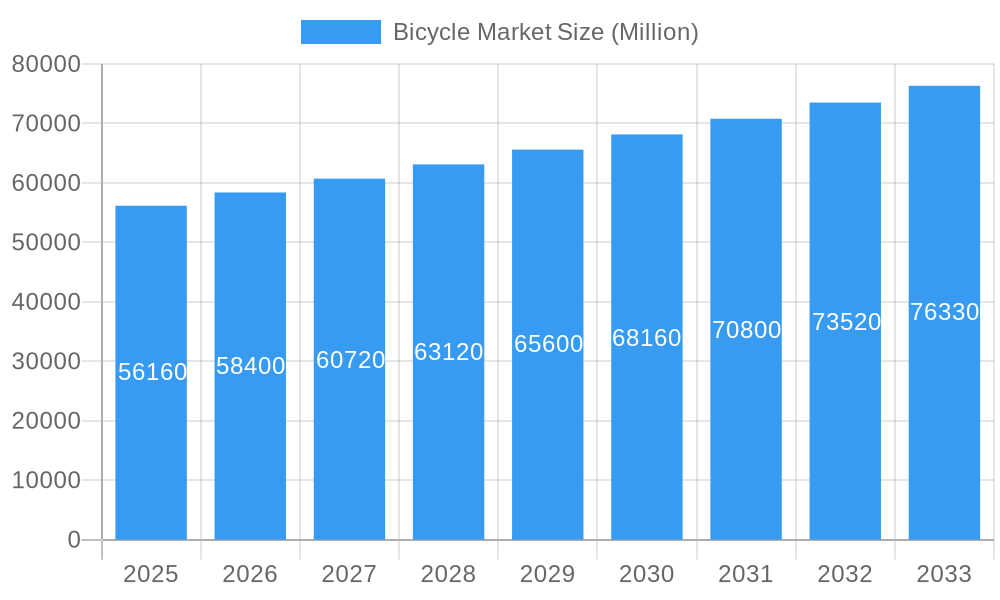
The global bicycle market, valued at $56.16 billion in 2025, is projected to experience robust growth, driven by several key factors. Increasing health consciousness and a shift towards eco-friendly transportation are significantly boosting demand. Government initiatives promoting cycling infrastructure and cycling-friendly urban planning further fuel this growth. The rising popularity of e-bikes, offering a blend of fitness and convenience, is a major segment driver. Furthermore, advancements in bicycle technology, including lighter materials, improved components, and integrated technology, are enhancing the overall user experience and driving consumer preference. The market is segmented by bicycle type (road, hybrid, all-terrain, e-bike, and others) and distribution channel (offline and online retail stores). While offline retail remains dominant, the online segment is witnessing rapid expansion, driven by e-commerce platforms and improved online shopping experiences. Competitive dynamics are shaped by a mix of established global players and regional brands, each focusing on specific segments and geographical markets. Geographic variations in market size reflect the level of cycling infrastructure, consumer preferences, and government support in each region. North America and Europe currently hold significant market shares, but the Asia-Pacific region is expected to demonstrate substantial growth potential in the coming years, fueled by rising disposable incomes and increasing urbanization.
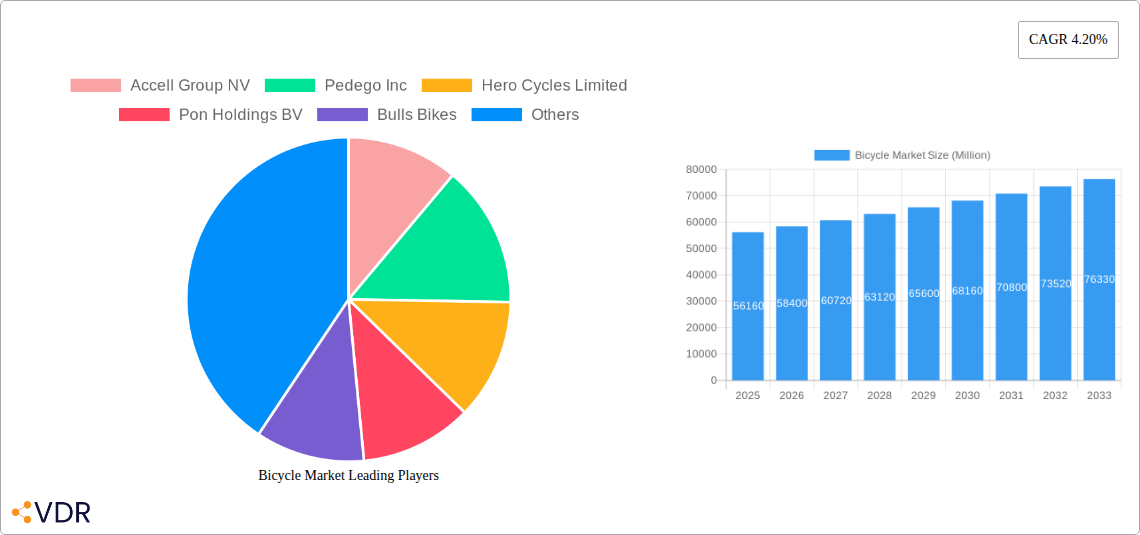
Challenges remain, however. Fluctuations in raw material costs and supply chain disruptions can impact production and pricing. Increasing competition and the need for continuous innovation to meet evolving consumer demands pose ongoing hurdles for market participants. The market's growth trajectory will continue to depend on maintaining a balance between affordability, innovation, and addressing sustainability concerns throughout the production and distribution process. The forecast period (2025-2033) anticipates consistent market expansion, influenced by the interplay of these drivers, trends, and restraints. Growth rates will likely vary across segments and regions, with e-bikes and the Asia-Pacific region expected to outperform others. A diversified product portfolio and a strategic approach to both online and offline sales channels will be crucial for success in this dynamic market.

Bicycle Market Research Report - Market Size, Growth & Forecast

Bicycle Market: A Comprehensive Market Report (2019-2033)

This in-depth report provides a comprehensive analysis of the global bicycle market, encompassing historical data (2019-2024), current estimates (2025), and future forecasts (2025-2033). It delves into market dynamics, growth trends, regional performance, product landscapes, and key players, offering valuable insights for industry professionals, investors, and strategic decision-makers. The report covers both parent and child markets, offering granular detail on various bicycle types and distribution channels. Market size is presented in million units.

Bicycle Market Dynamics & Structure

This section analyzes the competitive landscape, technological advancements, regulatory influences, and market trends within the bicycle industry. The market is characterized by a mix of large multinational corporations and smaller specialized manufacturers. Market concentration is moderate, with a few dominant players holding significant market share, while numerous smaller players cater to niche segments.

  • Market Concentration: The top 5 players account for approximately xx% of the global market (2025 estimate).
  • Technological Innovation: Key innovations include advancements in e-bike technology (e.g., battery life, motor efficiency), lightweight materials, and smart bike features (connectivity, GPS). However, innovation barriers include high R&D costs and the need for skilled workforce.
  • Regulatory Frameworks: Government regulations concerning safety standards, emissions (for e-bikes), and product labeling vary across regions, impacting market access and product development.
  • Competitive Product Substitutes: The primary substitutes are other modes of personal transportation, such as cars, motorcycles, and public transit. Increased urban congestion and environmental concerns are driving demand for bicycles as an alternative.
  • End-User Demographics: The primary end-users are individuals aged 18-55, with a growing segment of older adults utilizing e-bikes for recreational and commuting purposes.
  • M&A Trends: The bicycle market has witnessed a moderate level of mergers and acquisitions (M&A) activity in recent years, with larger companies acquiring smaller players to expand their product portfolio and market reach. The estimated number of M&A deals between 2019-2024 is xx.

Bicycle Market Growth Trends & Insights

The global bicycle market experienced significant growth during the historical period (2019-2024), driven by several factors including increasing health consciousness, growing environmental concerns, and the rising popularity of e-bikes. This trend is expected to continue during the forecast period (2025-2033), albeit at a moderated pace. The market is witnessing a shift towards higher-value products, including e-bikes and specialized bicycles for various activities. Consumer preference for sustainability and increased demand for efficient urban commuting are influencing growth. XXX data suggests a CAGR of xx% during the forecast period. Market penetration of e-bikes is anticipated to reach xx% by 2033.

Bicycle Market Growth

Dominant Regions, Countries, or Segments in Bicycle Market

The North American and European markets currently dominate the global bicycle market, driven by high consumer spending power, well-developed cycling infrastructure, and strong environmental awareness. However, emerging markets in Asia-Pacific (specifically China and India) are experiencing rapid growth due to increasing urbanization, rising disposable incomes, and government initiatives to promote cycling.

Dominant Segments:

  • Type: E-bikes are experiencing the fastest growth, driven by technological advancements and government incentives. Road bicycles maintain a substantial market share, while hybrid and all-terrain bicycles cater to specific user needs.
  • Distribution Channel: Offline retail stores continue to dominate, but online retail channels are gaining traction, particularly for e-bike sales and specialized bicycle parts.

Key Drivers:

  • Government initiatives: Investment in cycling infrastructure (bike lanes, paths) is boosting bicycle adoption in many regions.
  • Economic growth: Rising disposable incomes in developing economies are fueling demand for bicycles.
  • Health and fitness trends: Growing awareness of health and fitness benefits is driving bicycle purchase.

Bicycle Market Product Landscape

The bicycle market offers a diverse range of products, from basic commuter bikes to high-performance road bikes and sophisticated e-bikes. Technological advancements are focused on enhancing performance, safety, and convenience. Features such as lightweight frames, improved braking systems, integrated electronic components, and smart connectivity are becoming increasingly common. Unique selling propositions include features like adjustable handlebars, integrated lighting, and customizable fit.

Key Drivers, Barriers & Challenges in Bicycle Market

Key Drivers:

  • Growing environmental concerns are pushing consumers towards eco-friendly transportation options.
  • Increasing health consciousness is boosting demand for recreational cycling.
  • Technological advancements, particularly in e-bike technology, are expanding market appeal.

Key Challenges:

  • Supply chain disruptions caused by global events (e.g., pandemics, geopolitical conflicts) have impacted bicycle production and availability.
  • Increased raw material costs are putting pressure on pricing.
  • Intense competition from other transportation modes and within the bicycle market itself impacts profitability.

Emerging Opportunities in Bicycle Market

The market presents significant opportunities in developing countries with growing urban populations, expanding e-bike markets, and the development of innovative bicycle sharing programs. Demand for specialized bicycles for niche activities (e.g., gravel cycling, mountain biking) also represents a growth opportunity. Furthermore, integration of smart technology and connectivity features will continue to open new avenues for market expansion.

Growth Accelerators in the Bicycle Market Industry

Technological breakthroughs in e-bike battery technology, the development of advanced materials for lighter and stronger frames, and strategic partnerships between bicycle manufacturers and technology companies are key growth accelerators. Expansion into emerging markets through targeted marketing and distribution strategies will further contribute to market growth.

Key Players Shaping the Bicycle Market Market

  • Accell Group NV
  • Pedego Inc
  • Hero Cycles Limited
  • Pon Holdings BV
  • Bulls Bikes
  • Giant Manufacturing Co Ltd
  • Riese Und Muller Gmbh
  • Benno Bikes LLC
  • Ribble Cycles
  • Trek Bicycle Corporation *List Not Exhaustive

Notable Milestones in Bicycle Market Sector

  • 2020: Increased demand for bicycles due to COVID-19 lockdowns.
  • 2021: Several major bicycle manufacturers announced investments in e-bike production.
  • 2022: Introduction of new e-bike models with enhanced battery technology and features.
  • 2023: Several successful crowdfunding campaigns for innovative bicycle designs. (Specific examples would be added here in the final report)

In-Depth Bicycle Market Market Outlook

The future of the bicycle market is bright, driven by sustained growth in e-bike sales, the expansion of cycling infrastructure in urban areas, and increasing consumer interest in sustainable and healthy transportation options. Strategic partnerships and innovative product development will play a vital role in shaping the market's future trajectory. The market is poised for continued expansion, with the potential for significant growth in emerging markets and the development of new bicycle technologies.

Bicycle Market Segmentation

  • 1. Type
    • 1.1. Road Bicycle
    • 1.2. Hybrid Bicycle
    • 1.3. All Terrain Bicycle
    • 1.4. E-bicycle
    • 1.5. Other Types
  • 2. Distribution Channel
    • 2.1. Offline Retail Stores
    • 2.2. Online Retail Stores

Bicycle Market Segmentation By Geography

  • 1. North America
    • 1.1. United States
    • 1.2. Canada
    • 1.3. Mexico
    • 1.4. Rest of North America
  • 2. Europe
    • 2.1. United Kingdom
    • 2.2. Germany
    • 2.3. Spain
    • 2.4. France
    • 2.5. Italy
    • 2.6. Russia
    • 2.7. Netherlands
    • 2.8. Rest of Europe
  • 3. Asia Pacific
    • 3.1. China
    • 3.2. Japan
    • 3.3. India
    • 3.4. Australia
    • 3.5. Rest of Asia Pacific
  • 4. South America
    • 4.1. Brazil
    • 4.2. Argentina
    • 4.3. Chile
    • 4.4. Rest of South America
  • 5. Middle East and Africa
    • 5.1. United Arab Emirates
    • 5.2. South Africa
    • 5.3. Rest of Middle East and Africa
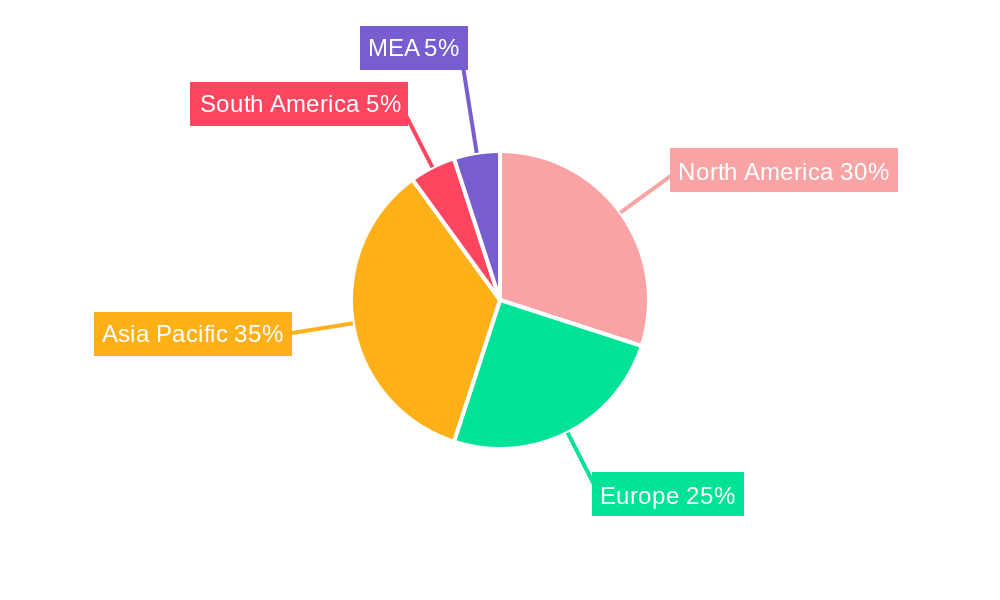
Bicycle Market Regional Share


Bicycle Market REPORT HIGHLIGHTS

AspectsDetails
Study Period 2019-2033
Base Year 2024
Estimated Year 2025
Forecast Period2025-2033
Historical Period2019-2024
Growth RateCAGR of 4.20% from 2019-2033
Segmentation
    • By Type
      • Road Bicycle
      • Hybrid Bicycle
      • All Terrain Bicycle
      • E-bicycle
      • Other Types
    • By Distribution Channel
      • Offline Retail Stores
      • Online Retail Stores
  • By Geography
    • North America
      • United States
      • Canada
      • Mexico
      • Rest of North America
    • Europe
      • United Kingdom
      • Germany
      • Spain
      • France
      • Italy
      • Russia
      • Netherlands
      • Rest of Europe
    • Asia Pacific
      • China
      • Japan
      • India
      • Australia
      • Rest of Asia Pacific
    • South America
      • Brazil
      • Argentina
      • Chile
      • Rest of South America
    • Middle East and Africa
      • United Arab Emirates
      • South Africa
      • Rest of Middle East and Africa


Table of Contents

  1. 1. Introduction
    • 1.1. Research Scope
    • 1.2. Market Segmentation
    • 1.3. Research Methodology
    • 1.4. Definitions and Assumptions
  2. 2. Executive Summary
    • 2.1. Introduction
  3. 3. Market Dynamics
    • 3.1. Introduction
      • 3.2. Market Drivers
        • 3.2.1. Increasing Number of Cycling Events; Growing Health Conscious and Environmentally Friendly Population
      • 3.3. Market Restrains
        • 3.3.1. Availability of Alternative Transport Solutions
      • 3.4. Market Trends
        • 3.4.1. Increasing Number of Cycling Events
  4. 4. Market Factor Analysis
    • 4.1. Porters Five Forces
    • 4.2. Supply/Value Chain
    • 4.3. PESTEL analysis
    • 4.4. Market Entropy
    • 4.5. Patent/Trademark Analysis
  5. 5. Global Bicycle Market Analysis, Insights and Forecast, 2019-2031
    • 5.1. Market Analysis, Insights and Forecast - by Type
      • 5.1.1. Road Bicycle
      • 5.1.2. Hybrid Bicycle
      • 5.1.3. All Terrain Bicycle
      • 5.1.4. E-bicycle
      • 5.1.5. Other Types
    • 5.2. Market Analysis, Insights and Forecast - by Distribution Channel
      • 5.2.1. Offline Retail Stores
      • 5.2.2. Online Retail Stores
    • 5.3. Market Analysis, Insights and Forecast - by Region
      • 5.3.1. North America
      • 5.3.2. Europe
      • 5.3.3. Asia Pacific
      • 5.3.4. South America
      • 5.3.5. Middle East and Africa
  6. 6. North America Bicycle Market Analysis, Insights and Forecast, 2019-2031
    • 6.1. Market Analysis, Insights and Forecast - by Type
      • 6.1.1. Road Bicycle
      • 6.1.2. Hybrid Bicycle
      • 6.1.3. All Terrain Bicycle
      • 6.1.4. E-bicycle
      • 6.1.5. Other Types
    • 6.2. Market Analysis, Insights and Forecast - by Distribution Channel
      • 6.2.1. Offline Retail Stores
      • 6.2.2. Online Retail Stores
  7. 7. Europe Bicycle Market Analysis, Insights and Forecast, 2019-2031
    • 7.1. Market Analysis, Insights and Forecast - by Type
      • 7.1.1. Road Bicycle
      • 7.1.2. Hybrid Bicycle
      • 7.1.3. All Terrain Bicycle
      • 7.1.4. E-bicycle
      • 7.1.5. Other Types
    • 7.2. Market Analysis, Insights and Forecast - by Distribution Channel
      • 7.2.1. Offline Retail Stores
      • 7.2.2. Online Retail Stores
  8. 8. Asia Pacific Bicycle Market Analysis, Insights and Forecast, 2019-2031
    • 8.1. Market Analysis, Insights and Forecast - by Type
      • 8.1.1. Road Bicycle
      • 8.1.2. Hybrid Bicycle
      • 8.1.3. All Terrain Bicycle
      • 8.1.4. E-bicycle
      • 8.1.5. Other Types
    • 8.2. Market Analysis, Insights and Forecast - by Distribution Channel
      • 8.2.1. Offline Retail Stores
      • 8.2.2. Online Retail Stores
  9. 9. South America Bicycle Market Analysis, Insights and Forecast, 2019-2031
    • 9.1. Market Analysis, Insights and Forecast - by Type
      • 9.1.1. Road Bicycle
      • 9.1.2. Hybrid Bicycle
      • 9.1.3. All Terrain Bicycle
      • 9.1.4. E-bicycle
      • 9.1.5. Other Types
    • 9.2. Market Analysis, Insights and Forecast - by Distribution Channel
      • 9.2.1. Offline Retail Stores
      • 9.2.2. Online Retail Stores
  10. 10. Middle East and Africa Bicycle Market Analysis, Insights and Forecast, 2019-2031
    • 10.1. Market Analysis, Insights and Forecast - by Type
      • 10.1.1. Road Bicycle
      • 10.1.2. Hybrid Bicycle
      • 10.1.3. All Terrain Bicycle
      • 10.1.4. E-bicycle
      • 10.1.5. Other Types
    • 10.2. Market Analysis, Insights and Forecast - by Distribution Channel
      • 10.2.1. Offline Retail Stores
      • 10.2.2. Online Retail Stores
  11. 11. North America Bicycle Market Analysis, Insights and Forecast, 2019-2031
      • 11.1. Market Analysis, Insights and Forecast - By Country/Sub-region
        • 11.1.1 United States
        • 11.1.2 Canada
        • 11.1.3 Mexico
  12. 12. Europe Bicycle Market Analysis, Insights and Forecast, 2019-2031
      • 12.1. Market Analysis, Insights and Forecast - By Country/Sub-region
        • 12.1.1 Germany
        • 12.1.2 United Kingdom
        • 12.1.3 France
        • 12.1.4 Spain
        • 12.1.5 Italy
        • 12.1.6 Spain
        • 12.1.7 Belgium
        • 12.1.8 Netherland
        • 12.1.9 Nordics
        • 12.1.10 Rest of Europe
  13. 13. Asia Pacific Bicycle Market Analysis, Insights and Forecast, 2019-2031
      • 13.1. Market Analysis, Insights and Forecast - By Country/Sub-region
        • 13.1.1 China
        • 13.1.2 Japan
        • 13.1.3 India
        • 13.1.4 South Korea
        • 13.1.5 Southeast Asia
        • 13.1.6 Australia
        • 13.1.7 Indonesia
        • 13.1.8 Phillipes
        • 13.1.9 Singapore
        • 13.1.10 Thailandc
        • 13.1.11 Rest of Asia Pacific
  14. 14. South America Bicycle Market Analysis, Insights and Forecast, 2019-2031
      • 14.1. Market Analysis, Insights and Forecast - By Country/Sub-region
        • 14.1.1 Brazil
        • 14.1.2 Argentina
        • 14.1.3 Peru
        • 14.1.4 Chile
        • 14.1.5 Colombia
        • 14.1.6 Ecuador
        • 14.1.7 Venezuela
        • 14.1.8 Rest of South America
  15. 15. North America Bicycle Market Analysis, Insights and Forecast, 2019-2031
      • 15.1. Market Analysis, Insights and Forecast - By Country/Sub-region
        • 15.1.1 United States
        • 15.1.2 Canada
        • 15.1.3 Mexico
  16. 16. MEA Bicycle Market Analysis, Insights and Forecast, 2019-2031
      • 16.1. Market Analysis, Insights and Forecast - By Country/Sub-region
        • 16.1.1 United Arab Emirates
        • 16.1.2 Saudi Arabia
        • 16.1.3 South Africa
        • 16.1.4 Rest of Middle East and Africa
  17. 17. Competitive Analysis
    • 17.1. Global Market Share Analysis 2024
      • 17.2. Company Profiles
        • 17.2.1 Accell Group NV
          • 17.2.1.1. Overview
          • 17.2.1.2. Products
          • 17.2.1.3. SWOT Analysis
          • 17.2.1.4. Recent Developments
          • 17.2.1.5. Financials (Based on Availability)
        • 17.2.2 Pedego Inc
          • 17.2.2.1. Overview
          • 17.2.2.2. Products
          • 17.2.2.3. SWOT Analysis
          • 17.2.2.4. Recent Developments
          • 17.2.2.5. Financials (Based on Availability)
        • 17.2.3 Hero Cycles Limited
          • 17.2.3.1. Overview
          • 17.2.3.2. Products
          • 17.2.3.3. SWOT Analysis
          • 17.2.3.4. Recent Developments
          • 17.2.3.5. Financials (Based on Availability)
        • 17.2.4 Pon Holdings BV
          • 17.2.4.1. Overview
          • 17.2.4.2. Products
          • 17.2.4.3. SWOT Analysis
          • 17.2.4.4. Recent Developments
          • 17.2.4.5. Financials (Based on Availability)
        • 17.2.5 Bulls Bikes
          • 17.2.5.1. Overview
          • 17.2.5.2. Products
          • 17.2.5.3. SWOT Analysis
          • 17.2.5.4. Recent Developments
          • 17.2.5.5. Financials (Based on Availability)
        • 17.2.6 Giant Manufacturing Co Ltd
          • 17.2.6.1. Overview
          • 17.2.6.2. Products
          • 17.2.6.3. SWOT Analysis
          • 17.2.6.4. Recent Developments
          • 17.2.6.5. Financials (Based on Availability)
        • 17.2.7 Riese Und Muller Gmbh*List Not Exhaustive
          • 17.2.7.1. Overview
          • 17.2.7.2. Products
          • 17.2.7.3. SWOT Analysis
          • 17.2.7.4. Recent Developments
          • 17.2.7.5. Financials (Based on Availability)
        • 17.2.8 Benno Bikes LLC
          • 17.2.8.1. Overview
          • 17.2.8.2. Products
          • 17.2.8.3. SWOT Analysis
          • 17.2.8.4. Recent Developments
          • 17.2.8.5. Financials (Based on Availability)
        • 17.2.9 Ribble Cycles
          • 17.2.9.1. Overview
          • 17.2.9.2. Products
          • 17.2.9.3. SWOT Analysis
          • 17.2.9.4. Recent Developments
          • 17.2.9.5. Financials (Based on Availability)
        • 17.2.10 Trek Bicycle Corporation
          • 17.2.10.1. Overview
          • 17.2.10.2. Products
          • 17.2.10.3. SWOT Analysis
          • 17.2.10.4. Recent Developments
          • 17.2.10.5. Financials (Based on Availability)

List of Figures

  1. Figure 1: Global Bicycle Market Revenue Breakdown (Million, %) by Region 2024 & 2032
  2. Figure 2: Global Bicycle Market Volume Breakdown (K Units, %) by Region 2024 & 2032
  3. Figure 3: North America Bicycle Market Revenue (Million), by Country 2024 & 2032
  4. Figure 4: North America Bicycle Market Volume (K Units), by Country 2024 & 2032
  5. Figure 5: North America Bicycle Market Revenue Share (%), by Country 2024 & 2032
  6. Figure 6: North America Bicycle Market Volume Share (%), by Country 2024 & 2032
  7. Figure 7: Europe Bicycle Market Revenue (Million), by Country 2024 & 2032
  8. Figure 8: Europe Bicycle Market Volume (K Units), by Country 2024 & 2032
  9. Figure 9: Europe Bicycle Market Revenue Share (%), by Country 2024 & 2032
  10. Figure 10: Europe Bicycle Market Volume Share (%), by Country 2024 & 2032
  11. Figure 11: Asia Pacific Bicycle Market Revenue (Million), by Country 2024 & 2032
  12. Figure 12: Asia Pacific Bicycle Market Volume (K Units), by Country 2024 & 2032
  13. Figure 13: Asia Pacific Bicycle Market Revenue Share (%), by Country 2024 & 2032
  14. Figure 14: Asia Pacific Bicycle Market Volume Share (%), by Country 2024 & 2032
  15. Figure 15: South America Bicycle Market Revenue (Million), by Country 2024 & 2032
  16. Figure 16: South America Bicycle Market Volume (K Units), by Country 2024 & 2032
  17. Figure 17: South America Bicycle Market Revenue Share (%), by Country 2024 & 2032
  18. Figure 18: South America Bicycle Market Volume Share (%), by Country 2024 & 2032
  19. Figure 19: North America Bicycle Market Revenue (Million), by Country 2024 & 2032
  20. Figure 20: North America Bicycle Market Volume (K Units), by Country 2024 & 2032
  21. Figure 21: North America Bicycle Market Revenue Share (%), by Country 2024 & 2032
  22. Figure 22: North America Bicycle Market Volume Share (%), by Country 2024 & 2032
  23. Figure 23: MEA Bicycle Market Revenue (Million), by Country 2024 & 2032
  24. Figure 24: MEA Bicycle Market Volume (K Units), by Country 2024 & 2032
  25. Figure 25: MEA Bicycle Market Revenue Share (%), by Country 2024 & 2032
  26. Figure 26: MEA Bicycle Market Volume Share (%), by Country 2024 & 2032
  27. Figure 27: North America Bicycle Market Revenue (Million), by Type 2024 & 2032
  28. Figure 28: North America Bicycle Market Volume (K Units), by Type 2024 & 2032
  29. Figure 29: North America Bicycle Market Revenue Share (%), by Type 2024 & 2032
  30. Figure 30: North America Bicycle Market Volume Share (%), by Type 2024 & 2032
  31. Figure 31: North America Bicycle Market Revenue (Million), by Distribution Channel 2024 & 2032
  32. Figure 32: North America Bicycle Market Volume (K Units), by Distribution Channel 2024 & 2032
  33. Figure 33: North America Bicycle Market Revenue Share (%), by Distribution Channel 2024 & 2032
  34. Figure 34: North America Bicycle Market Volume Share (%), by Distribution Channel 2024 & 2032
  35. Figure 35: North America Bicycle Market Revenue (Million), by Country 2024 & 2032
  36. Figure 36: North America Bicycle Market Volume (K Units), by Country 2024 & 2032
  37. Figure 37: North America Bicycle Market Revenue Share (%), by Country 2024 & 2032
  38. Figure 38: North America Bicycle Market Volume Share (%), by Country 2024 & 2032
  39. Figure 39: Europe Bicycle Market Revenue (Million), by Type 2024 & 2032
  40. Figure 40: Europe Bicycle Market Volume (K Units), by Type 2024 & 2032
  41. Figure 41: Europe Bicycle Market Revenue Share (%), by Type 2024 & 2032
  42. Figure 42: Europe Bicycle Market Volume Share (%), by Type 2024 & 2032
  43. Figure 43: Europe Bicycle Market Revenue (Million), by Distribution Channel 2024 & 2032
  44. Figure 44: Europe Bicycle Market Volume (K Units), by Distribution Channel 2024 & 2032
  45. Figure 45: Europe Bicycle Market Revenue Share (%), by Distribution Channel 2024 & 2032
  46. Figure 46: Europe Bicycle Market Volume Share (%), by Distribution Channel 2024 & 2032
  47. Figure 47: Europe Bicycle Market Revenue (Million), by Country 2024 & 2032
  48. Figure 48: Europe Bicycle Market Volume (K Units), by Country 2024 & 2032
  49. Figure 49: Europe Bicycle Market Revenue Share (%), by Country 2024 & 2032
  50. Figure 50: Europe Bicycle Market Volume Share (%), by Country 2024 & 2032
  51. Figure 51: Asia Pacific Bicycle Market Revenue (Million), by Type 2024 & 2032
  52. Figure 52: Asia Pacific Bicycle Market Volume (K Units), by Type 2024 & 2032
  53. Figure 53: Asia Pacific Bicycle Market Revenue Share (%), by Type 2024 & 2032
  54. Figure 54: Asia Pacific Bicycle Market Volume Share (%), by Type 2024 & 2032
  55. Figure 55: Asia Pacific Bicycle Market Revenue (Million), by Distribution Channel 2024 & 2032
  56. Figure 56: Asia Pacific Bicycle Market Volume (K Units), by Distribution Channel 2024 & 2032
  57. Figure 57: Asia Pacific Bicycle Market Revenue Share (%), by Distribution Channel 2024 & 2032
  58. Figure 58: Asia Pacific Bicycle Market Volume Share (%), by Distribution Channel 2024 & 2032
  59. Figure 59: Asia Pacific Bicycle Market Revenue (Million), by Country 2024 & 2032
  60. Figure 60: Asia Pacific Bicycle Market Volume (K Units), by Country 2024 & 2032
  61. Figure 61: Asia Pacific Bicycle Market Revenue Share (%), by Country 2024 & 2032
  62. Figure 62: Asia Pacific Bicycle Market Volume Share (%), by Country 2024 & 2032
  63. Figure 63: South America Bicycle Market Revenue (Million), by Type 2024 & 2032
  64. Figure 64: South America Bicycle Market Volume (K Units), by Type 2024 & 2032
  65. Figure 65: South America Bicycle Market Revenue Share (%), by Type 2024 & 2032
  66. Figure 66: South America Bicycle Market Volume Share (%), by Type 2024 & 2032
  67. Figure 67: South America Bicycle Market Revenue (Million), by Distribution Channel 2024 & 2032
  68. Figure 68: South America Bicycle Market Volume (K Units), by Distribution Channel 2024 & 2032
  69. Figure 69: South America Bicycle Market Revenue Share (%), by Distribution Channel 2024 & 2032
  70. Figure 70: South America Bicycle Market Volume Share (%), by Distribution Channel 2024 & 2032
  71. Figure 71: South America Bicycle Market Revenue (Million), by Country 2024 & 2032
  72. Figure 72: South America Bicycle Market Volume (K Units), by Country 2024 & 2032
  73. Figure 73: South America Bicycle Market Revenue Share (%), by Country 2024 & 2032
  74. Figure 74: South America Bicycle Market Volume Share (%), by Country 2024 & 2032
  75. Figure 75: Middle East and Africa Bicycle Market Revenue (Million), by Type 2024 & 2032
  76. Figure 76: Middle East and Africa Bicycle Market Volume (K Units), by Type 2024 & 2032
  77. Figure 77: Middle East and Africa Bicycle Market Revenue Share (%), by Type 2024 & 2032
  78. Figure 78: Middle East and Africa Bicycle Market Volume Share (%), by Type 2024 & 2032
  79. Figure 79: Middle East and Africa Bicycle Market Revenue (Million), by Distribution Channel 2024 & 2032
  80. Figure 80: Middle East and Africa Bicycle Market Volume (K Units), by Distribution Channel 2024 & 2032
  81. Figure 81: Middle East and Africa Bicycle Market Revenue Share (%), by Distribution Channel 2024 & 2032
  82. Figure 82: Middle East and Africa Bicycle Market Volume Share (%), by Distribution Channel 2024 & 2032
  83. Figure 83: Middle East and Africa Bicycle Market Revenue (Million), by Country 2024 & 2032
  84. Figure 84: Middle East and Africa Bicycle Market Volume (K Units), by Country 2024 & 2032
  85. Figure 85: Middle East and Africa Bicycle Market Revenue Share (%), by Country 2024 & 2032
  86. Figure 86: Middle East and Africa Bicycle Market Volume Share (%), by Country 2024 & 2032

List of Tables

  1. Table 1: Global Bicycle Market Revenue Million Forecast, by Region 2019 & 2032
  2. Table 2: Global Bicycle Market Volume K Units Forecast, by Region 2019 & 2032
  3. Table 3: Global Bicycle Market Revenue Million Forecast, by Type 2019 & 2032
  4. Table 4: Global Bicycle Market Volume K Units Forecast, by Type 2019 & 2032
  5. Table 5: Global Bicycle Market Revenue Million Forecast, by Distribution Channel 2019 & 2032
  6. Table 6: Global Bicycle Market Volume K Units Forecast, by Distribution Channel 2019 & 2032
  7. Table 7: Global Bicycle Market Revenue Million Forecast, by Region 2019 & 2032
  8. Table 8: Global Bicycle Market Volume K Units Forecast, by Region 2019 & 2032
  9. Table 9: Global Bicycle Market Revenue Million Forecast, by Country 2019 & 2032
  10. Table 10: Global Bicycle Market Volume K Units Forecast, by Country 2019 & 2032
  11. Table 11: United States Bicycle Market Revenue (Million) Forecast, by Application 2019 & 2032
  12. Table 12: United States Bicycle Market Volume (K Units) Forecast, by Application 2019 & 2032
  13. Table 13: Canada Bicycle Market Revenue (Million) Forecast, by Application 2019 & 2032
  14. Table 14: Canada Bicycle Market Volume (K Units) Forecast, by Application 2019 & 2032
  15. Table 15: Mexico Bicycle Market Revenue (Million) Forecast, by Application 2019 & 2032
  16. Table 16: Mexico Bicycle Market Volume (K Units) Forecast, by Application 2019 & 2032
  17. Table 17: Global Bicycle Market Revenue Million Forecast, by Country 2019 & 2032
  18. Table 18: Global Bicycle Market Volume K Units Forecast, by Country 2019 & 2032
  19. Table 19: Germany Bicycle Market Revenue (Million) Forecast, by Application 2019 & 2032
  20. Table 20: Germany Bicycle Market Volume (K Units) Forecast, by Application 2019 & 2032
  21. Table 21: United Kingdom Bicycle Market Revenue (Million) Forecast, by Application 2019 & 2032
  22. Table 22: United Kingdom Bicycle Market Volume (K Units) Forecast, by Application 2019 & 2032
  23. Table 23: France Bicycle Market Revenue (Million) Forecast, by Application 2019 & 2032
  24. Table 24: France Bicycle Market Volume (K Units) Forecast, by Application 2019 & 2032
  25. Table 25: Spain Bicycle Market Revenue (Million) Forecast, by Application 2019 & 2032
  26. Table 26: Spain Bicycle Market Volume (K Units) Forecast, by Application 2019 & 2032
  27. Table 27: Italy Bicycle Market Revenue (Million) Forecast, by Application 2019 & 2032
  28. Table 28: Italy Bicycle Market Volume (K Units) Forecast, by Application 2019 & 2032
  29. Table 29: Spain Bicycle Market Revenue (Million) Forecast, by Application 2019 & 2032
  30. Table 30: Spain Bicycle Market Volume (K Units) Forecast, by Application 2019 & 2032
  31. Table 31: Belgium Bicycle Market Revenue (Million) Forecast, by Application 2019 & 2032
  32. Table 32: Belgium Bicycle Market Volume (K Units) Forecast, by Application 2019 & 2032
  33. Table 33: Netherland Bicycle Market Revenue (Million) Forecast, by Application 2019 & 2032
  34. Table 34: Netherland Bicycle Market Volume (K Units) Forecast, by Application 2019 & 2032
  35. Table 35: Nordics Bicycle Market Revenue (Million) Forecast, by Application 2019 & 2032
  36. Table 36: Nordics Bicycle Market Volume (K Units) Forecast, by Application 2019 & 2032
  37. Table 37: Rest of Europe Bicycle Market Revenue (Million) Forecast, by Application 2019 & 2032
  38. Table 38: Rest of Europe Bicycle Market Volume (K Units) Forecast, by Application 2019 & 2032
  39. Table 39: Global Bicycle Market Revenue Million Forecast, by Country 2019 & 2032
  40. Table 40: Global Bicycle Market Volume K Units Forecast, by Country 2019 & 2032
  41. Table 41: China Bicycle Market Revenue (Million) Forecast, by Application 2019 & 2032
  42. Table 42: China Bicycle Market Volume (K Units) Forecast, by Application 2019 & 2032
  43. Table 43: Japan Bicycle Market Revenue (Million) Forecast, by Application 2019 & 2032
  44. Table 44: Japan Bicycle Market Volume (K Units) Forecast, by Application 2019 & 2032
  45. Table 45: India Bicycle Market Revenue (Million) Forecast, by Application 2019 & 2032
  46. Table 46: India Bicycle Market Volume (K Units) Forecast, by Application 2019 & 2032
  47. Table 47: South Korea Bicycle Market Revenue (Million) Forecast, by Application 2019 & 2032
  48. Table 48: South Korea Bicycle Market Volume (K Units) Forecast, by Application 2019 & 2032
  49. Table 49: Southeast Asia Bicycle Market Revenue (Million) Forecast, by Application 2019 & 2032
  50. Table 50: Southeast Asia Bicycle Market Volume (K Units) Forecast, by Application 2019 & 2032
  51. Table 51: Australia Bicycle Market Revenue (Million) Forecast, by Application 2019 & 2032
  52. Table 52: Australia Bicycle Market Volume (K Units) Forecast, by Application 2019 & 2032
  53. Table 53: Indonesia Bicycle Market Revenue (Million) Forecast, by Application 2019 & 2032
  54. Table 54: Indonesia Bicycle Market Volume (K Units) Forecast, by Application 2019 & 2032
  55. Table 55: Phillipes Bicycle Market Revenue (Million) Forecast, by Application 2019 & 2032
  56. Table 56: Phillipes Bicycle Market Volume (K Units) Forecast, by Application 2019 & 2032
  57. Table 57: Singapore Bicycle Market Revenue (Million) Forecast, by Application 2019 & 2032
  58. Table 58: Singapore Bicycle Market Volume (K Units) Forecast, by Application 2019 & 2032
  59. Table 59: Thailandc Bicycle Market Revenue (Million) Forecast, by Application 2019 & 2032
  60. Table 60: Thailandc Bicycle Market Volume (K Units) Forecast, by Application 2019 & 2032
  61. Table 61: Rest of Asia Pacific Bicycle Market Revenue (Million) Forecast, by Application 2019 & 2032
  62. Table 62: Rest of Asia Pacific Bicycle Market Volume (K Units) Forecast, by Application 2019 & 2032
  63. Table 63: Global Bicycle Market Revenue Million Forecast, by Country 2019 & 2032
  64. Table 64: Global Bicycle Market Volume K Units Forecast, by Country 2019 & 2032
  65. Table 65: Brazil Bicycle Market Revenue (Million) Forecast, by Application 2019 & 2032
  66. Table 66: Brazil Bicycle Market Volume (K Units) Forecast, by Application 2019 & 2032
  67. Table 67: Argentina Bicycle Market Revenue (Million) Forecast, by Application 2019 & 2032
  68. Table 68: Argentina Bicycle Market Volume (K Units) Forecast, by Application 2019 & 2032
  69. Table 69: Peru Bicycle Market Revenue (Million) Forecast, by Application 2019 & 2032
  70. Table 70: Peru Bicycle Market Volume (K Units) Forecast, by Application 2019 & 2032
  71. Table 71: Chile Bicycle Market Revenue (Million) Forecast, by Application 2019 & 2032
  72. Table 72: Chile Bicycle Market Volume (K Units) Forecast, by Application 2019 & 2032
  73. Table 73: Colombia Bicycle Market Revenue (Million) Forecast, by Application 2019 & 2032
  74. Table 74: Colombia Bicycle Market Volume (K Units) Forecast, by Application 2019 & 2032
  75. Table 75: Ecuador Bicycle Market Revenue (Million) Forecast, by Application 2019 & 2032
  76. Table 76: Ecuador Bicycle Market Volume (K Units) Forecast, by Application 2019 & 2032
  77. Table 77: Venezuela Bicycle Market Revenue (Million) Forecast, by Application 2019 & 2032
  78. Table 78: Venezuela Bicycle Market Volume (K Units) Forecast, by Application 2019 & 2032
  79. Table 79: Rest of South America Bicycle Market Revenue (Million) Forecast, by Application 2019 & 2032
  80. Table 80: Rest of South America Bicycle Market Volume (K Units) Forecast, by Application 2019 & 2032
  81. Table 81: Global Bicycle Market Revenue Million Forecast, by Country 2019 & 2032
  82. Table 82: Global Bicycle Market Volume K Units Forecast, by Country 2019 & 2032
  83. Table 83: United States Bicycle Market Revenue (Million) Forecast, by Application 2019 & 2032
  84. Table 84: United States Bicycle Market Volume (K Units) Forecast, by Application 2019 & 2032
  85. Table 85: Canada Bicycle Market Revenue (Million) Forecast, by Application 2019 & 2032
  86. Table 86: Canada Bicycle Market Volume (K Units) Forecast, by Application 2019 & 2032
  87. Table 87: Mexico Bicycle Market Revenue (Million) Forecast, by Application 2019 & 2032
  88. Table 88: Mexico Bicycle Market Volume (K Units) Forecast, by Application 2019 & 2032
  89. Table 89: Global Bicycle Market Revenue Million Forecast, by Country 2019 & 2032
  90. Table 90: Global Bicycle Market Volume K Units Forecast, by Country 2019 & 2032
  91. Table 91: United Arab Emirates Bicycle Market Revenue (Million) Forecast, by Application 2019 & 2032
  92. Table 92: United Arab Emirates Bicycle Market Volume (K Units) Forecast, by Application 2019 & 2032
  93. Table 93: Saudi Arabia Bicycle Market Revenue (Million) Forecast, by Application 2019 & 2032
  94. Table 94: Saudi Arabia Bicycle Market Volume (K Units) Forecast, by Application 2019 & 2032
  95. Table 95: South Africa Bicycle Market Revenue (Million) Forecast, by Application 2019 & 2032
  96. Table 96: South Africa Bicycle Market Volume (K Units) Forecast, by Application 2019 & 2032
  97. Table 97: Rest of Middle East and Africa Bicycle Market Revenue (Million) Forecast, by Application 2019 & 2032
  98. Table 98: Rest of Middle East and Africa Bicycle Market Volume (K Units) Forecast, by Application 2019 & 2032
  99. Table 99: Global Bicycle Market Revenue Million Forecast, by Type 2019 & 2032
  100. Table 100: Global Bicycle Market Volume K Units Forecast, by Type 2019 & 2032
  101. Table 101: Global Bicycle Market Revenue Million Forecast, by Distribution Channel 2019 & 2032
  102. Table 102: Global Bicycle Market Volume K Units Forecast, by Distribution Channel 2019 & 2032
  103. Table 103: Global Bicycle Market Revenue Million Forecast, by Country 2019 & 2032
  104. Table 104: Global Bicycle Market Volume K Units Forecast, by Country 2019 & 2032
  105. Table 105: United States Bicycle Market Revenue (Million) Forecast, by Application 2019 & 2032
  106. Table 106: United States Bicycle Market Volume (K Units) Forecast, by Application 2019 & 2032
  107. Table 107: Canada Bicycle Market Revenue (Million) Forecast, by Application 2019 & 2032
  108. Table 108: Canada Bicycle Market Volume (K Units) Forecast, by Application 2019 & 2032
  109. Table 109: Mexico Bicycle Market Revenue (Million) Forecast, by Application 2019 & 2032
  110. Table 110: Mexico Bicycle Market Volume (K Units) Forecast, by Application 2019 & 2032
  111. Table 111: Rest of North America Bicycle Market Revenue (Million) Forecast, by Application 2019 & 2032
  112. Table 112: Rest of North America Bicycle Market Volume (K Units) Forecast, by Application 2019 & 2032
  113. Table 113: Global Bicycle Market Revenue Million Forecast, by Type 2019 & 2032
  114. Table 114: Global Bicycle Market Volume K Units Forecast, by Type 2019 & 2032
  115. Table 115: Global Bicycle Market Revenue Million Forecast, by Distribution Channel 2019 & 2032
  116. Table 116: Global Bicycle Market Volume K Units Forecast, by Distribution Channel 2019 & 2032
  117. Table 117: Global Bicycle Market Revenue Million Forecast, by Country 2019 & 2032
  118. Table 118: Global Bicycle Market Volume K Units Forecast, by Country 2019 & 2032
  119. Table 119: United Kingdom Bicycle Market Revenue (Million) Forecast, by Application 2019 & 2032
  120. Table 120: United Kingdom Bicycle Market Volume (K Units) Forecast, by Application 2019 & 2032
  121. Table 121: Germany Bicycle Market Revenue (Million) Forecast, by Application 2019 & 2032
  122. Table 122: Germany Bicycle Market Volume (K Units) Forecast, by Application 2019 & 2032
  123. Table 123: Spain Bicycle Market Revenue (Million) Forecast, by Application 2019 & 2032
  124. Table 124: Spain Bicycle Market Volume (K Units) Forecast, by Application 2019 & 2032
  125. Table 125: France Bicycle Market Revenue (Million) Forecast, by Application 2019 & 2032
  126. Table 126: France Bicycle Market Volume (K Units) Forecast, by Application 2019 & 2032
  127. Table 127: Italy Bicycle Market Revenue (Million) Forecast, by Application 2019 & 2032
  128. Table 128: Italy Bicycle Market Volume (K Units) Forecast, by Application 2019 & 2032
  129. Table 129: Russia Bicycle Market Revenue (Million) Forecast, by Application 2019 & 2032
  130. Table 130: Russia Bicycle Market Volume (K Units) Forecast, by Application 2019 & 2032
  131. Table 131: Netherlands Bicycle Market Revenue (Million) Forecast, by Application 2019 & 2032
  132. Table 132: Netherlands Bicycle Market Volume (K Units) Forecast, by Application 2019 & 2032
  133. Table 133: Rest of Europe Bicycle Market Revenue (Million) Forecast, by Application 2019 & 2032
  134. Table 134: Rest of Europe Bicycle Market Volume (K Units) Forecast, by Application 2019 & 2032
  135. Table 135: Global Bicycle Market Revenue Million Forecast, by Type 2019 & 2032
  136. Table 136: Global Bicycle Market Volume K Units Forecast, by Type 2019 & 2032
  137. Table 137: Global Bicycle Market Revenue Million Forecast, by Distribution Channel 2019 & 2032
  138. Table 138: Global Bicycle Market Volume K Units Forecast, by Distribution Channel 2019 & 2032
  139. Table 139: Global Bicycle Market Revenue Million Forecast, by Country 2019 & 2032
  140. Table 140: Global Bicycle Market Volume K Units Forecast, by Country 2019 & 2032
  141. Table 141: China Bicycle Market Revenue (Million) Forecast, by Application 2019 & 2032
  142. Table 142: China Bicycle Market Volume (K Units) Forecast, by Application 2019 & 2032
  143. Table 143: Japan Bicycle Market Revenue (Million) Forecast, by Application 2019 & 2032
  144. Table 144: Japan Bicycle Market Volume (K Units) Forecast, by Application 2019 & 2032
  145. Table 145: India Bicycle Market Revenue (Million) Forecast, by Application 2019 & 2032
  146. Table 146: India Bicycle Market Volume (K Units) Forecast, by Application 2019 & 2032
  147. Table 147: Australia Bicycle Market Revenue (Million) Forecast, by Application 2019 & 2032
  148. Table 148: Australia Bicycle Market Volume (K Units) Forecast, by Application 2019 & 2032
  149. Table 149: Rest of Asia Pacific Bicycle Market Revenue (Million) Forecast, by Application 2019 & 2032
  150. Table 150: Rest of Asia Pacific Bicycle Market Volume (K Units) Forecast, by Application 2019 & 2032
  151. Table 151: Global Bicycle Market Revenue Million Forecast, by Type 2019 & 2032
  152. Table 152: Global Bicycle Market Volume K Units Forecast, by Type 2019 & 2032
  153. Table 153: Global Bicycle Market Revenue Million Forecast, by Distribution Channel 2019 & 2032
  154. Table 154: Global Bicycle Market Volume K Units Forecast, by Distribution Channel 2019 & 2032
  155. Table 155: Global Bicycle Market Revenue Million Forecast, by Country 2019 & 2032
  156. Table 156: Global Bicycle Market Volume K Units Forecast, by Country 2019 & 2032
  157. Table 157: Brazil Bicycle Market Revenue (Million) Forecast, by Application 2019 & 2032
  158. Table 158: Brazil Bicycle Market Volume (K Units) Forecast, by Application 2019 & 2032
  159. Table 159: Argentina Bicycle Market Revenue (Million) Forecast, by Application 2019 & 2032
  160. Table 160: Argentina Bicycle Market Volume (K Units) Forecast, by Application 2019 & 2032
  161. Table 161: Chile Bicycle Market Revenue (Million) Forecast, by Application 2019 & 2032
  162. Table 162: Chile Bicycle Market Volume (K Units) Forecast, by Application 2019 & 2032
  163. Table 163: Rest of South America Bicycle Market Revenue (Million) Forecast, by Application 2019 & 2032
  164. Table 164: Rest of South America Bicycle Market Volume (K Units) Forecast, by Application 2019 & 2032
  165. Table 165: Global Bicycle Market Revenue Million Forecast, by Type 2019 & 2032
  166. Table 166: Global Bicycle Market Volume K Units Forecast, by Type 2019 & 2032
  167. Table 167: Global Bicycle Market Revenue Million Forecast, by Distribution Channel 2019 & 2032
  168. Table 168: Global Bicycle Market Volume K Units Forecast, by Distribution Channel 2019 & 2032
  169. Table 169: Global Bicycle Market Revenue Million Forecast, by Country 2019 & 2032
  170. Table 170: Global Bicycle Market Volume K Units Forecast, by Country 2019 & 2032
  171. Table 171: United Arab Emirates Bicycle Market Revenue (Million) Forecast, by Application 2019 & 2032
  172. Table 172: United Arab Emirates Bicycle Market Volume (K Units) Forecast, by Application 2019 & 2032
  173. Table 173: South Africa Bicycle Market Revenue (Million) Forecast, by Application 2019 & 2032
  174. Table 174: South Africa Bicycle Market Volume (K Units) Forecast, by Application 2019 & 2032
  175. Table 175: Rest of Middle East and Africa Bicycle Market Revenue (Million) Forecast, by Application 2019 & 2032
  176. Table 176: Rest of Middle East and Africa Bicycle Market Volume (K Units) Forecast, by Application 2019 & 2032


Frequently Asked Questions

1. What is the projected Compound Annual Growth Rate (CAGR) of the Bicycle Market?

The projected CAGR is approximately 4.20%.

2. Which companies are prominent players in the Bicycle Market?

Key companies in the market include Accell Group NV, Pedego Inc, Hero Cycles Limited, Pon Holdings BV, Bulls Bikes, Giant Manufacturing Co Ltd, Riese Und Muller Gmbh*List Not Exhaustive, Benno Bikes LLC, Ribble Cycles, Trek Bicycle Corporation.

3. What are the main segments of the Bicycle Market?

The market segments include Type, Distribution Channel.

4. Can you provide details about the market size?

The market size is estimated to be USD 56.16 Million as of 2022.

5. What are some drivers contributing to market growth?

Increasing Number of Cycling Events; Growing Health Conscious and Environmentally Friendly Population.

6. What are the notable trends driving market growth?

Increasing Number of Cycling Events.

7. Are there any restraints impacting market growth?

Availability of Alternative Transport Solutions.

8. Can you provide examples of recent developments in the market?

N/A

9. What pricing options are available for accessing the report?

Pricing options include single-user, multi-user, and enterprise licenses priced at USD 4750, USD 5250, and USD 8750 respectively.

10. Is the market size provided in terms of value or volume?

The market size is provided in terms of value, measured in Million and volume, measured in K Units.

11. Are there any specific market keywords associated with the report?

Yes, the market keyword associated with the report is "Bicycle Market," which aids in identifying and referencing the specific market segment covered.

12. How do I determine which pricing option suits my needs best?

The pricing options vary based on user requirements and access needs. Individual users may opt for single-user licenses, while businesses requiring broader access may choose multi-user or enterprise licenses for cost-effective access to the report.

13. Are there any additional resources or data provided in the Bicycle Market report?

While the report offers comprehensive insights, it's advisable to review the specific contents or supplementary materials provided to ascertain if additional resources or data are available.

14. How can I stay updated on further developments or reports in the Bicycle Market?

To stay informed about further developments, trends, and reports in the Bicycle Market, consider subscribing to industry newsletters, following relevant companies and organizations, or regularly checking reputable industry news sources and publications.


Methodology

Step 1 - Identification of Relevant Samples Size from Population Database

Step Chart
Bar Chart
Method Chart

Step 2 - Approaches for Defining Global Market Size (Value, Volume* & Price*)

Approach Chart
Top-down and bottom-up approaches are used to validate the global market size and estimate the market size for manufactures, regional segments, product, and application.

Note*: In applicable scenarios

Step 3 - Data Sources

Primary Research

  • Web Analytics
  • Survey Reports
  • Research Institute
  • Latest Research Reports
  • Opinion Leaders

Secondary Research

  • Annual Reports
  • White Paper
  • Latest Press Release
  • Industry Association
  • Paid Database
  • Investor Presentations
Analyst Chart

Step 4 - Data Triangulation

Involves using different sources of information in order to increase the validity of a study

These sources are likely to be stakeholders in a program - participants, other researchers, program staff, other community members, and so on.

Then we put all data in single framework & apply various statistical tools to find out the dynamic on the market.

During the analysis stage, feedback from the stakeholder groups would be compared to determine areas of agreement as well as areas of divergence

Additionally, after gathering mixed and scattered data from a wide range of sources, data is triangulated and correlated to come up with estimated figures which are further validated through primary mediums or industry experts, opinion leaders.

About Visionary Data Reports

Visionary Data Reports provides future-focused market research, advanced analytics, and strategic insights for technology, healthcare, green energy, and finance. Our reports help you anticipate trends, innovate, and lead in your industry. Our expert team combines primary research, data science, and industry knowledge to deliver actionable intelligence. We offer syndicated reports, custom analytics, and consulting services tailored to your business needs. At Visionary Data Reports, we are committed to quality, transparency, and client satisfaction. Every report is rigorously validated to ensure accuracy and relevance. Our global perspective and forward-thinking approach help you understand both current and emerging market dynamics.

Stay ahead with Visionary Data Reports. Subscribe to our newsletter for the latest insights and research highlights, and follow us on social media for real-time updates. Visionary Data Reports – Your Guide to Tomorrow’s Opportunities.

artwork spiralartwork spiralRelated Reports
artwork underline

Europe E-Commerce Apparel Market 2025-2033: Preparing for Growth and Change

Explore the dynamic Europe E-Commerce Apparel Market, driven by convenience and digital adoption. Discover market size, CAGR, key segments, and growth forecasts from 2019-2033.

September 2025
Base Year: 2024
No Of Pages: 234
Price: $4750

Bath and Shower Products Industry Market Expansion Strategies

Discover the latest market trends and growth projections for the bath & shower products industry. Explore key drivers, regional insights, and competitive analysis in this comprehensive market report covering shower gels, bar soaps, shower oils, and more. Learn about leading brands and future opportunities in this booming sector.

August 2025
Base Year: 2024
No Of Pages: 234
Price: $4750

Exploring Hair Growth Products Industry’s Market Size Dynamics 2025-2033

Discover the booming hair growth products market! Our in-depth analysis reveals a $2.05B market in 2025, projected to reach $4B+ by 2033 with an 8.08% CAGR. Explore key drivers, trends, and regional insights, featuring leading companies like L'Oreal and Shiseido. Learn how to capitalize on this lucrative opportunity.

August 2025
Base Year: 2024
No Of Pages: 234
Price: $4750

Facial Cleanser and Toners Market XX CAGR Growth Outlook 2025-2033

Discover the booming facial cleanser & toner market! Our in-depth analysis reveals a CAGR of 5.20% to 2033, driven by consumer demand and online sales growth. Explore market size, segmentation, key players (Estee Lauder, L'Oreal, Unilever), and regional trends.

August 2025
Base Year: 2024
No Of Pages: 234
Price: $4750

Strategic Analysis of Asia-Pacific Jeans Market Market Growth 2025-2033

Discover the booming Asia-Pacific jeans market! This in-depth analysis reveals a CAGR of 9.60%, driven by rising incomes, evolving trends, and key players like Levi's and Uniqlo. Explore market segmentation, regional insights, and growth projections to 2033.

August 2025
Base Year: 2024
No Of Pages: 210
Price: $4750

Europe E-Cigarettes Market in North America: Market Dynamics and Forecasts 2025-2033

Discover the booming European e-cigarette market! Our comprehensive analysis reveals a 12.90% CAGR, driven by diverse product types, key players like Philip Morris and British American Tobacco, and increasing consumer adoption. Explore market trends, segment breakdowns, and regional insights for 2025-2033.

August 2025
Base Year: 2024
No Of Pages: 234
Price: $4750

Growth Roadmap for US Cosmetics Market Market 2025-2033

Discover the latest trends and insights into the booming US cosmetics market, projected to reach \$116.27 billion by 2033. This comprehensive analysis explores market size, growth drivers, key players (like L'Oréal, Estée Lauder, and Unilever), and emerging trends in skincare, makeup, fragrances, and hair care. Learn how e-commerce and consumer preferences are shaping the future of beauty.

August 2025
Base Year: 2024
No Of Pages: 197
Price: $3800

Europe Men's Grooming Products Market Is Set To Reach XXX Million By 2033, Growing At A CAGR Of XX

Discover the booming European men's grooming market! This in-depth analysis reveals a €1.5B+ market (2025 est.) with a 7.65% CAGR (2025-2033), driven by rising disposable incomes and e-commerce growth. Explore key trends, segments (shaving, skincare, razors), and leading brands.

August 2025
Base Year: 2024
No Of Pages: 234
Price: $4750

Hair Care Industry in Brazil Insights: Growth at XX CAGR Through 2033

Discover the booming Brazilian hair care market! This comprehensive analysis reveals key trends, growth drivers, and market segmentation (shampoo, conditioner, hair color, etc.) from 2019-2033, highlighting top players like L'Oréal, Unilever, and P&G. Explore CAGR projections, distribution channels, and growth opportunities in this dynamic market.

August 2025
Base Year: 2024
No Of Pages: 197
Price: $3800

Asia Pacific Cycling Wear Industry Drivers of Growth: Opportunities to 2033

The Asia-Pacific cycling wear market is booming, projected to reach $44.6 million by 2033 with a 6.29% CAGR. Discover key trends, market segmentation, top players (Pedego, Accell Group, etc.), and regional insights in this comprehensive market analysis. Learn how the rise of e-bikes and health-conscious consumers are driving growth.

August 2025
Base Year: 2024
No Of Pages: 210
Price: $4750

Asia-Pacific Hand Sanitizer Market Trends and Forecast 2025-2033

Discover the booming Asia-Pacific hand sanitizer market forecast (2025-2033)! This comprehensive analysis reveals key growth drivers, trends, and challenges, along with market segmentation by form and distribution channel. Learn about leading companies and regional insights. Explore the impact of the pandemic and future projections for this rapidly expanding sector.

August 2025
Base Year: 2024
No Of Pages: 234
Price: $4750

Strategic Vision for Baseball Accessories Market Market Expansion

Discover the booming baseball accessories market! This comprehensive analysis reveals key trends, growth drivers (7.10% CAGR), top players (Adidas, Nike, Rawlings), and regional insights (North America leading). Learn about market segmentation, challenges, and future projections for 2025-2033.

August 2025
Base Year: 2024
No Of Pages: 234
Price: $4750

USA Sports Luggage Industry Strategic Insights: Analysis 2025 and Forecasts 2033

Discover the booming US sports luggage market! This comprehensive analysis reveals a $1.5B (2025) market with a 10.32% CAGR, driven by rising sports participation and e-commerce. Explore key trends, regional insights, and leading brands shaping this dynamic industry.

August 2025
Base Year: 2024
No Of Pages: 197
Price: $3800

Plant Based Cosmetics Market 2025-2033 Overview: Trends, Dynamics, and Growth Opportunities

Discover the booming plant-based cosmetics market! Explore a $2.84 billion industry with a 6.83% CAGR, driven by sustainability and ethical concerns. Learn about key players, regional trends, and future projections in our comprehensive market analysis.

August 2025
Base Year: 2024
No Of Pages: 234
Price: $4750

Contraceptive Sponges Market Market Growth Fueled by CAGR to XXX Million by 2033

Discover the latest market trends in the contraceptive sponge industry. Our comprehensive analysis reveals a steady growth trajectory driven by increasing demand for convenient, non-hormonal birth control. Learn about market size, key players, regional insights, and future projections for this $XX million market.

August 2025
Base Year: 2024
No Of Pages: 234
Price: $4750

Opportunities in Emerging Cosmetic Products Market Industry Markets

Discover the latest trends and insights in the booming cosmetic products market. This comprehensive analysis reveals a projected CAGR of 4.94%, driven by rising disposable incomes and the power of social media. Explore market segmentation, key players (Estée Lauder, L'Oréal, Shiseido), and regional growth opportunities in this in-depth report covering 2019-2033.

August 2025
Base Year: 2024
No Of Pages: 234
Price: $4750

Strategic Projections for Luxury Footwear Market Market Expansion

Discover the booming luxury footwear market! Explore key trends, growth drivers, and regional insights from our comprehensive market analysis covering brands like Prada, Gucci, and more. Projecting a 6.80% CAGR, learn how this high-end sector is evolving and impacting luxury retail.

August 2025
Base Year: 2024
No Of Pages: 234
Price: $4750

North America Home Fitness Equipment Market Market’s Evolutionary Trends 2025-2033

Discover the booming North American home fitness equipment market! Explore key trends, market size, CAGR, leading brands (Peloton, NordicTrack, Life Fitness), and growth projections through 2033. Learn about the impact of online retail and technological advancements on this dynamic sector.

August 2025
Base Year: 2024
No Of Pages: 234
Price: $4750

Chinese Hair Care Industry Market Size and Trends 2025-2033: Comprehensive Outlook

Discover the booming Chinese hair care market! Our analysis reveals a market exceeding $10 billion in 2025, with a projected CAGR of 4.5% through 2033. Learn about key drivers, trends, restraints, top players (Unilever, L'Oreal, P&G), and the growing influence of online sales.

August 2025
Base Year: 2024
No Of Pages: 197
Price: $3800

MEA E-Commerce Footwear Market 2025 Market Trends and 2033 Forecasts: Exploring Growth Potential

Discover the booming MEA e-commerce footwear market! This comprehensive analysis reveals key trends, growth drivers, and regional insights for 2025-2033, including market size, CAGR, top players (Nike, Adidas, etc.), and segment analysis. Learn how to capitalize on this lucrative opportunity.

August 2025
Base Year: 2024
No Of Pages: 234
Price: $4750

South Africa Hair Care Market Industry Analysis and Consumer Behavior

Discover the booming South Africa hair care market! Our analysis reveals a $496.19 million market in 2025, projected to grow at a 6.18% CAGR until 2033. Explore key drivers, trends, and competitive insights for shampoos, conditioners, hair colorants, and styling products across various distribution channels.

August 2025
Base Year: 2024
No Of Pages: 197
Price: $3800

Sweden Beauty Products Industry Strategic Market Roadmap: Analysis and Forecasts 2025-2033

Discover the booming Swedish beauty products market! Our in-depth analysis reveals a €2 billion market in 2025, projected to grow at a 6.68% CAGR until 2033. Explore key trends, leading brands (Unilever, L'Oréal, etc.), and market segmentation data for color cosmetics, hair care, and more. Invest wisely with our insightful market forecast.

August 2025
Base Year: 2024
No Of Pages: 197
Price: $3800

Consumer-Driven Trends in UK Hair Styling Equipment Market Market

Discover the booming UK hair styling equipment market! This in-depth analysis reveals key trends, growth drivers (social media, tech advancements), and challenges from 2025-2033. Explore market segmentation, leading brands (Dyson, GHD, Conair), and regional insights. Learn how to capitalize on this £150 million market.

August 2025
Base Year: 2024
No Of Pages: 234
Price: $4750

Singapore Goods Market Market’s Evolutionary Trends 2025-2033

Discover the thriving Singapore luxury goods market! This in-depth analysis reveals a 4.64% CAGR, key drivers, market segments (clothing, footwear, jewelry), top brands (LVMH, Kering, Richemont), and future growth projections to 2033. Explore market size, trends, and opportunities in this lucrative sector.

August 2025
Base Year: 2024
No Of Pages: 197
Price: $3800

Understanding Consumer Behavior in Sunglasses Industry Market: 2025-2033

Discover the booming sunglasses market! Explore key trends, growth drivers, and regional insights in our comprehensive analysis, forecasting a CAGR of 6.66% to 2033. Learn about top players, product segments, and future opportunities in this dynamic industry.

August 2025
Base Year: 2024
No Of Pages: 234
Price: $4750

Consumer Trends Driving Footwear Market Market Growth

The global footwear market is booming, projected to reach \$523 billion by 2033, fueled by rising disposable incomes and fitness trends. Explore key market segments, leading brands (Nike, Adidas, Puma), and regional growth insights in our comprehensive analysis.

August 2025
Base Year: 2024
No Of Pages: 197
Price: $3800

Mexico Beauty and Personal Care Market Analysis Uncovered: Market Drivers and Forecasts 2025-2033

Discover the booming Mexico beauty and personal care market! Explore its $11.34B (2025) valuation, 6.05% CAGR, key segments (skincare, haircare, cosmetics), leading brands, and growth drivers. Get insights into market trends and future forecasts.

August 2025
Base Year: 2024
No Of Pages: 197
Price: $3800

Understanding Growth Challenges in Personal Care Electrical Appliances Industry Market 2025-2033

Discover the booming personal care electrical appliances market! This comprehensive analysis reveals a CAGR of 6.62%, driven by rising disposable incomes and innovative product features. Explore market segmentation, regional trends, and key players shaping this dynamic industry. Learn more about growth opportunities in shaving, grooming, epilators and more.

August 2025
Base Year: 2024
No Of Pages: 234
Price: $4750

Leather Goods Market in Europe Market Drivers and Challenges: Trends 2025-2033

Discover the latest trends and growth projections for the European leather goods market. This in-depth analysis covers market size, CAGR, key players (Hermès, LVMH, Kering), segments (footwear, luggage, accessories), and regional insights, forecasting market dynamics from 2025-2033. Learn about the impact of e-commerce and sustainability.

August 2025
Base Year: 2024
No Of Pages: 234
Price: $4750

Argentina Beauty and Personal Care Products Charting Growth Trajectories 2025-2033: Strategic Insights and Forecasts

Discover the booming Argentina beauty and personal care market! This comprehensive analysis reveals a $2.77 billion market (2025) with a projected CAGR of 2.88%, driven by rising incomes and evolving consumer preferences. Explore key trends, segments (oral care, skincare, haircare), leading brands, and future growth forecasts.

August 2025
Base Year: 2024
No Of Pages: 197
Price: $3800

Emerging Opportunities in Hydration Backpacks Market Market

Discover the booming hydration backpack market! This comprehensive analysis reveals a CAGR of 6.40% through 2033, driven by outdoor recreation trends and technological advancements. Explore market segmentation, key players, and regional growth projections for this lucrative industry.

August 2025
Base Year: 2024
No Of Pages: 234
Price: $4750

Strategic Roadmap for South America Beauty Products Market Industry

Discover the booming South American beauty products market! This comprehensive analysis reveals a CAGR of 6.80% from 2025-2033, driven by rising incomes, e-commerce growth, and social media influence. Learn about key players, market segmentation, and regional trends in Brazil, Argentina, and beyond. Explore future opportunities in this dynamic sector.

July 2025
Base Year: 2024
No Of Pages: 234
Price: $4750

European Shampoo Industry Market Expansion: Growth Outlook 2025-2033

Discover the latest trends in the booming European shampoo market. This comprehensive analysis reveals a €X billion market with a 4.10% CAGR, driven by natural products, specialized formulations, and online sales. Learn about key players, segmentation, and future growth projections.

July 2025
Base Year: 2024
No Of Pages: 234
Price: $4750

Exploring Barriers in United States E-cigarettes Market Market: Trends and Analysis 2025-2033

Discover the explosive growth of the US e-cigarette market! This in-depth analysis reveals market size, CAGR, key players like Juul and Philip Morris, and future trends impacting this dynamic industry. Learn about market segments, regulatory challenges, and growth projections to 2033.

July 2025
Base Year: 2024
No Of Pages: 197
Price: $3800

Regional Insights into Hair Shampoo Market in APAC Market Growth

Discover the booming APAC hair shampoo market! Explore its $5 billion valuation, 7.47% CAGR, key segments (anti-dandruff, kids, organic), leading brands, and regional growth projections to 2033. Invest wisely in this dynamic industry.

July 2025
Base Year: 2024
No Of Pages: 234
Price: $4750

Cigarette Market Navigating Dynamics Comprehensive Analysis and Forecasts 2025-2033

Discover the latest insights into the global cigarette market, projected to reach $1.38 billion by 2033 with a 6.60% CAGR. This analysis explores market segmentation, key players (British American Tobacco, Philip Morris, etc.), regional trends, and regulatory impacts shaping this dynamic industry. Learn about growth drivers, restraints, and future market projections.

July 2025
Base Year: 2024
No Of Pages: 234
Price: $4750

Global Male Grooming Appliances Market Trends: Region-Specific Insights 2025-2033

Discover the latest trends in the booming male grooming appliances market. This comprehensive analysis reveals a CAGR of 2.63%, key drivers, regional growth forecasts (North America, Europe, Asia-Pacific), and leading brands like Philips and Wahl. Learn about market segmentation and future opportunities.

July 2025
Base Year: 2024
No Of Pages: 234
Price: $4750

Key Drivers for Colombia Beauty And Personal Care Products Market Market Growth: Projections 2025-2033

Discover the booming Colombia beauty and personal care market! Our analysis reveals a $3.3B market in 2025, projected to grow at a 5.54% CAGR through 2033. Explore key trends, leading companies, and growth opportunities in this dynamic sector.

July 2025
Base Year: 2024
No Of Pages: 197
Price: $3800

Luxury Leather Goods Market Drivers of Growth: Opportunities to 2033

Discover the latest trends and growth projections for the luxury leather goods market (2025-2033). This comprehensive analysis covers market size, CAGR, key players (Adidas, Hermes, LVMH), regional insights, and segmentations. Learn how rising disposable incomes and online retail are driving this lucrative sector.

July 2025
Base Year: 2024
No Of Pages: 234
Price: $4750

Phone Case Industry 2025-2033 Overview: Trends, Competitor Dynamics, and Opportunities

Discover the booming phone case market! Our in-depth analysis reveals a $26B market in 2025, growing at a 5.33% CAGR. Explore key trends, leading brands (OtterBox, Spigen), and regional insights to capitalize on this lucrative opportunity. Learn about premiumization, online retail growth, and future projections to 2033.

July 2025
Base Year: 2024
No Of Pages: 234
Price: $4750

Bangladesh Cleansing Lotion Market 2025-2033 Overview: Trends, Competitor Dynamics, and Opportunities

Discover the booming Bangladesh cleansing lotion market! This comprehensive analysis reveals a CAGR of 11.60% (2025-2033), driven by rising incomes and skincare awareness. Explore market size, segmentation (cream, gel, herbal, etc.), key players (Unilever, Himalaya, etc.), and future growth projections.

July 2025
Base Year: 2024
No Of Pages: 197
Price: $3800

Japan Beauty Industry Strategic Insights: Analysis 2025 and Forecasts 2033

Discover the booming Japan beauty market forecast to 2033! Explore market size, CAGR, key drivers (e.g., skincare, e-commerce), trends, and leading companies like Shiseido and L'Oréal. Get insights into regional market share and growth opportunities in this dynamic industry.

July 2025
Base Year: 2024
No Of Pages: 197
Price: $3800

Latin America Hair Care Market in Focus: Growth Trajectories and Strategic Insights 2025-2033

Discover the booming Latin American hair care market! This in-depth analysis reveals a CAGR of 4.10%, driven by rising incomes, e-commerce growth, and demand for natural products. Learn about key players, market segments (shampoo, conditioner, hair loss treatments, etc.), and regional trends in Brazil, Argentina, and beyond. Forecast to 2033.

July 2025
Base Year: 2024
No Of Pages: 234
Price: $4750

UK Skincare Market Report Probes the XXX Million Size, Share, Growth Report and Future Analysis by 2033

Discover the booming UK skincare market! Our in-depth analysis reveals a £4.14 billion market in 2025, projected to grow at a 2.41% CAGR until 2033. Explore key drivers, trends, and segmentation data, including premium vs. mass skincare, distribution channels, and leading brands.

July 2025
Base Year: 2024
No Of Pages: 197
Price: $3800

Emerging Opportunities in US Organic Skin Care Products Industry Market

Discover the booming US organic skincare market! Our analysis reveals a $5 billion industry projected to reach $7 billion by 2033, driven by consumer demand for natural & sustainable products. Explore market trends, key players, and regional insights.

July 2025
Base Year: 2024
No Of Pages: 197
Price: $3800

Future-Ready Strategies for Middle East and Africa Athletic Footwear Market Market Growth

Discover the booming Middle East & Africa athletic footwear market! This comprehensive analysis reveals a CAGR of 5.32%, driven by rising health awareness and e-commerce growth. Explore key trends, challenges, and leading brands shaping this dynamic sector. Learn more about market segmentation and regional insights.

July 2025
Base Year: 2024
No Of Pages: 234
Price: $4750

Anti-Aging Products Market Market’s Decade-Long Growth Trends and Future Projections 2025-2033

Discover the booming anti-aging products market! This comprehensive analysis reveals a $59.23 billion market (2025) with a 6.62% CAGR, driven by aging populations and innovative skincare trends. Explore key drivers, restraints, regional insights, and leading companies shaping this dynamic industry.

July 2025
Base Year: 2024
No Of Pages: 234
Price: $4750

Germany Hair Care Market: Disruptive Technologies Driving Market Growth 2025-2033

Discover the booming German hair care market! This in-depth analysis reveals key trends, growth drivers, and market segmentation from 2019-2033, focusing on leading brands and regional variations. Learn about the projected market size, CAGR, and top players in the German hair care industry.

July 2025
Base Year: 2024
No Of Pages: 197
Price: $3800

Exploring Regional Dynamics of Asia Pacific Luxury Goods Industry Market 2025-2033

Discover the booming Asia-Pacific luxury goods market! This in-depth analysis reveals a $141.82B (2025) market with a 4.06% CAGR, driven by key players like LVMH and Kering, and booming e-commerce. Explore market trends, regional breakdowns, and future growth projections for clothing, footwear, and more.

July 2025
Base Year: 2024
No Of Pages: 234
Price: $4750

Oil Control Lotion Industry Expected to Reach XXX Million by 2033

Discover the booming oil control lotion market! This comprehensive analysis reveals key trends, drivers, and restraints shaping the industry's growth (CAGR 4.80%) through 2033. Explore regional insights and leading brands dominating this lucrative sector.

July 2025
Base Year: 2024
No Of Pages: 234
Price: $4750
  • Home
  • About Us
  • Industries
    • Aerospace & Defense
    • Agriculture
    • Animal Nutrition & Wellness
    • Automotive
    • Chemicals & Materials
    • Consumer Goods and Services
    • Energy & Power
    • Financial Services and Investment Intelligence
    • Food & Beverage
    • Home and Property Improvement
    • Hospitality and Tourism
    • Logistics
    • Manufacturing Products and Services
    • Packaging
    • Professional and Commercial Services
    • Real Estate and Construction
    • Retail
    • Technology, Media and Telecom
    • Healthcare
  • Services
  • Contact
Main Logo
  • Home
  • About Us
  • Industries
    • Aerospace & Defense
    • Agriculture
    • Animal Nutrition & Wellness
    • Automotive
    • Chemicals & Materials
    • Consumer Goods and Services
    • Energy & Power
    • Financial Services and Investment Intelligence
    • Food & Beverage
    • Home and Property Improvement
    • Hospitality and Tourism
    • Logistics
    • Manufacturing Products and Services
    • Packaging
    • Professional and Commercial Services
    • Real Estate and Construction
    • Retail
    • Technology, Media and Telecom
    • Healthcare
  • Services
  • Contact
+17162654855
[email protected]

+17162654855

[email protected]

Business Address

Head Office

Ansec House 3 rd floor Tank Road, Yerwada, Pune, Maharashtra 411014

Contact Information

Craig Francis

Business Development Head

+17162654855

[email protected]

Secure Payment Partners

payment image
RetailLogisticsPackagingAutomotiveHealthcareAgricultureEnergy & PowerFood & BeverageAerospace & DefenseChemicals & MaterialsHospitality and TourismAnimal Nutrition & WellnessConsumer Goods and ServicesReal Estate and ConstructionHome and Property ImprovementTechnology, Media and TelecomManufacturing Products and ServicesFinancial Services and Investment Intelligence

© 2025 PRDUA Research & Media Private Limited, All rights reserved

Privacy Policy
Terms and Conditions
FAQ