

Key Insights
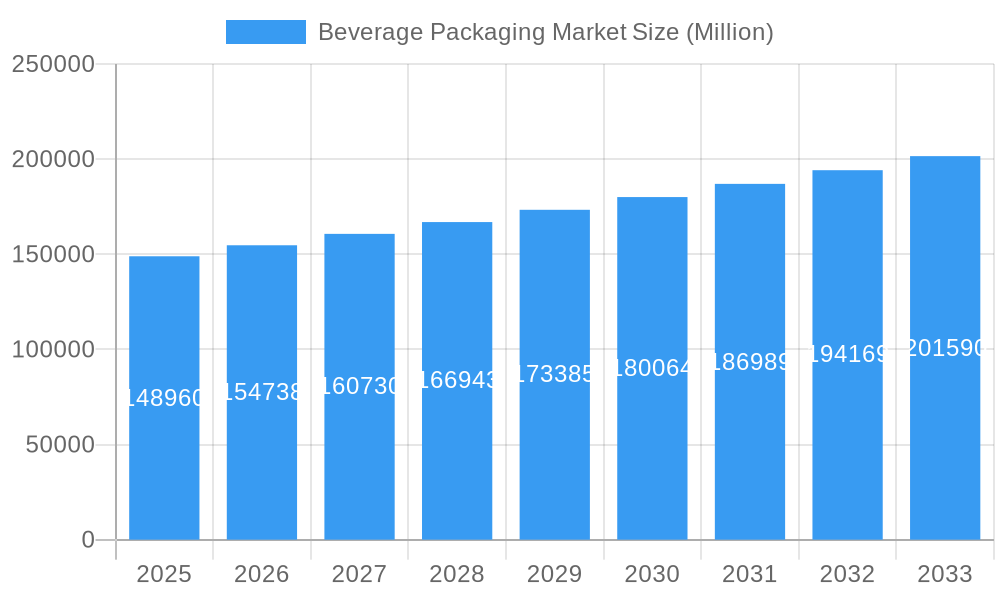
The global beverage packaging market, valued at $148.96 billion in 2025, is projected to experience robust growth, driven by several key factors. The rising consumption of packaged beverages, particularly in developing economies with expanding middle classes, fuels significant demand. Consumer preference shifts towards convenient, on-the-go packaging formats like pouches and cans further stimulate market expansion. Sustainability concerns are also reshaping the industry, with increased adoption of eco-friendly materials like recycled plastics and plant-based alternatives. Furthermore, technological advancements in packaging design and manufacturing processes enhance efficiency and product shelf life, contributing to market growth. Competition among major players like Ardagh Group, Ball Corporation, and Amcor PLC drives innovation and price competitiveness. However, fluctuating raw material prices and stringent environmental regulations present challenges to market growth. The market segmentation reveals plastic remains a dominant material, while bottles and cans maintain their lead in product type. Carbonated drinks, alcoholic beverages, and bottled water constitute the largest application segments. Geographical analysis indicates North America and Europe currently hold significant market share, while Asia-Pacific is poised for substantial growth due to its rising consumption of packaged beverages. The market's trajectory suggests a steady expansion throughout the forecast period (2025-2033), with specific growth rates influenced by regional economic conditions and consumer trends.
Beverage Packaging Market Market Size (In Billion)
Growth within specific segments will vary. For example, the increasing popularity of plant-based beverages is expected to boost demand for suitable packaging solutions, while the continuing emphasis on sustainability will drive innovation in recyclable and biodegradable materials. Regional variations will also be significant, with emerging markets in Asia-Pacific expected to experience faster growth compared to mature markets in North America and Europe. The competitive landscape will remain dynamic, with companies focusing on product diversification, strategic partnerships, and mergers and acquisitions to maintain their market position. Market players will need to adapt to evolving consumer preferences and regulatory changes to succeed in this dynamic environment. A focus on sustainable and innovative packaging solutions will be crucial for future growth and market leadership.
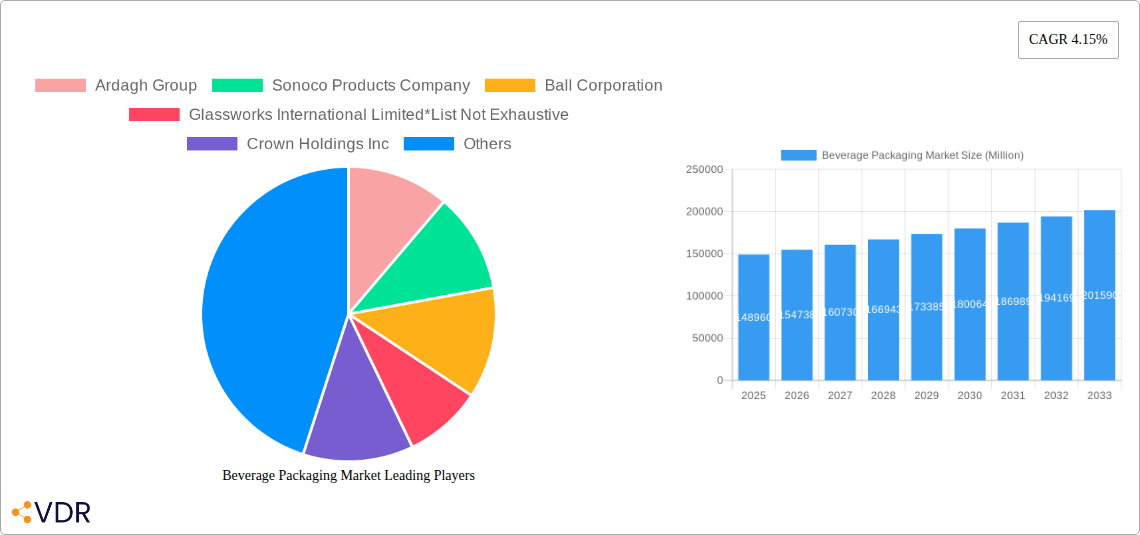
Beverage Packaging Market Company Market Share
Beverage Packaging Market: A Comprehensive Market Report (2019-2033)
This in-depth report provides a comprehensive analysis of the global beverage packaging market, encompassing market dynamics, growth trends, regional performance, product landscape, and key players. The study period covers 2019-2033, with 2025 as the base year and a forecast period spanning 2025-2033. The report is essential for industry professionals, investors, and strategic decision-makers seeking a thorough understanding of this dynamic market. The market is segmented by material type (plastic, metal, glass, paperboard), product type (bottles, cans, pouches, cartons, beer kegs), and application (carbonated drinks, alcoholic beverages, bottled water, milk, fruit & vegetable juices, energy drinks, plant-based drinks, other applications). The market size is valued in million units.
Beverage Packaging Market Dynamics & Structure
The beverage packaging market is characterized by moderate concentration, with several large players holding significant market share. Technological innovation, particularly in sustainable and recyclable materials, is a key driver. Stringent regulatory frameworks regarding recyclability and material composition are shaping market trends. Competitive pressures from substitute materials and packaging types are intensifying. Consumer preferences for convenience, sustainability, and brand aesthetics significantly influence purchasing decisions. M&A activity is moderate, with strategic acquisitions focused on expanding product portfolios and geographical reach.
- Market Concentration: Moderately concentrated, with top 5 players holding approximately xx% market share (2024).
- Technological Innovation: Focus on lightweighting, recyclability, and sustainable materials (e.g., recycled content, bioplastics).
- Regulatory Frameworks: Increasingly stringent regulations on material composition, recyclability, and labeling.
- Competitive Substitutes: Growing competition from flexible packaging and alternative materials.
- End-User Demographics: Shifting consumer preferences towards convenience, health, and sustainability are driving demand for specific packaging types.
- M&A Trends: Strategic acquisitions are aimed at expanding market reach and product diversification; approximately xx M&A deals recorded in the past 5 years.
Beverage Packaging Market Growth Trends & Insights
The global beverage packaging market experienced significant growth during the historical period (2019-2024), driven by rising beverage consumption, particularly in emerging economies. The market is projected to maintain a steady CAGR of xx% during the forecast period (2025-2033), reaching a value of xx million units by 2033. Technological disruptions, such as the introduction of innovative materials and packaging designs, are impacting adoption rates. Consumer behavior shifts towards sustainability are increasingly influencing packaging choices. Market penetration of eco-friendly packaging solutions is expected to grow from xx% in 2025 to xx% by 2033.
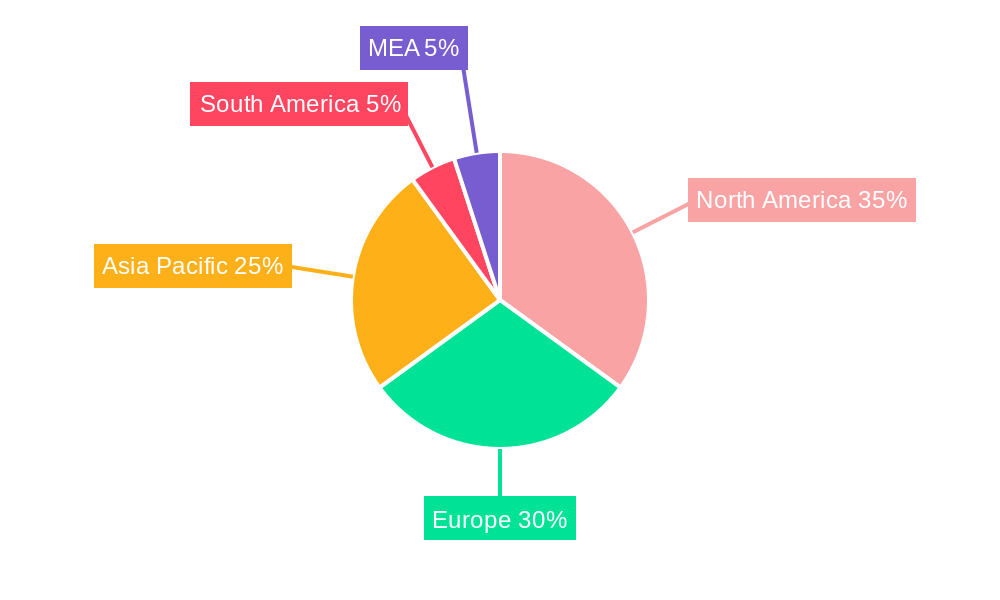
Dominant Regions, Countries, or Segments in Beverage Packaging Market
North America and Europe currently dominate the beverage packaging market, driven by high beverage consumption and established infrastructure. However, Asia-Pacific is poised for rapid growth, fueled by rising disposable incomes and increasing demand for packaged beverages. Within material types, plastic remains the dominant segment due to cost-effectiveness and versatility, although the growth of sustainable alternatives like paperboard and recycled materials is gaining momentum. By product type, bottles and cans continue to hold significant market share but pouches and cartons are showing strong growth in specific beverage applications.
- Leading Regions: North America and Europe currently hold the largest market share.
- High-Growth Regions: Asia-Pacific demonstrates high growth potential due to increasing beverage consumption.
- Dominant Material Type: Plastic dominates due to its cost-effectiveness and versatility.
- Dominant Product Type: Bottles and cans hold the largest market share.
- Key Drivers (Asia-Pacific): Rising disposable incomes, expanding middle class, increased urbanization.
- Key Drivers (North America/Europe): Established infrastructure, high beverage consumption, strong regulatory frameworks promoting sustainability.
Beverage Packaging Market Product Landscape
The beverage packaging market showcases continuous innovation in materials, designs, and functionalities. Lightweighting, improved barrier properties, and enhanced recyclability are key features driving product development. The integration of smart packaging technologies, such as RFID tags and QR codes, is also gaining traction, providing opportunities for enhanced traceability and consumer engagement. Unique selling propositions often revolve around sustainability credentials, ease of use, and aesthetic appeal.
Key Drivers, Barriers & Challenges in Beverage Packaging Market
Key Drivers: Growing beverage consumption globally, increasing demand for convenient and portable packaging, technological advancements in materials and designs, and the growing importance of sustainable and eco-friendly options.
Key Challenges: Fluctuations in raw material prices, stringent environmental regulations, rising transportation costs, and the need for innovative solutions to address plastic waste. Supply chain disruptions have impacted production and delivery timelines, leading to xx% increase in production costs in 2022.
Emerging Opportunities in Beverage Packaging Market
Emerging opportunities lie in sustainable and eco-friendly packaging solutions, the adoption of smart packaging technologies, growth in the plant-based beverage sector, and increasing demand for personalized and customized packaging options. Untapped markets in developing economies present significant growth potential.
Growth Accelerators in the Beverage Packaging Market Industry
Technological breakthroughs in sustainable materials, strategic partnerships to improve recycling infrastructure, and expansion into new markets, particularly in emerging economies, are key growth accelerators. The increasing focus on circular economy principles and sustainable packaging solutions will further drive market growth in the coming years.
Key Players Shaping the Beverage Packaging Market Market
- Ardagh Group
- Sonoco Products Company
- Ball Corporation
- Glassworks International Limited
- Crown Holdings Inc
- Amcor PLC
- Mondi PLC
- Vidrala SA
- Verallia SA
- Silgan Containers LLC
- O-I Glass Inc (Owens-Illinois Inc)
- CCL Container Inc
- Vetropack Holding Ltd
- Berry Global Inc
- Tetra Laval International SA
Notable Milestones in Beverage Packaging Market Sector
- September 2022: Ball Corporation partnered with Boomerang to provide refillable aluminum bottles, promoting sustainability.
- September 2022: Ardagh Glass Packaging Europe collaborated on a new, recyclable glass bottle design for Belvoir Farm, showcasing design innovation.
- June 2022: Stora Enso and Tetra Pak launched a joint initiative to accelerate beverage carton recycling in Benelux, highlighting collaborative efforts in sustainability.
In-Depth Beverage Packaging Market Market Outlook
The beverage packaging market is poised for continued growth, driven by technological advancements, a growing focus on sustainability, and expanding consumer demand. Strategic partnerships and investments in innovative materials and recycling infrastructure will be crucial for success. The market's future potential lies in the development and adoption of truly circular and eco-friendly packaging solutions that meet both consumer demands and environmental concerns.
Beverage Packaging Market Segmentation
-
1. Material Type
- 1.1. Plastic
- 1.2. Metal
- 1.3. Glass
- 1.4. Paperboard
-
2. Product Type
- 2.1. Bottles
- 2.2. Cans
- 2.3. Pouches
- 2.4. Cartons
- 2.5. Beer Kegs
-
3. Application
- 3.1. Carbonated Drinks
- 3.2. Alcoholic Beverages
- 3.3. Bottled Water
- 3.4. Milk
- 3.5. Fruit and Vegetable Juices
- 3.6. Energy Drinks
- 3.7. Plant-based Drinks
- 3.8. Other Applications
Beverage Packaging Market Segmentation By Geography
-
1. North America
- 1.1. United States
- 1.2. Canada
-
2. Europe
- 2.1. United Kingdom
- 2.2. Germany
- 2.3. France
- 2.4. Italy
- 2.5. Spain
- 2.6. Austria
- 2.7. Poland
- 2.8. Russia
- 2.9. Rest of Europe
-
3. Asia Pacific
- 3.1. India
- 3.2. China
- 3.3. Japan
- 3.4. Australia
- 3.5. Rest of Asia Pacific
-
4. Latin America
- 4.1. Mexico
- 4.2. Brazil
- 4.3. Rest of Latin America
-
5. Middle East and Africa
- 5.1. United Arab Emirates
- 5.2. Saudi Arabia
- 5.3. South Africa
- 5.4. Rest of Middle East and Africa
Beverage Packaging Market Regional Market Share
Geographic Coverage of Beverage Packaging Market
Beverage Packaging Market REPORT HIGHLIGHTS
| Aspects | Details |
|---|---|
| Study Period | 2020-2034 |
| Base Year | 2025 |
| Estimated Year | 2026 |
| Forecast Period | 2026-2034 |
| Historical Period | 2020-2025 |
| Growth Rate | CAGR of 4.15% from 2020-2034 |
| Segmentation |
|
Table of Contents
- 1. Introduction
- 1.1. Research Scope
- 1.2. Market Segmentation
- 1.3. Research Objective
- 1.4. Definitions and Assumptions
- 2. Executive Summary
- 2.1. Market Snapshot
- 3. Market Dynamics
- 3.1. Market Drivers
- 3.2. Market Restrains
- 3.3. Market Trends
- 3.4. Market Opportunities
- 4. Market Factor Analysis
- 4.1. Porters Five Forces
- 4.1.1. Bargaining Power of Suppliers
- 4.1.2. Bargaining Power of Buyers
- 4.1.3. Threat of New Entrants
- 4.1.4. Threat of Substitutes
- 4.1.5. Competitive Rivalry
- 4.2. PESTEL analysis
- 4.3. BCG Analysis
- 4.3.1. Stars (High Growth, High Market Share)
- 4.3.2. Cash Cows (Low Growth, High Market Share)
- 4.3.3. Question Mark (High Growth, Low Market Share)
- 4.3.4. Dogs (Low Growth, Low Market Share)
- 4.4. Ansoff Matrix Analysis
- 4.5. Supply Chain Analysis
- 4.6. Regulatory Landscape
- 4.7. Current Market Potential and Opportunity Assessment (TAM–SAM–SOM Framework)
- 4.8. VDR Analyst Note
- 4.1. Porters Five Forces
- 5. Market Analysis, Insights and Forecast 2021-2033
- 5.1. Market Analysis, Insights and Forecast - by Material Type
- 5.1.1. Plastic
- 5.1.2. Metal
- 5.1.3. Glass
- 5.1.4. Paperboard
- 5.2. Market Analysis, Insights and Forecast - by Product Type
- 5.2.1. Bottles
- 5.2.2. Cans
- 5.2.3. Pouches
- 5.2.4. Cartons
- 5.2.5. Beer Kegs
- 5.3. Market Analysis, Insights and Forecast - by Application
- 5.3.1. Carbonated Drinks
- 5.3.2. Alcoholic Beverages
- 5.3.3. Bottled Water
- 5.3.4. Milk
- 5.3.5. Fruit and Vegetable Juices
- 5.3.6. Energy Drinks
- 5.3.7. Plant-based Drinks
- 5.3.8. Other Applications
- 5.4. Market Analysis, Insights and Forecast - by Region
- 5.4.1. North America
- 5.4.2. Europe
- 5.4.3. Asia Pacific
- 5.4.4. Latin America
- 5.4.5. Middle East and Africa
- 5.1. Market Analysis, Insights and Forecast - by Material Type
- 6. Global Beverage Packaging Market Analysis, Insights and Forecast, 2021-2033
- 6.1. Market Analysis, Insights and Forecast - by Material Type
- 6.1.1. Plastic
- 6.1.2. Metal
- 6.1.3. Glass
- 6.1.4. Paperboard
- 6.2. Market Analysis, Insights and Forecast - by Product Type
- 6.2.1. Bottles
- 6.2.2. Cans
- 6.2.3. Pouches
- 6.2.4. Cartons
- 6.2.5. Beer Kegs
- 6.3. Market Analysis, Insights and Forecast - by Application
- 6.3.1. Carbonated Drinks
- 6.3.2. Alcoholic Beverages
- 6.3.3. Bottled Water
- 6.3.4. Milk
- 6.3.5. Fruit and Vegetable Juices
- 6.3.6. Energy Drinks
- 6.3.7. Plant-based Drinks
- 6.3.8. Other Applications
- 6.1. Market Analysis, Insights and Forecast - by Material Type
- 7. North America Beverage Packaging Market Analysis, Insights and Forecast, 2021-2033
- 7.1. Market Analysis, Insights and Forecast - by Material Type
- 7.1.1. Plastic
- 7.1.2. Metal
- 7.1.3. Glass
- 7.1.4. Paperboard
- 7.2. Market Analysis, Insights and Forecast - by Product Type
- 7.2.1. Bottles
- 7.2.2. Cans
- 7.2.3. Pouches
- 7.2.4. Cartons
- 7.2.5. Beer Kegs
- 7.3. Market Analysis, Insights and Forecast - by Application
- 7.3.1. Carbonated Drinks
- 7.3.2. Alcoholic Beverages
- 7.3.3. Bottled Water
- 7.3.4. Milk
- 7.3.5. Fruit and Vegetable Juices
- 7.3.6. Energy Drinks
- 7.3.7. Plant-based Drinks
- 7.3.8. Other Applications
- 7.1. Market Analysis, Insights and Forecast - by Material Type
- 8. Europe Beverage Packaging Market Analysis, Insights and Forecast, 2021-2033
- 8.1. Market Analysis, Insights and Forecast - by Material Type
- 8.1.1. Plastic
- 8.1.2. Metal
- 8.1.3. Glass
- 8.1.4. Paperboard
- 8.2. Market Analysis, Insights and Forecast - by Product Type
- 8.2.1. Bottles
- 8.2.2. Cans
- 8.2.3. Pouches
- 8.2.4. Cartons
- 8.2.5. Beer Kegs
- 8.3. Market Analysis, Insights and Forecast - by Application
- 8.3.1. Carbonated Drinks
- 8.3.2. Alcoholic Beverages
- 8.3.3. Bottled Water
- 8.3.4. Milk
- 8.3.5. Fruit and Vegetable Juices
- 8.3.6. Energy Drinks
- 8.3.7. Plant-based Drinks
- 8.3.8. Other Applications
- 8.1. Market Analysis, Insights and Forecast - by Material Type
- 9. Asia Pacific Beverage Packaging Market Analysis, Insights and Forecast, 2021-2033
- 9.1. Market Analysis, Insights and Forecast - by Material Type
- 9.1.1. Plastic
- 9.1.2. Metal
- 9.1.3. Glass
- 9.1.4. Paperboard
- 9.2. Market Analysis, Insights and Forecast - by Product Type
- 9.2.1. Bottles
- 9.2.2. Cans
- 9.2.3. Pouches
- 9.2.4. Cartons
- 9.2.5. Beer Kegs
- 9.3. Market Analysis, Insights and Forecast - by Application
- 9.3.1. Carbonated Drinks
- 9.3.2. Alcoholic Beverages
- 9.3.3. Bottled Water
- 9.3.4. Milk
- 9.3.5. Fruit and Vegetable Juices
- 9.3.6. Energy Drinks
- 9.3.7. Plant-based Drinks
- 9.3.8. Other Applications
- 9.1. Market Analysis, Insights and Forecast - by Material Type
- 10. Latin America Beverage Packaging Market Analysis, Insights and Forecast, 2021-2033
- 10.1. Market Analysis, Insights and Forecast - by Material Type
- 10.1.1. Plastic
- 10.1.2. Metal
- 10.1.3. Glass
- 10.1.4. Paperboard
- 10.2. Market Analysis, Insights and Forecast - by Product Type
- 10.2.1. Bottles
- 10.2.2. Cans
- 10.2.3. Pouches
- 10.2.4. Cartons
- 10.2.5. Beer Kegs
- 10.3. Market Analysis, Insights and Forecast - by Application
- 10.3.1. Carbonated Drinks
- 10.3.2. Alcoholic Beverages
- 10.3.3. Bottled Water
- 10.3.4. Milk
- 10.3.5. Fruit and Vegetable Juices
- 10.3.6. Energy Drinks
- 10.3.7. Plant-based Drinks
- 10.3.8. Other Applications
- 10.1. Market Analysis, Insights and Forecast - by Material Type
- 11. Middle East and Africa Beverage Packaging Market Analysis, Insights and Forecast, 2021-2033
- 11.1. Market Analysis, Insights and Forecast - by Material Type
- 11.1.1. Plastic
- 11.1.2. Metal
- 11.1.3. Glass
- 11.1.4. Paperboard
- 11.2. Market Analysis, Insights and Forecast - by Product Type
- 11.2.1. Bottles
- 11.2.2. Cans
- 11.2.3. Pouches
- 11.2.4. Cartons
- 11.2.5. Beer Kegs
- 11.3. Market Analysis, Insights and Forecast - by Application
- 11.3.1. Carbonated Drinks
- 11.3.2. Alcoholic Beverages
- 11.3.3. Bottled Water
- 11.3.4. Milk
- 11.3.5. Fruit and Vegetable Juices
- 11.3.6. Energy Drinks
- 11.3.7. Plant-based Drinks
- 11.3.8. Other Applications
- 11.1. Market Analysis, Insights and Forecast - by Material Type
- 12. Competitive Analysis
- 12.1. Company Profiles
- 12.1.1 Ardagh Group
- 12.1.1.1. Company Overview
- 12.1.1.2. Products
- 12.1.1.3. Company Financials
- 12.1.1.4. SWOT Analysis
- 12.1.2 Sonoco Products Company
- 12.1.2.1. Company Overview
- 12.1.2.2. Products
- 12.1.2.3. Company Financials
- 12.1.2.4. SWOT Analysis
- 12.1.3 Ball Corporation
- 12.1.3.1. Company Overview
- 12.1.3.2. Products
- 12.1.3.3. Company Financials
- 12.1.3.4. SWOT Analysis
- 12.1.4 Glassworks International Limited*List Not Exhaustive
- 12.1.4.1. Company Overview
- 12.1.4.2. Products
- 12.1.4.3. Company Financials
- 12.1.4.4. SWOT Analysis
- 12.1.5 Crown Holdings Inc
- 12.1.5.1. Company Overview
- 12.1.5.2. Products
- 12.1.5.3. Company Financials
- 12.1.5.4. SWOT Analysis
- 12.1.6 Amcor PLC
- 12.1.6.1. Company Overview
- 12.1.6.2. Products
- 12.1.6.3. Company Financials
- 12.1.6.4. SWOT Analysis
- 12.1.7 Mondi PLC
- 12.1.7.1. Company Overview
- 12.1.7.2. Products
- 12.1.7.3. Company Financials
- 12.1.7.4. SWOT Analysis
- 12.1.8 Vidrala SA
- 12.1.8.1. Company Overview
- 12.1.8.2. Products
- 12.1.8.3. Company Financials
- 12.1.8.4. SWOT Analysis
- 12.1.9 Verallia SA
- 12.1.9.1. Company Overview
- 12.1.9.2. Products
- 12.1.9.3. Company Financials
- 12.1.9.4. SWOT Analysis
- 12.1.10 Silgan Containers LLC
- 12.1.10.1. Company Overview
- 12.1.10.2. Products
- 12.1.10.3. Company Financials
- 12.1.10.4. SWOT Analysis
- 12.1.11 O-I Glass Inc (Owens-Illinois Inc )
- 12.1.11.1. Company Overview
- 12.1.11.2. Products
- 12.1.11.3. Company Financials
- 12.1.11.4. SWOT Analysis
- 12.1.12 CCL Container Inc
- 12.1.12.1. Company Overview
- 12.1.12.2. Products
- 12.1.12.3. Company Financials
- 12.1.12.4. SWOT Analysis
- 12.1.13 Vetropack Holding Ltd
- 12.1.13.1. Company Overview
- 12.1.13.2. Products
- 12.1.13.3. Company Financials
- 12.1.13.4. SWOT Analysis
- 12.1.14 Berry Global Inc
- 12.1.14.1. Company Overview
- 12.1.14.2. Products
- 12.1.14.3. Company Financials
- 12.1.14.4. SWOT Analysis
- 12.1.15 Tetra Laval International SA
- 12.1.15.1. Company Overview
- 12.1.15.2. Products
- 12.1.15.3. Company Financials
- 12.1.15.4. SWOT Analysis
- 12.1.1 Ardagh Group
- 12.2. Market Entropy
- 12.2.1 Company's Key Areas Served
- 12.2.2 Recent Developments
- 12.3. Company Market Share Analysis 2025
- 12.3.1 Top 5 Companies Market Share Analysis
- 12.3.2 Top 3 Companies Market Share Analysis
- 12.4. List of Potential Customers
- 13. Research Methodology
List of Figures
- Figure 1: Global Beverage Packaging Market Revenue Breakdown (Million, %) by Region 2025 & 2033
- Figure 2: North America Beverage Packaging Market Revenue (Million), by Material Type 2025 & 2033
- Figure 3: North America Beverage Packaging Market Revenue Share (%), by Material Type 2025 & 2033
- Figure 4: North America Beverage Packaging Market Revenue (Million), by Product Type 2025 & 2033
- Figure 5: North America Beverage Packaging Market Revenue Share (%), by Product Type 2025 & 2033
- Figure 6: North America Beverage Packaging Market Revenue (Million), by Application 2025 & 2033
- Figure 7: North America Beverage Packaging Market Revenue Share (%), by Application 2025 & 2033
- Figure 8: North America Beverage Packaging Market Revenue (Million), by Country 2025 & 2033
- Figure 9: North America Beverage Packaging Market Revenue Share (%), by Country 2025 & 2033
- Figure 10: Europe Beverage Packaging Market Revenue (Million), by Material Type 2025 & 2033
- Figure 11: Europe Beverage Packaging Market Revenue Share (%), by Material Type 2025 & 2033
- Figure 12: Europe Beverage Packaging Market Revenue (Million), by Product Type 2025 & 2033
- Figure 13: Europe Beverage Packaging Market Revenue Share (%), by Product Type 2025 & 2033
- Figure 14: Europe Beverage Packaging Market Revenue (Million), by Application 2025 & 2033
- Figure 15: Europe Beverage Packaging Market Revenue Share (%), by Application 2025 & 2033
- Figure 16: Europe Beverage Packaging Market Revenue (Million), by Country 2025 & 2033
- Figure 17: Europe Beverage Packaging Market Revenue Share (%), by Country 2025 & 2033
- Figure 18: Asia Pacific Beverage Packaging Market Revenue (Million), by Material Type 2025 & 2033
- Figure 19: Asia Pacific Beverage Packaging Market Revenue Share (%), by Material Type 2025 & 2033
- Figure 20: Asia Pacific Beverage Packaging Market Revenue (Million), by Product Type 2025 & 2033
- Figure 21: Asia Pacific Beverage Packaging Market Revenue Share (%), by Product Type 2025 & 2033
- Figure 22: Asia Pacific Beverage Packaging Market Revenue (Million), by Application 2025 & 2033
- Figure 23: Asia Pacific Beverage Packaging Market Revenue Share (%), by Application 2025 & 2033
- Figure 24: Asia Pacific Beverage Packaging Market Revenue (Million), by Country 2025 & 2033
- Figure 25: Asia Pacific Beverage Packaging Market Revenue Share (%), by Country 2025 & 2033
- Figure 26: Latin America Beverage Packaging Market Revenue (Million), by Material Type 2025 & 2033
- Figure 27: Latin America Beverage Packaging Market Revenue Share (%), by Material Type 2025 & 2033
- Figure 28: Latin America Beverage Packaging Market Revenue (Million), by Product Type 2025 & 2033
- Figure 29: Latin America Beverage Packaging Market Revenue Share (%), by Product Type 2025 & 2033
- Figure 30: Latin America Beverage Packaging Market Revenue (Million), by Application 2025 & 2033
- Figure 31: Latin America Beverage Packaging Market Revenue Share (%), by Application 2025 & 2033
- Figure 32: Latin America Beverage Packaging Market Revenue (Million), by Country 2025 & 2033
- Figure 33: Latin America Beverage Packaging Market Revenue Share (%), by Country 2025 & 2033
- Figure 34: Middle East and Africa Beverage Packaging Market Revenue (Million), by Material Type 2025 & 2033
- Figure 35: Middle East and Africa Beverage Packaging Market Revenue Share (%), by Material Type 2025 & 2033
- Figure 36: Middle East and Africa Beverage Packaging Market Revenue (Million), by Product Type 2025 & 2033
- Figure 37: Middle East and Africa Beverage Packaging Market Revenue Share (%), by Product Type 2025 & 2033
- Figure 38: Middle East and Africa Beverage Packaging Market Revenue (Million), by Application 2025 & 2033
- Figure 39: Middle East and Africa Beverage Packaging Market Revenue Share (%), by Application 2025 & 2033
- Figure 40: Middle East and Africa Beverage Packaging Market Revenue (Million), by Country 2025 & 2033
- Figure 41: Middle East and Africa Beverage Packaging Market Revenue Share (%), by Country 2025 & 2033
List of Tables
- Table 1: Global Beverage Packaging Market Revenue Million Forecast, by Material Type 2020 & 2033
- Table 2: Global Beverage Packaging Market Revenue Million Forecast, by Product Type 2020 & 2033
- Table 3: Global Beverage Packaging Market Revenue Million Forecast, by Application 2020 & 2033
- Table 4: Global Beverage Packaging Market Revenue Million Forecast, by Region 2020 & 2033
- Table 5: Global Beverage Packaging Market Revenue Million Forecast, by Material Type 2020 & 2033
- Table 6: Global Beverage Packaging Market Revenue Million Forecast, by Product Type 2020 & 2033
- Table 7: Global Beverage Packaging Market Revenue Million Forecast, by Application 2020 & 2033
- Table 8: Global Beverage Packaging Market Revenue Million Forecast, by Country 2020 & 2033
- Table 9: United States Beverage Packaging Market Revenue (Million) Forecast, by Application 2020 & 2033
- Table 10: Canada Beverage Packaging Market Revenue (Million) Forecast, by Application 2020 & 2033
- Table 11: Global Beverage Packaging Market Revenue Million Forecast, by Material Type 2020 & 2033
- Table 12: Global Beverage Packaging Market Revenue Million Forecast, by Product Type 2020 & 2033
- Table 13: Global Beverage Packaging Market Revenue Million Forecast, by Application 2020 & 2033
- Table 14: Global Beverage Packaging Market Revenue Million Forecast, by Country 2020 & 2033
- Table 15: United Kingdom Beverage Packaging Market Revenue (Million) Forecast, by Application 2020 & 2033
- Table 16: Germany Beverage Packaging Market Revenue (Million) Forecast, by Application 2020 & 2033
- Table 17: France Beverage Packaging Market Revenue (Million) Forecast, by Application 2020 & 2033
- Table 18: Italy Beverage Packaging Market Revenue (Million) Forecast, by Application 2020 & 2033
- Table 19: Spain Beverage Packaging Market Revenue (Million) Forecast, by Application 2020 & 2033
- Table 20: Austria Beverage Packaging Market Revenue (Million) Forecast, by Application 2020 & 2033
- Table 21: Poland Beverage Packaging Market Revenue (Million) Forecast, by Application 2020 & 2033
- Table 22: Russia Beverage Packaging Market Revenue (Million) Forecast, by Application 2020 & 2033
- Table 23: Rest of Europe Beverage Packaging Market Revenue (Million) Forecast, by Application 2020 & 2033
- Table 24: Global Beverage Packaging Market Revenue Million Forecast, by Material Type 2020 & 2033
- Table 25: Global Beverage Packaging Market Revenue Million Forecast, by Product Type 2020 & 2033
- Table 26: Global Beverage Packaging Market Revenue Million Forecast, by Application 2020 & 2033
- Table 27: Global Beverage Packaging Market Revenue Million Forecast, by Country 2020 & 2033
- Table 28: India Beverage Packaging Market Revenue (Million) Forecast, by Application 2020 & 2033
- Table 29: China Beverage Packaging Market Revenue (Million) Forecast, by Application 2020 & 2033
- Table 30: Japan Beverage Packaging Market Revenue (Million) Forecast, by Application 2020 & 2033
- Table 31: Australia Beverage Packaging Market Revenue (Million) Forecast, by Application 2020 & 2033
- Table 32: Rest of Asia Pacific Beverage Packaging Market Revenue (Million) Forecast, by Application 2020 & 2033
- Table 33: Global Beverage Packaging Market Revenue Million Forecast, by Material Type 2020 & 2033
- Table 34: Global Beverage Packaging Market Revenue Million Forecast, by Product Type 2020 & 2033
- Table 35: Global Beverage Packaging Market Revenue Million Forecast, by Application 2020 & 2033
- Table 36: Global Beverage Packaging Market Revenue Million Forecast, by Country 2020 & 2033
- Table 37: Mexico Beverage Packaging Market Revenue (Million) Forecast, by Application 2020 & 2033
- Table 38: Brazil Beverage Packaging Market Revenue (Million) Forecast, by Application 2020 & 2033
- Table 39: Rest of Latin America Beverage Packaging Market Revenue (Million) Forecast, by Application 2020 & 2033
- Table 40: Global Beverage Packaging Market Revenue Million Forecast, by Material Type 2020 & 2033
- Table 41: Global Beverage Packaging Market Revenue Million Forecast, by Product Type 2020 & 2033
- Table 42: Global Beverage Packaging Market Revenue Million Forecast, by Application 2020 & 2033
- Table 43: Global Beverage Packaging Market Revenue Million Forecast, by Country 2020 & 2033
- Table 44: United Arab Emirates Beverage Packaging Market Revenue (Million) Forecast, by Application 2020 & 2033
- Table 45: Saudi Arabia Beverage Packaging Market Revenue (Million) Forecast, by Application 2020 & 2033
- Table 46: South Africa Beverage Packaging Market Revenue (Million) Forecast, by Application 2020 & 2033
- Table 47: Rest of Middle East and Africa Beverage Packaging Market Revenue (Million) Forecast, by Application 2020 & 2033
Frequently Asked Questions
1. What is the projected Compound Annual Growth Rate (CAGR) of the Beverage Packaging Market?
The projected CAGR is approximately 4.15%.
2. Which companies are prominent players in the Beverage Packaging Market?
Key companies in the market include Ardagh Group, Sonoco Products Company, Ball Corporation, Glassworks International Limited*List Not Exhaustive, Crown Holdings Inc, Amcor PLC, Mondi PLC, Vidrala SA, Verallia SA, Silgan Containers LLC, O-I Glass Inc (Owens-Illinois Inc ), CCL Container Inc, Vetropack Holding Ltd, Berry Global Inc, Tetra Laval International SA.
3. What are the main segments of the Beverage Packaging Market?
The market segments include Material Type, Product Type, Application.
4. Can you provide details about the market size?
The market size is estimated to be USD 148.96 Million as of 2022.
5. What are some drivers contributing to market growth?
Product Innovations like Downsizing Coupled with Cost Reduction; Changing Demographic and Lifestyle Factors.
6. What are the notable trends driving market growth?
Bottled Water to Drive the Market.
7. Are there any restraints impacting market growth?
Environmental Risks Associated with Container Glass Manufacturing.
8. Can you provide examples of recent developments in the market?
September 2022 - Ball Corporation partnered with Boomerang, a water bottling technology developer, to provide refillable aluminum bottles. The ball corporation will supply its aluminum bottles for the Boomerang Bottling System, which is intended to help meet the demand for sustainable beverage packaging at resorts, cruise ships, campuses, and elsewhere. The partners aim to reduce waste and carbon emissions created in the production and transportation of traditional bottles.
9. What pricing options are available for accessing the report?
Pricing options include single-user, multi-user, and enterprise licenses priced at USD 4750, USD 5250, and USD 8750 respectively.
10. Is the market size provided in terms of value or volume?
The market size is provided in terms of value, measured in Million.
11. Are there any specific market keywords associated with the report?
Yes, the market keyword associated with the report is "Beverage Packaging Market," which aids in identifying and referencing the specific market segment covered.
12. How do I determine which pricing option suits my needs best?
The pricing options vary based on user requirements and access needs. Individual users may opt for single-user licenses, while businesses requiring broader access may choose multi-user or enterprise licenses for cost-effective access to the report.
13. Are there any additional resources or data provided in the Beverage Packaging Market report?
While the report offers comprehensive insights, it's advisable to review the specific contents or supplementary materials provided to ascertain if additional resources or data are available.
14. How can I stay updated on further developments or reports in the Beverage Packaging Market?
To stay informed about further developments, trends, and reports in the Beverage Packaging Market, consider subscribing to industry newsletters, following relevant companies and organizations, or regularly checking reputable industry news sources and publications.
Methodology
Step 1 - Identification of Relevant Samples Size from Population Database


Step 2 - Approaches for Defining Global Market Size (Value, Volume* & Price*)

Note*: In applicable scenarios
Step 3 - Data Sources
Primary Research
- Web Analytics
- Survey Reports
- Research Institute
- Latest Research Reports
- Opinion Leaders
Secondary Research
- Annual Reports
- White Paper
- Latest Press Release
- Industry Association
- Paid Database
- Investor Presentations

Step 4 - Data Triangulation
Involves using different sources of information in order to increase the validity of a study
These sources are likely to be stakeholders in a program - participants, other researchers, program staff, other community members, and so on.
Then we put all data in single framework & apply various statistical tools to find out the dynamic on the market.
During the analysis stage, feedback from the stakeholder groups would be compared to determine areas of agreement as well as areas of divergence