

Key Insights
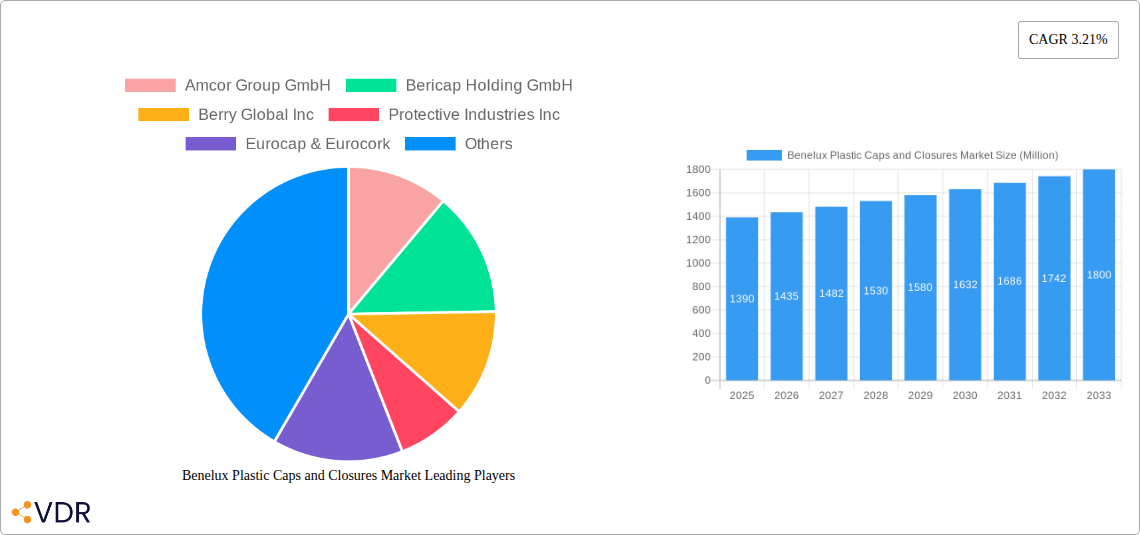
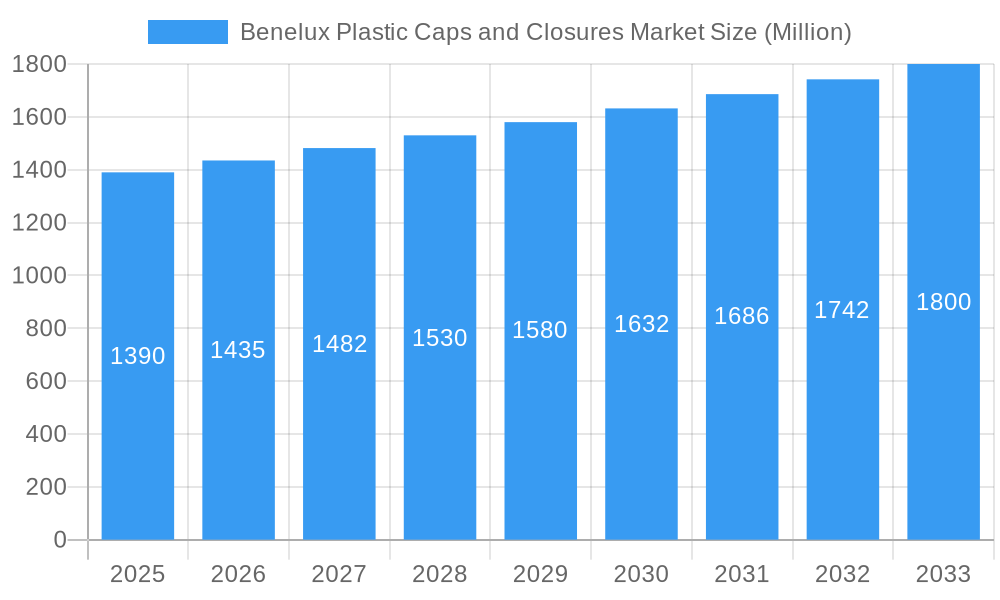
The Benelux plastic caps and closures market, valued at €1.39 billion in 2025, is projected to experience steady growth, driven by the robust food and beverage, pharmaceutical, and personal care industries within the region. A Compound Annual Growth Rate (CAGR) of 3.21% from 2025 to 2033 indicates a significant market expansion over the forecast period. Key drivers include increasing demand for convenient packaging solutions, stringent regulations on hygiene and product safety, and the rising popularity of plastic packaging due to its cost-effectiveness and versatility. Furthermore, the market benefits from innovation in materials, particularly sustainable and recyclable options, responding to growing environmental concerns. However, fluctuating raw material prices and the increasing preference for alternative packaging materials pose challenges to market expansion. The competitive landscape is characterized by a mix of established multinational corporations and smaller regional players, each focusing on specific segments to cater to niche demands. The market's segmentation encompasses various closure types (e.g., screw caps, flip-tops, tamper-evident closures), materials (e.g., HDPE, PP, PET), and end-use applications, creating opportunities for specialized companies. Growth is expected to be particularly strong in segments associated with sustainable and eco-friendly packaging, reflecting the region's focus on environmental sustainability.
Benelux Plastic Caps and Closures Market Market Size (In Billion)
The Benelux region's thriving economy and its strategic location contribute to its strong position in the European plastic caps and closures market. Companies operating within this market are actively engaging in research and development to introduce new closure designs with improved functionality and sustainability. The adoption of advanced manufacturing technologies and automation is also expected to improve efficiency and reduce production costs. While competition is intense, the market offers ample opportunity for companies that can effectively leverage technological advancements, offer sustainable solutions, and establish strong relationships with key customers across various industry verticals within the Benelux region. The projected market size in 2033 can be estimated by applying the CAGR to the 2025 value, leading to significant revenue opportunities for players in this dynamic market.
Benelux Plastic Caps and Closures Market Company Market Share
Benelux Plastic Caps and Closures Market Report: 2019-2033
This comprehensive report provides a detailed analysis of the Benelux plastic caps and closures market, offering invaluable insights for industry professionals, investors, and strategic decision-makers. The report covers the period 2019-2033, with a focus on the forecast period 2025-2033 and a base year of 2025. The market is segmented by material type, application, and end-use industry, providing a granular understanding of its structure and dynamics. Key players like Amcor Group GmbH, Bericap Holding GmbH, Berry Global Inc., Protective Industries Inc., Eurocap & Eurocork, Berlin Packaging Netherlands, Keizer International BV, and Kornelis Caps & Closures are analyzed in detail. The report utilizes a combination of qualitative and quantitative data, incorporating heat map analysis and competitor profiling (emerging vs. established players) to present a holistic view of the market. Total market value in Million units is presented throughout.
Benelux Plastic Caps and Closures Market Dynamics & Structure
This section analyzes the market concentration, examining the market share of key players and identifying dominant firms. It explores the influence of technological innovations, regulatory changes (e.g., plastic waste reduction policies), and the presence of competitive substitutes (e.g., alternative packaging materials). The analysis also considers the end-user demographics driving demand (e.g., food & beverage, pharmaceutical, personal care) and trends in mergers and acquisitions (M&A) activity within the industry.
- Market Concentration: xx% of the market is controlled by the top 5 players in 2025.
- Technological Innovation: Focus on lightweighting, sustainable materials (recycled content), and improved sealing technologies.
- Regulatory Framework: Analysis of EU directives influencing plastic packaging and waste management impacting the industry.
- Competitive Substitutes: Assessment of the market share of alternative closures and packaging solutions.
- M&A Activity: Review of recent mergers, acquisitions, and joint ventures, with an estimate of xx deals in the historical period.
Benelux Plastic Caps and Closures Market Growth Trends & Insights
This section details the historical and projected growth of the Benelux plastic caps and closures market, using robust data analysis to determine the Compound Annual Growth Rate (CAGR) and market penetration rates. It examines the impact of technological disruptions (e.g., automation in manufacturing) and shifts in consumer behavior (e.g., demand for eco-friendly packaging) on market dynamics. The analysis leverages proprietary data and external sources for the most accurate picture.
- Market Size Evolution (Million Units): 2019: xx; 2024: xx; 2025: xx (Estimated); 2033: xx (Forecast).
- CAGR (2025-2033): xx%
- Market Penetration: Analysis of penetration across various end-use segments.
- Technological Disruptions: Impact of automation, smart packaging, and material science advancements.
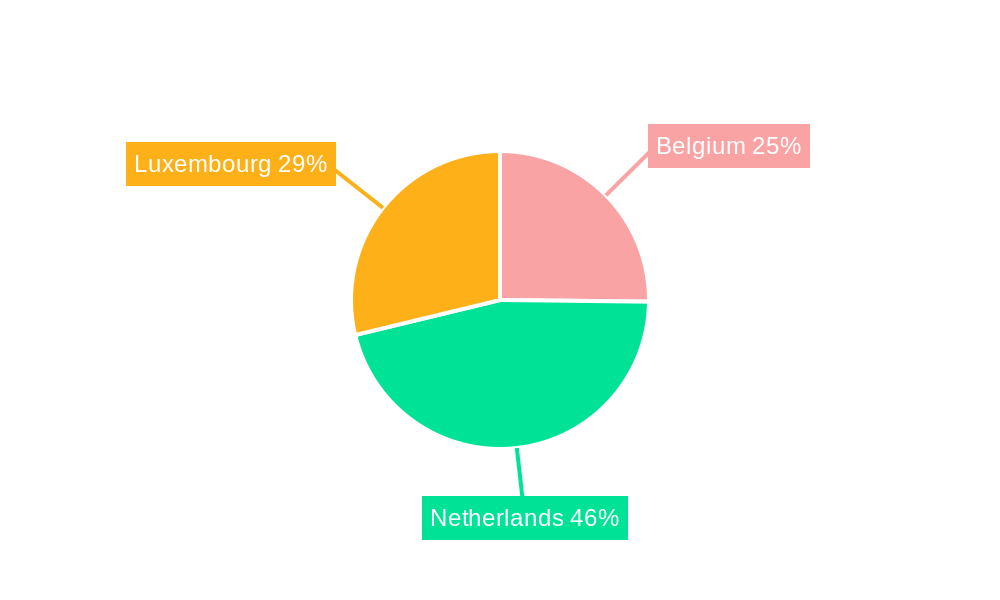
Dominant Regions, Countries, or Segments in Benelux Plastic Caps and Closures Market
This section identifies the leading regions, countries, or segments within the Benelux market driving its growth. It examines the influence of economic policies, infrastructure development, and consumer preferences on regional variations in market performance. Detailed analysis will highlight market share and growth potential for each key area.
- Dominant Region: The Netherlands is projected to be the largest market due to its strong manufacturing base and export-oriented economy.
- Key Drivers (Netherlands): Strong industrial sector, advanced manufacturing capabilities, proximity to major European markets.
- Key Drivers (Belgium): Developed logistics infrastructure and robust food and beverage sector.
- Market Share Breakdown (2025, Million Units): Netherlands: xx; Belgium: xx; Luxembourg: xx
Benelux Plastic Caps and Closures Market Product Landscape
This section explores the innovation landscape, describing the key product types available, their applications, and performance characteristics (e.g., seal integrity, recyclability). It highlights unique selling propositions (USPs) and advanced technologies influencing market competition.
The market offers a wide range of caps and closures made from various plastics like PE and PP, catering to applications in food & beverage, pharmaceutical, personal care, and industrial sectors. Recent innovations focus on lightweight designs, improved barrier properties, and sustainable materials for enhanced product protection and reduced environmental impact.
Key Drivers, Barriers & Challenges in Benelux Plastic Caps and Closures Market
This section analyzes the primary drivers (e.g., rising demand, technological advancements, supportive government policies) and challenges (e.g., raw material price fluctuations, stringent regulations, and competition from sustainable alternatives) impacting market growth.
Key Drivers: Increasing demand from the food and beverage sector, growing use in pharmaceutical packaging, and the development of innovative closure technologies.
Key Challenges: Fluctuations in raw material prices, increasing environmental regulations, and the emergence of sustainable alternatives impacting the market. These factors are estimated to reduce growth by xx% annually until 2028.
Emerging Opportunities in Benelux Plastic Caps and Closures Market
This section explores emerging trends and potential opportunities.
- Growth in sustainable and recyclable packaging: Demand for eco-friendly closures is rising, creating opportunities for producers using bioplastics and recycled content.
- Smart packaging solutions: Incorporation of sensors and other technologies for traceability and improved shelf life.
- Expansion into niche markets: Exploring emerging markets within personal care and industrial applications.
Growth Accelerators in the Benelux Plastic Caps and Closures Market Industry
Long-term growth will be driven by technological advancements in material science (e.g., lighter and stronger plastics), strategic partnerships between manufacturers and brand owners, and the expansion into new markets within the Benelux region and beyond.
Key Players Shaping the Benelux Plastic Caps and Closures Market Market
- Amcor Group GmbH
- Bericap Holding GmbH
- Berry Global Inc.
- Protective Industries Inc.
- Eurocap & Eurocork
- Berlin Packaging Netherlands
- Keizer International BV
- Kornelis Caps & Closures
Notable Milestones in Benelux Plastic Caps and Closures Market Sector
- October 2023: Berry Global Inc. launched its Slimline range of lightweight tube closures, expanding its product portfolio in personal care and pharmaceuticals.
- April 2023: Bericap Holding GmbH showcased its diverse range of plastic closures at Interpack 2023, demonstrating its commitment to the food, beverage, and industrial sectors.
In-Depth Benelux Plastic Caps and Closures Market Outlook
The Benelux plastic caps and closures market is poised for continued growth driven by technological innovation, increasing demand from diverse end-use sectors, and a focus on sustainability. Strategic partnerships and expansion into new markets will further accelerate growth, presenting significant opportunities for industry players.
Benelux Plastic Caps and Closures Market Segmentation
-
1. Resin
- 1.1. Polyethylene (PE)
- 1.2. Polyethylene Terephthalate (PET)
- 1.3. Polypropylene (PP)
- 1.4. Other Pl
-
2. Product Type
- 2.1. Threaded - Screw Caps, Vacuum, etc.
- 2.2. Dispensing
- 2.3. Unthread
- 2.4. Child-resistant
-
3. End-Use Industries
- 3.1. Food
-
3.2. Beverage
- 3.2.1. Bottled Water
- 3.2.2. Carbonated Soft Drinks
- 3.2.3. Alcoholic Beverages
- 3.2.4. Juices & Energy Drinks
- 3.2.5. Other Beverages
- 3.3. Personal Care & Cosmetics
- 3.4. Household Chemicals
- 3.5. Other End-Use Industries
Benelux Plastic Caps and Closures Market Segmentation By Geography
-
1. North America
- 1.1. United States
- 1.2. Canada
- 1.3. Mexico
-
2. South America
- 2.1. Brazil
- 2.2. Argentina
- 2.3. Rest of South America
-
3. Europe
- 3.1. United Kingdom
- 3.2. Germany
- 3.3. France
- 3.4. Italy
- 3.5. Spain
- 3.6. Russia
- 3.7. Benelux
- 3.8. Nordics
- 3.9. Rest of Europe
-
4. Middle East & Africa
- 4.1. Turkey
- 4.2. Israel
- 4.3. GCC
- 4.4. North Africa
- 4.5. South Africa
- 4.6. Rest of Middle East & Africa
-
5. Asia Pacific
- 5.1. China
- 5.2. India
- 5.3. Japan
- 5.4. South Korea
- 5.5. ASEAN
- 5.6. Oceania
- 5.7. Rest of Asia Pacific
Benelux Plastic Caps and Closures Market Regional Market Share
Geographic Coverage of Benelux Plastic Caps and Closures Market
Benelux Plastic Caps and Closures Market REPORT HIGHLIGHTS
| Aspects | Details |
|---|---|
| Study Period | 2020-2034 |
| Base Year | 2025 |
| Estimated Year | 2026 |
| Forecast Period | 2026-2034 |
| Historical Period | 2020-2025 |
| Growth Rate | CAGR of 3.21% from 2020-2034 |
| Segmentation |
|
Table of Contents
- 1. Introduction
- 1.1. Research Scope
- 1.2. Market Segmentation
- 1.3. Research Objective
- 1.4. Definitions and Assumptions
- 2. Executive Summary
- 2.1. Market Snapshot
- 3. Market Dynamics
- 3.1. Market Drivers
- 3.2. Market Restrains
- 3.3. Market Trends
- 3.4. Market Opportunities
- 4. Market Factor Analysis
- 4.1. Porters Five Forces
- 4.1.1. Bargaining Power of Suppliers
- 4.1.2. Bargaining Power of Buyers
- 4.1.3. Threat of New Entrants
- 4.1.4. Threat of Substitutes
- 4.1.5. Competitive Rivalry
- 4.2. PESTEL analysis
- 4.3. BCG Analysis
- 4.3.1. Stars (High Growth, High Market Share)
- 4.3.2. Cash Cows (Low Growth, High Market Share)
- 4.3.3. Question Mark (High Growth, Low Market Share)
- 4.3.4. Dogs (Low Growth, Low Market Share)
- 4.4. Ansoff Matrix Analysis
- 4.5. Supply Chain Analysis
- 4.6. Regulatory Landscape
- 4.7. Current Market Potential and Opportunity Assessment (TAM–SAM–SOM Framework)
- 4.8. VDR Analyst Note
- 4.1. Porters Five Forces
- 5. Market Analysis, Insights and Forecast 2021-2033
- 5.1. Market Analysis, Insights and Forecast - by Resin
- 5.1.1. Polyethylene (PE)
- 5.1.2. Polyethylene Terephthalate (PET)
- 5.1.3. Polypropylene (PP)
- 5.1.4. Other Pl
- 5.2. Market Analysis, Insights and Forecast - by Product Type
- 5.2.1. Threaded - Screw Caps, Vacuum, etc.
- 5.2.2. Dispensing
- 5.2.3. Unthread
- 5.2.4. Child-resistant
- 5.3. Market Analysis, Insights and Forecast - by End-Use Industries
- 5.3.1. Food
- 5.3.2. Beverage
- 5.3.2.1. Bottled Water
- 5.3.2.2. Carbonated Soft Drinks
- 5.3.2.3. Alcoholic Beverages
- 5.3.2.4. Juices & Energy Drinks
- 5.3.2.5. Other Beverages
- 5.3.3. Personal Care & Cosmetics
- 5.3.4. Household Chemicals
- 5.3.5. Other End-Use Industries
- 5.4. Market Analysis, Insights and Forecast - by Region
- 5.4.1. North America
- 5.4.2. South America
- 5.4.3. Europe
- 5.4.4. Middle East & Africa
- 5.4.5. Asia Pacific
- 5.1. Market Analysis, Insights and Forecast - by Resin
- 6. Global Benelux Plastic Caps and Closures Market Analysis, Insights and Forecast, 2021-2033
- 6.1. Market Analysis, Insights and Forecast - by Resin
- 6.1.1. Polyethylene (PE)
- 6.1.2. Polyethylene Terephthalate (PET)
- 6.1.3. Polypropylene (PP)
- 6.1.4. Other Pl
- 6.2. Market Analysis, Insights and Forecast - by Product Type
- 6.2.1. Threaded - Screw Caps, Vacuum, etc.
- 6.2.2. Dispensing
- 6.2.3. Unthread
- 6.2.4. Child-resistant
- 6.3. Market Analysis, Insights and Forecast - by End-Use Industries
- 6.3.1. Food
- 6.3.2. Beverage
- 6.3.2.1. Bottled Water
- 6.3.2.2. Carbonated Soft Drinks
- 6.3.2.3. Alcoholic Beverages
- 6.3.2.4. Juices & Energy Drinks
- 6.3.2.5. Other Beverages
- 6.3.3. Personal Care & Cosmetics
- 6.3.4. Household Chemicals
- 6.3.5. Other End-Use Industries
- 6.1. Market Analysis, Insights and Forecast - by Resin
- 7. North America Benelux Plastic Caps and Closures Market Analysis, Insights and Forecast, 2021-2033
- 7.1. Market Analysis, Insights and Forecast - by Resin
- 7.1.1. Polyethylene (PE)
- 7.1.2. Polyethylene Terephthalate (PET)
- 7.1.3. Polypropylene (PP)
- 7.1.4. Other Pl
- 7.2. Market Analysis, Insights and Forecast - by Product Type
- 7.2.1. Threaded - Screw Caps, Vacuum, etc.
- 7.2.2. Dispensing
- 7.2.3. Unthread
- 7.2.4. Child-resistant
- 7.3. Market Analysis, Insights and Forecast - by End-Use Industries
- 7.3.1. Food
- 7.3.2. Beverage
- 7.3.2.1. Bottled Water
- 7.3.2.2. Carbonated Soft Drinks
- 7.3.2.3. Alcoholic Beverages
- 7.3.2.4. Juices & Energy Drinks
- 7.3.2.5. Other Beverages
- 7.3.3. Personal Care & Cosmetics
- 7.3.4. Household Chemicals
- 7.3.5. Other End-Use Industries
- 7.1. Market Analysis, Insights and Forecast - by Resin
- 8. South America Benelux Plastic Caps and Closures Market Analysis, Insights and Forecast, 2021-2033
- 8.1. Market Analysis, Insights and Forecast - by Resin
- 8.1.1. Polyethylene (PE)
- 8.1.2. Polyethylene Terephthalate (PET)
- 8.1.3. Polypropylene (PP)
- 8.1.4. Other Pl
- 8.2. Market Analysis, Insights and Forecast - by Product Type
- 8.2.1. Threaded - Screw Caps, Vacuum, etc.
- 8.2.2. Dispensing
- 8.2.3. Unthread
- 8.2.4. Child-resistant
- 8.3. Market Analysis, Insights and Forecast - by End-Use Industries
- 8.3.1. Food
- 8.3.2. Beverage
- 8.3.2.1. Bottled Water
- 8.3.2.2. Carbonated Soft Drinks
- 8.3.2.3. Alcoholic Beverages
- 8.3.2.4. Juices & Energy Drinks
- 8.3.2.5. Other Beverages
- 8.3.3. Personal Care & Cosmetics
- 8.3.4. Household Chemicals
- 8.3.5. Other End-Use Industries
- 8.1. Market Analysis, Insights and Forecast - by Resin
- 9. Europe Benelux Plastic Caps and Closures Market Analysis, Insights and Forecast, 2021-2033
- 9.1. Market Analysis, Insights and Forecast - by Resin
- 9.1.1. Polyethylene (PE)
- 9.1.2. Polyethylene Terephthalate (PET)
- 9.1.3. Polypropylene (PP)
- 9.1.4. Other Pl
- 9.2. Market Analysis, Insights and Forecast - by Product Type
- 9.2.1. Threaded - Screw Caps, Vacuum, etc.
- 9.2.2. Dispensing
- 9.2.3. Unthread
- 9.2.4. Child-resistant
- 9.3. Market Analysis, Insights and Forecast - by End-Use Industries
- 9.3.1. Food
- 9.3.2. Beverage
- 9.3.2.1. Bottled Water
- 9.3.2.2. Carbonated Soft Drinks
- 9.3.2.3. Alcoholic Beverages
- 9.3.2.4. Juices & Energy Drinks
- 9.3.2.5. Other Beverages
- 9.3.3. Personal Care & Cosmetics
- 9.3.4. Household Chemicals
- 9.3.5. Other End-Use Industries
- 9.1. Market Analysis, Insights and Forecast - by Resin
- 10. Middle East & Africa Benelux Plastic Caps and Closures Market Analysis, Insights and Forecast, 2021-2033
- 10.1. Market Analysis, Insights and Forecast - by Resin
- 10.1.1. Polyethylene (PE)
- 10.1.2. Polyethylene Terephthalate (PET)
- 10.1.3. Polypropylene (PP)
- 10.1.4. Other Pl
- 10.2. Market Analysis, Insights and Forecast - by Product Type
- 10.2.1. Threaded - Screw Caps, Vacuum, etc.
- 10.2.2. Dispensing
- 10.2.3. Unthread
- 10.2.4. Child-resistant
- 10.3. Market Analysis, Insights and Forecast - by End-Use Industries
- 10.3.1. Food
- 10.3.2. Beverage
- 10.3.2.1. Bottled Water
- 10.3.2.2. Carbonated Soft Drinks
- 10.3.2.3. Alcoholic Beverages
- 10.3.2.4. Juices & Energy Drinks
- 10.3.2.5. Other Beverages
- 10.3.3. Personal Care & Cosmetics
- 10.3.4. Household Chemicals
- 10.3.5. Other End-Use Industries
- 10.1. Market Analysis, Insights and Forecast - by Resin
- 11. Asia Pacific Benelux Plastic Caps and Closures Market Analysis, Insights and Forecast, 2021-2033
- 11.1. Market Analysis, Insights and Forecast - by Resin
- 11.1.1. Polyethylene (PE)
- 11.1.2. Polyethylene Terephthalate (PET)
- 11.1.3. Polypropylene (PP)
- 11.1.4. Other Pl
- 11.2. Market Analysis, Insights and Forecast - by Product Type
- 11.2.1. Threaded - Screw Caps, Vacuum, etc.
- 11.2.2. Dispensing
- 11.2.3. Unthread
- 11.2.4. Child-resistant
- 11.3. Market Analysis, Insights and Forecast - by End-Use Industries
- 11.3.1. Food
- 11.3.2. Beverage
- 11.3.2.1. Bottled Water
- 11.3.2.2. Carbonated Soft Drinks
- 11.3.2.3. Alcoholic Beverages
- 11.3.2.4. Juices & Energy Drinks
- 11.3.2.5. Other Beverages
- 11.3.3. Personal Care & Cosmetics
- 11.3.4. Household Chemicals
- 11.3.5. Other End-Use Industries
- 11.1. Market Analysis, Insights and Forecast - by Resin
- 12. Competitive Analysis
- 12.1. Company Profiles
- 12.1.1 Amcor Group GmbH
- 12.1.1.1. Company Overview
- 12.1.1.2. Products
- 12.1.1.3. Company Financials
- 12.1.1.4. SWOT Analysis
- 12.1.2 Bericap Holding GmbH
- 12.1.2.1. Company Overview
- 12.1.2.2. Products
- 12.1.2.3. Company Financials
- 12.1.2.4. SWOT Analysis
- 12.1.3 Berry Global Inc
- 12.1.3.1. Company Overview
- 12.1.3.2. Products
- 12.1.3.3. Company Financials
- 12.1.3.4. SWOT Analysis
- 12.1.4 Protective Industries Inc
- 12.1.4.1. Company Overview
- 12.1.4.2. Products
- 12.1.4.3. Company Financials
- 12.1.4.4. SWOT Analysis
- 12.1.5 Eurocap & Eurocork
- 12.1.5.1. Company Overview
- 12.1.5.2. Products
- 12.1.5.3. Company Financials
- 12.1.5.4. SWOT Analysis
- 12.1.6 Berlin Packaging Netherlands
- 12.1.6.1. Company Overview
- 12.1.6.2. Products
- 12.1.6.3. Company Financials
- 12.1.6.4. SWOT Analysis
- 12.1.7 Keizer International BV
- 12.1.7.1. Company Overview
- 12.1.7.2. Products
- 12.1.7.3. Company Financials
- 12.1.7.4. SWOT Analysis
- 12.1.8 Kornelis Caps & Closures8 2 Heat Map Analysis8 3 Competitor Analysis - Emerging vs Established Player
- 12.1.8.1. Company Overview
- 12.1.8.2. Products
- 12.1.8.3. Company Financials
- 12.1.8.4. SWOT Analysis
- 12.1.1 Amcor Group GmbH
- 12.2. Market Entropy
- 12.2.1 Company's Key Areas Served
- 12.2.2 Recent Developments
- 12.3. Company Market Share Analysis 2025
- 12.3.1 Top 5 Companies Market Share Analysis
- 12.3.2 Top 3 Companies Market Share Analysis
- 12.4. List of Potential Customers
- 13. Research Methodology
List of Figures
- Figure 1: Global Benelux Plastic Caps and Closures Market Revenue Breakdown (Million, %) by Region 2025 & 2033
- Figure 2: Global Benelux Plastic Caps and Closures Market Volume Breakdown (Billion, %) by Region 2025 & 2033
- Figure 3: North America Benelux Plastic Caps and Closures Market Revenue (Million), by Resin 2025 & 2033
- Figure 4: North America Benelux Plastic Caps and Closures Market Volume (Billion), by Resin 2025 & 2033
- Figure 5: North America Benelux Plastic Caps and Closures Market Revenue Share (%), by Resin 2025 & 2033
- Figure 6: North America Benelux Plastic Caps and Closures Market Volume Share (%), by Resin 2025 & 2033
- Figure 7: North America Benelux Plastic Caps and Closures Market Revenue (Million), by Product Type 2025 & 2033
- Figure 8: North America Benelux Plastic Caps and Closures Market Volume (Billion), by Product Type 2025 & 2033
- Figure 9: North America Benelux Plastic Caps and Closures Market Revenue Share (%), by Product Type 2025 & 2033
- Figure 10: North America Benelux Plastic Caps and Closures Market Volume Share (%), by Product Type 2025 & 2033
- Figure 11: North America Benelux Plastic Caps and Closures Market Revenue (Million), by End-Use Industries 2025 & 2033
- Figure 12: North America Benelux Plastic Caps and Closures Market Volume (Billion), by End-Use Industries 2025 & 2033
- Figure 13: North America Benelux Plastic Caps and Closures Market Revenue Share (%), by End-Use Industries 2025 & 2033
- Figure 14: North America Benelux Plastic Caps and Closures Market Volume Share (%), by End-Use Industries 2025 & 2033
- Figure 15: North America Benelux Plastic Caps and Closures Market Revenue (Million), by Country 2025 & 2033
- Figure 16: North America Benelux Plastic Caps and Closures Market Volume (Billion), by Country 2025 & 2033
- Figure 17: North America Benelux Plastic Caps and Closures Market Revenue Share (%), by Country 2025 & 2033
- Figure 18: North America Benelux Plastic Caps and Closures Market Volume Share (%), by Country 2025 & 2033
- Figure 19: South America Benelux Plastic Caps and Closures Market Revenue (Million), by Resin 2025 & 2033
- Figure 20: South America Benelux Plastic Caps and Closures Market Volume (Billion), by Resin 2025 & 2033
- Figure 21: South America Benelux Plastic Caps and Closures Market Revenue Share (%), by Resin 2025 & 2033
- Figure 22: South America Benelux Plastic Caps and Closures Market Volume Share (%), by Resin 2025 & 2033
- Figure 23: South America Benelux Plastic Caps and Closures Market Revenue (Million), by Product Type 2025 & 2033
- Figure 24: South America Benelux Plastic Caps and Closures Market Volume (Billion), by Product Type 2025 & 2033
- Figure 25: South America Benelux Plastic Caps and Closures Market Revenue Share (%), by Product Type 2025 & 2033
- Figure 26: South America Benelux Plastic Caps and Closures Market Volume Share (%), by Product Type 2025 & 2033
- Figure 27: South America Benelux Plastic Caps and Closures Market Revenue (Million), by End-Use Industries 2025 & 2033
- Figure 28: South America Benelux Plastic Caps and Closures Market Volume (Billion), by End-Use Industries 2025 & 2033
- Figure 29: South America Benelux Plastic Caps and Closures Market Revenue Share (%), by End-Use Industries 2025 & 2033
- Figure 30: South America Benelux Plastic Caps and Closures Market Volume Share (%), by End-Use Industries 2025 & 2033
- Figure 31: South America Benelux Plastic Caps and Closures Market Revenue (Million), by Country 2025 & 2033
- Figure 32: South America Benelux Plastic Caps and Closures Market Volume (Billion), by Country 2025 & 2033
- Figure 33: South America Benelux Plastic Caps and Closures Market Revenue Share (%), by Country 2025 & 2033
- Figure 34: South America Benelux Plastic Caps and Closures Market Volume Share (%), by Country 2025 & 2033
- Figure 35: Europe Benelux Plastic Caps and Closures Market Revenue (Million), by Resin 2025 & 2033
- Figure 36: Europe Benelux Plastic Caps and Closures Market Volume (Billion), by Resin 2025 & 2033
- Figure 37: Europe Benelux Plastic Caps and Closures Market Revenue Share (%), by Resin 2025 & 2033
- Figure 38: Europe Benelux Plastic Caps and Closures Market Volume Share (%), by Resin 2025 & 2033
- Figure 39: Europe Benelux Plastic Caps and Closures Market Revenue (Million), by Product Type 2025 & 2033
- Figure 40: Europe Benelux Plastic Caps and Closures Market Volume (Billion), by Product Type 2025 & 2033
- Figure 41: Europe Benelux Plastic Caps and Closures Market Revenue Share (%), by Product Type 2025 & 2033
- Figure 42: Europe Benelux Plastic Caps and Closures Market Volume Share (%), by Product Type 2025 & 2033
- Figure 43: Europe Benelux Plastic Caps and Closures Market Revenue (Million), by End-Use Industries 2025 & 2033
- Figure 44: Europe Benelux Plastic Caps and Closures Market Volume (Billion), by End-Use Industries 2025 & 2033
- Figure 45: Europe Benelux Plastic Caps and Closures Market Revenue Share (%), by End-Use Industries 2025 & 2033
- Figure 46: Europe Benelux Plastic Caps and Closures Market Volume Share (%), by End-Use Industries 2025 & 2033
- Figure 47: Europe Benelux Plastic Caps and Closures Market Revenue (Million), by Country 2025 & 2033
- Figure 48: Europe Benelux Plastic Caps and Closures Market Volume (Billion), by Country 2025 & 2033
- Figure 49: Europe Benelux Plastic Caps and Closures Market Revenue Share (%), by Country 2025 & 2033
- Figure 50: Europe Benelux Plastic Caps and Closures Market Volume Share (%), by Country 2025 & 2033
- Figure 51: Middle East & Africa Benelux Plastic Caps and Closures Market Revenue (Million), by Resin 2025 & 2033
- Figure 52: Middle East & Africa Benelux Plastic Caps and Closures Market Volume (Billion), by Resin 2025 & 2033
- Figure 53: Middle East & Africa Benelux Plastic Caps and Closures Market Revenue Share (%), by Resin 2025 & 2033
- Figure 54: Middle East & Africa Benelux Plastic Caps and Closures Market Volume Share (%), by Resin 2025 & 2033
- Figure 55: Middle East & Africa Benelux Plastic Caps and Closures Market Revenue (Million), by Product Type 2025 & 2033
- Figure 56: Middle East & Africa Benelux Plastic Caps and Closures Market Volume (Billion), by Product Type 2025 & 2033
- Figure 57: Middle East & Africa Benelux Plastic Caps and Closures Market Revenue Share (%), by Product Type 2025 & 2033
- Figure 58: Middle East & Africa Benelux Plastic Caps and Closures Market Volume Share (%), by Product Type 2025 & 2033
- Figure 59: Middle East & Africa Benelux Plastic Caps and Closures Market Revenue (Million), by End-Use Industries 2025 & 2033
- Figure 60: Middle East & Africa Benelux Plastic Caps and Closures Market Volume (Billion), by End-Use Industries 2025 & 2033
- Figure 61: Middle East & Africa Benelux Plastic Caps and Closures Market Revenue Share (%), by End-Use Industries 2025 & 2033
- Figure 62: Middle East & Africa Benelux Plastic Caps and Closures Market Volume Share (%), by End-Use Industries 2025 & 2033
- Figure 63: Middle East & Africa Benelux Plastic Caps and Closures Market Revenue (Million), by Country 2025 & 2033
- Figure 64: Middle East & Africa Benelux Plastic Caps and Closures Market Volume (Billion), by Country 2025 & 2033
- Figure 65: Middle East & Africa Benelux Plastic Caps and Closures Market Revenue Share (%), by Country 2025 & 2033
- Figure 66: Middle East & Africa Benelux Plastic Caps and Closures Market Volume Share (%), by Country 2025 & 2033
- Figure 67: Asia Pacific Benelux Plastic Caps and Closures Market Revenue (Million), by Resin 2025 & 2033
- Figure 68: Asia Pacific Benelux Plastic Caps and Closures Market Volume (Billion), by Resin 2025 & 2033
- Figure 69: Asia Pacific Benelux Plastic Caps and Closures Market Revenue Share (%), by Resin 2025 & 2033
- Figure 70: Asia Pacific Benelux Plastic Caps and Closures Market Volume Share (%), by Resin 2025 & 2033
- Figure 71: Asia Pacific Benelux Plastic Caps and Closures Market Revenue (Million), by Product Type 2025 & 2033
- Figure 72: Asia Pacific Benelux Plastic Caps and Closures Market Volume (Billion), by Product Type 2025 & 2033
- Figure 73: Asia Pacific Benelux Plastic Caps and Closures Market Revenue Share (%), by Product Type 2025 & 2033
- Figure 74: Asia Pacific Benelux Plastic Caps and Closures Market Volume Share (%), by Product Type 2025 & 2033
- Figure 75: Asia Pacific Benelux Plastic Caps and Closures Market Revenue (Million), by End-Use Industries 2025 & 2033
- Figure 76: Asia Pacific Benelux Plastic Caps and Closures Market Volume (Billion), by End-Use Industries 2025 & 2033
- Figure 77: Asia Pacific Benelux Plastic Caps and Closures Market Revenue Share (%), by End-Use Industries 2025 & 2033
- Figure 78: Asia Pacific Benelux Plastic Caps and Closures Market Volume Share (%), by End-Use Industries 2025 & 2033
- Figure 79: Asia Pacific Benelux Plastic Caps and Closures Market Revenue (Million), by Country 2025 & 2033
- Figure 80: Asia Pacific Benelux Plastic Caps and Closures Market Volume (Billion), by Country 2025 & 2033
- Figure 81: Asia Pacific Benelux Plastic Caps and Closures Market Revenue Share (%), by Country 2025 & 2033
- Figure 82: Asia Pacific Benelux Plastic Caps and Closures Market Volume Share (%), by Country 2025 & 2033
List of Tables
- Table 1: Global Benelux Plastic Caps and Closures Market Revenue Million Forecast, by Resin 2020 & 2033
- Table 2: Global Benelux Plastic Caps and Closures Market Volume Billion Forecast, by Resin 2020 & 2033
- Table 3: Global Benelux Plastic Caps and Closures Market Revenue Million Forecast, by Product Type 2020 & 2033
- Table 4: Global Benelux Plastic Caps and Closures Market Volume Billion Forecast, by Product Type 2020 & 2033
- Table 5: Global Benelux Plastic Caps and Closures Market Revenue Million Forecast, by End-Use Industries 2020 & 2033
- Table 6: Global Benelux Plastic Caps and Closures Market Volume Billion Forecast, by End-Use Industries 2020 & 2033
- Table 7: Global Benelux Plastic Caps and Closures Market Revenue Million Forecast, by Region 2020 & 2033
- Table 8: Global Benelux Plastic Caps and Closures Market Volume Billion Forecast, by Region 2020 & 2033
- Table 9: Global Benelux Plastic Caps and Closures Market Revenue Million Forecast, by Resin 2020 & 2033
- Table 10: Global Benelux Plastic Caps and Closures Market Volume Billion Forecast, by Resin 2020 & 2033
- Table 11: Global Benelux Plastic Caps and Closures Market Revenue Million Forecast, by Product Type 2020 & 2033
- Table 12: Global Benelux Plastic Caps and Closures Market Volume Billion Forecast, by Product Type 2020 & 2033
- Table 13: Global Benelux Plastic Caps and Closures Market Revenue Million Forecast, by End-Use Industries 2020 & 2033
- Table 14: Global Benelux Plastic Caps and Closures Market Volume Billion Forecast, by End-Use Industries 2020 & 2033
- Table 15: Global Benelux Plastic Caps and Closures Market Revenue Million Forecast, by Country 2020 & 2033
- Table 16: Global Benelux Plastic Caps and Closures Market Volume Billion Forecast, by Country 2020 & 2033
- Table 17: United States Benelux Plastic Caps and Closures Market Revenue (Million) Forecast, by Application 2020 & 2033
- Table 18: United States Benelux Plastic Caps and Closures Market Volume (Billion) Forecast, by Application 2020 & 2033
- Table 19: Canada Benelux Plastic Caps and Closures Market Revenue (Million) Forecast, by Application 2020 & 2033
- Table 20: Canada Benelux Plastic Caps and Closures Market Volume (Billion) Forecast, by Application 2020 & 2033
- Table 21: Mexico Benelux Plastic Caps and Closures Market Revenue (Million) Forecast, by Application 2020 & 2033
- Table 22: Mexico Benelux Plastic Caps and Closures Market Volume (Billion) Forecast, by Application 2020 & 2033
- Table 23: Global Benelux Plastic Caps and Closures Market Revenue Million Forecast, by Resin 2020 & 2033
- Table 24: Global Benelux Plastic Caps and Closures Market Volume Billion Forecast, by Resin 2020 & 2033
- Table 25: Global Benelux Plastic Caps and Closures Market Revenue Million Forecast, by Product Type 2020 & 2033
- Table 26: Global Benelux Plastic Caps and Closures Market Volume Billion Forecast, by Product Type 2020 & 2033
- Table 27: Global Benelux Plastic Caps and Closures Market Revenue Million Forecast, by End-Use Industries 2020 & 2033
- Table 28: Global Benelux Plastic Caps and Closures Market Volume Billion Forecast, by End-Use Industries 2020 & 2033
- Table 29: Global Benelux Plastic Caps and Closures Market Revenue Million Forecast, by Country 2020 & 2033
- Table 30: Global Benelux Plastic Caps and Closures Market Volume Billion Forecast, by Country 2020 & 2033
- Table 31: Brazil Benelux Plastic Caps and Closures Market Revenue (Million) Forecast, by Application 2020 & 2033
- Table 32: Brazil Benelux Plastic Caps and Closures Market Volume (Billion) Forecast, by Application 2020 & 2033
- Table 33: Argentina Benelux Plastic Caps and Closures Market Revenue (Million) Forecast, by Application 2020 & 2033
- Table 34: Argentina Benelux Plastic Caps and Closures Market Volume (Billion) Forecast, by Application 2020 & 2033
- Table 35: Rest of South America Benelux Plastic Caps and Closures Market Revenue (Million) Forecast, by Application 2020 & 2033
- Table 36: Rest of South America Benelux Plastic Caps and Closures Market Volume (Billion) Forecast, by Application 2020 & 2033
- Table 37: Global Benelux Plastic Caps and Closures Market Revenue Million Forecast, by Resin 2020 & 2033
- Table 38: Global Benelux Plastic Caps and Closures Market Volume Billion Forecast, by Resin 2020 & 2033
- Table 39: Global Benelux Plastic Caps and Closures Market Revenue Million Forecast, by Product Type 2020 & 2033
- Table 40: Global Benelux Plastic Caps and Closures Market Volume Billion Forecast, by Product Type 2020 & 2033
- Table 41: Global Benelux Plastic Caps and Closures Market Revenue Million Forecast, by End-Use Industries 2020 & 2033
- Table 42: Global Benelux Plastic Caps and Closures Market Volume Billion Forecast, by End-Use Industries 2020 & 2033
- Table 43: Global Benelux Plastic Caps and Closures Market Revenue Million Forecast, by Country 2020 & 2033
- Table 44: Global Benelux Plastic Caps and Closures Market Volume Billion Forecast, by Country 2020 & 2033
- Table 45: United Kingdom Benelux Plastic Caps and Closures Market Revenue (Million) Forecast, by Application 2020 & 2033
- Table 46: United Kingdom Benelux Plastic Caps and Closures Market Volume (Billion) Forecast, by Application 2020 & 2033
- Table 47: Germany Benelux Plastic Caps and Closures Market Revenue (Million) Forecast, by Application 2020 & 2033
- Table 48: Germany Benelux Plastic Caps and Closures Market Volume (Billion) Forecast, by Application 2020 & 2033
- Table 49: France Benelux Plastic Caps and Closures Market Revenue (Million) Forecast, by Application 2020 & 2033
- Table 50: France Benelux Plastic Caps and Closures Market Volume (Billion) Forecast, by Application 2020 & 2033
- Table 51: Italy Benelux Plastic Caps and Closures Market Revenue (Million) Forecast, by Application 2020 & 2033
- Table 52: Italy Benelux Plastic Caps and Closures Market Volume (Billion) Forecast, by Application 2020 & 2033
- Table 53: Spain Benelux Plastic Caps and Closures Market Revenue (Million) Forecast, by Application 2020 & 2033
- Table 54: Spain Benelux Plastic Caps and Closures Market Volume (Billion) Forecast, by Application 2020 & 2033
- Table 55: Russia Benelux Plastic Caps and Closures Market Revenue (Million) Forecast, by Application 2020 & 2033
- Table 56: Russia Benelux Plastic Caps and Closures Market Volume (Billion) Forecast, by Application 2020 & 2033
- Table 57: Benelux Benelux Plastic Caps and Closures Market Revenue (Million) Forecast, by Application 2020 & 2033
- Table 58: Benelux Benelux Plastic Caps and Closures Market Volume (Billion) Forecast, by Application 2020 & 2033
- Table 59: Nordics Benelux Plastic Caps and Closures Market Revenue (Million) Forecast, by Application 2020 & 2033
- Table 60: Nordics Benelux Plastic Caps and Closures Market Volume (Billion) Forecast, by Application 2020 & 2033
- Table 61: Rest of Europe Benelux Plastic Caps and Closures Market Revenue (Million) Forecast, by Application 2020 & 2033
- Table 62: Rest of Europe Benelux Plastic Caps and Closures Market Volume (Billion) Forecast, by Application 2020 & 2033
- Table 63: Global Benelux Plastic Caps and Closures Market Revenue Million Forecast, by Resin 2020 & 2033
- Table 64: Global Benelux Plastic Caps and Closures Market Volume Billion Forecast, by Resin 2020 & 2033
- Table 65: Global Benelux Plastic Caps and Closures Market Revenue Million Forecast, by Product Type 2020 & 2033
- Table 66: Global Benelux Plastic Caps and Closures Market Volume Billion Forecast, by Product Type 2020 & 2033
- Table 67: Global Benelux Plastic Caps and Closures Market Revenue Million Forecast, by End-Use Industries 2020 & 2033
- Table 68: Global Benelux Plastic Caps and Closures Market Volume Billion Forecast, by End-Use Industries 2020 & 2033
- Table 69: Global Benelux Plastic Caps and Closures Market Revenue Million Forecast, by Country 2020 & 2033
- Table 70: Global Benelux Plastic Caps and Closures Market Volume Billion Forecast, by Country 2020 & 2033
- Table 71: Turkey Benelux Plastic Caps and Closures Market Revenue (Million) Forecast, by Application 2020 & 2033
- Table 72: Turkey Benelux Plastic Caps and Closures Market Volume (Billion) Forecast, by Application 2020 & 2033
- Table 73: Israel Benelux Plastic Caps and Closures Market Revenue (Million) Forecast, by Application 2020 & 2033
- Table 74: Israel Benelux Plastic Caps and Closures Market Volume (Billion) Forecast, by Application 2020 & 2033
- Table 75: GCC Benelux Plastic Caps and Closures Market Revenue (Million) Forecast, by Application 2020 & 2033
- Table 76: GCC Benelux Plastic Caps and Closures Market Volume (Billion) Forecast, by Application 2020 & 2033
- Table 77: North Africa Benelux Plastic Caps and Closures Market Revenue (Million) Forecast, by Application 2020 & 2033
- Table 78: North Africa Benelux Plastic Caps and Closures Market Volume (Billion) Forecast, by Application 2020 & 2033
- Table 79: South Africa Benelux Plastic Caps and Closures Market Revenue (Million) Forecast, by Application 2020 & 2033
- Table 80: South Africa Benelux Plastic Caps and Closures Market Volume (Billion) Forecast, by Application 2020 & 2033
- Table 81: Rest of Middle East & Africa Benelux Plastic Caps and Closures Market Revenue (Million) Forecast, by Application 2020 & 2033
- Table 82: Rest of Middle East & Africa Benelux Plastic Caps and Closures Market Volume (Billion) Forecast, by Application 2020 & 2033
- Table 83: Global Benelux Plastic Caps and Closures Market Revenue Million Forecast, by Resin 2020 & 2033
- Table 84: Global Benelux Plastic Caps and Closures Market Volume Billion Forecast, by Resin 2020 & 2033
- Table 85: Global Benelux Plastic Caps and Closures Market Revenue Million Forecast, by Product Type 2020 & 2033
- Table 86: Global Benelux Plastic Caps and Closures Market Volume Billion Forecast, by Product Type 2020 & 2033
- Table 87: Global Benelux Plastic Caps and Closures Market Revenue Million Forecast, by End-Use Industries 2020 & 2033
- Table 88: Global Benelux Plastic Caps and Closures Market Volume Billion Forecast, by End-Use Industries 2020 & 2033
- Table 89: Global Benelux Plastic Caps and Closures Market Revenue Million Forecast, by Country 2020 & 2033
- Table 90: Global Benelux Plastic Caps and Closures Market Volume Billion Forecast, by Country 2020 & 2033
- Table 91: China Benelux Plastic Caps and Closures Market Revenue (Million) Forecast, by Application 2020 & 2033
- Table 92: China Benelux Plastic Caps and Closures Market Volume (Billion) Forecast, by Application 2020 & 2033
- Table 93: India Benelux Plastic Caps and Closures Market Revenue (Million) Forecast, by Application 2020 & 2033
- Table 94: India Benelux Plastic Caps and Closures Market Volume (Billion) Forecast, by Application 2020 & 2033
- Table 95: Japan Benelux Plastic Caps and Closures Market Revenue (Million) Forecast, by Application 2020 & 2033
- Table 96: Japan Benelux Plastic Caps and Closures Market Volume (Billion) Forecast, by Application 2020 & 2033
- Table 97: South Korea Benelux Plastic Caps and Closures Market Revenue (Million) Forecast, by Application 2020 & 2033
- Table 98: South Korea Benelux Plastic Caps and Closures Market Volume (Billion) Forecast, by Application 2020 & 2033
- Table 99: ASEAN Benelux Plastic Caps and Closures Market Revenue (Million) Forecast, by Application 2020 & 2033
- Table 100: ASEAN Benelux Plastic Caps and Closures Market Volume (Billion) Forecast, by Application 2020 & 2033
- Table 101: Oceania Benelux Plastic Caps and Closures Market Revenue (Million) Forecast, by Application 2020 & 2033
- Table 102: Oceania Benelux Plastic Caps and Closures Market Volume (Billion) Forecast, by Application 2020 & 2033
- Table 103: Rest of Asia Pacific Benelux Plastic Caps and Closures Market Revenue (Million) Forecast, by Application 2020 & 2033
- Table 104: Rest of Asia Pacific Benelux Plastic Caps and Closures Market Volume (Billion) Forecast, by Application 2020 & 2033
Frequently Asked Questions
1. What is the projected Compound Annual Growth Rate (CAGR) of the Benelux Plastic Caps and Closures Market?
The projected CAGR is approximately 3.21%.
2. Which companies are prominent players in the Benelux Plastic Caps and Closures Market?
Key companies in the market include Amcor Group GmbH, Bericap Holding GmbH, Berry Global Inc, Protective Industries Inc, Eurocap & Eurocork, Berlin Packaging Netherlands, Keizer International BV, Kornelis Caps & Closures8 2 Heat Map Analysis8 3 Competitor Analysis - Emerging vs Established Player.
3. What are the main segments of the Benelux Plastic Caps and Closures Market?
The market segments include Resin, Product Type, End-Use Industries.
4. Can you provide details about the market size?
The market size is estimated to be USD 1.39 Million as of 2022.
5. What are some drivers contributing to market growth?
Growth in the Food and Beverage Industry; Increasing Product Innovation in the Market.
6. What are the notable trends driving market growth?
Polyethylene (PE) Segment is Estimated to Have the Largest Market Share.
7. Are there any restraints impacting market growth?
Growth in the Food and Beverage Industry; Increasing Product Innovation in the Market.
8. Can you provide examples of recent developments in the market?
October 2023: Berry Global Inc., a US-based company operating in Belgium and the Netherlands, developed a lightweight tube closure, the Slimline range. The closure is available in different sizes and is manufactured using virgin polyethylene (PE) and polypropylene (PP). It can be used in a wide variety of personal care and pharmaceutical applications.
9. What pricing options are available for accessing the report?
Pricing options include single-user, multi-user, and enterprise licenses priced at USD 3800, USD 4500, and USD 5800 respectively.
10. Is the market size provided in terms of value or volume?
The market size is provided in terms of value, measured in Million and volume, measured in Billion.
11. Are there any specific market keywords associated with the report?
Yes, the market keyword associated with the report is "Benelux Plastic Caps and Closures Market," which aids in identifying and referencing the specific market segment covered.
12. How do I determine which pricing option suits my needs best?
The pricing options vary based on user requirements and access needs. Individual users may opt for single-user licenses, while businesses requiring broader access may choose multi-user or enterprise licenses for cost-effective access to the report.
13. Are there any additional resources or data provided in the Benelux Plastic Caps and Closures Market report?
While the report offers comprehensive insights, it's advisable to review the specific contents or supplementary materials provided to ascertain if additional resources or data are available.
14. How can I stay updated on further developments or reports in the Benelux Plastic Caps and Closures Market?
To stay informed about further developments, trends, and reports in the Benelux Plastic Caps and Closures Market, consider subscribing to industry newsletters, following relevant companies and organizations, or regularly checking reputable industry news sources and publications.
Methodology
Step 1 - Identification of Relevant Samples Size from Population Database


Step 2 - Approaches for Defining Global Market Size (Value, Volume* & Price*)

Note*: In applicable scenarios
Step 3 - Data Sources
Primary Research
- Web Analytics
- Survey Reports
- Research Institute
- Latest Research Reports
- Opinion Leaders
Secondary Research
- Annual Reports
- White Paper
- Latest Press Release
- Industry Association
- Paid Database
- Investor Presentations

Step 4 - Data Triangulation
Involves using different sources of information in order to increase the validity of a study
These sources are likely to be stakeholders in a program - participants, other researchers, program staff, other community members, and so on.
Then we put all data in single framework & apply various statistical tools to find out the dynamic on the market.
During the analysis stage, feedback from the stakeholder groups would be compared to determine areas of agreement as well as areas of divergence