


Key Insights
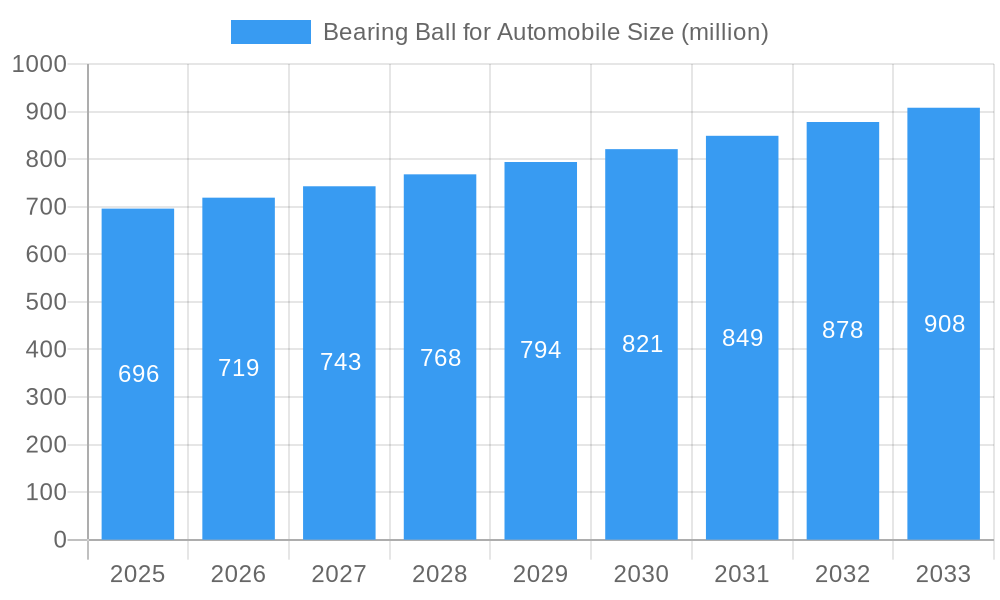
The global market for bearing balls in automobiles is poised for steady expansion, projected to reach an estimated market size of $696 million by 2025. This growth is underpinned by a Compound Annual Growth Rate (CAGR) of 3.4% throughout the forecast period of 2025-2033. The primary drivers fueling this market include the increasing global demand for passenger vehicles and the robust expansion of the commercial vehicle sector. As vehicle production continues to rise, particularly in emerging economies, the need for high-quality bearing balls, essential for the smooth functioning of various automotive components like transmissions, wheel hubs, and steering systems, will intensify. Technological advancements leading to more durable and efficient bearing balls, along with a growing emphasis on vehicle safety and performance, further contribute to market momentum. The increasing complexity of automotive designs also necessitates a wider range of specialized bearing ball types, catering to diverse application requirements.
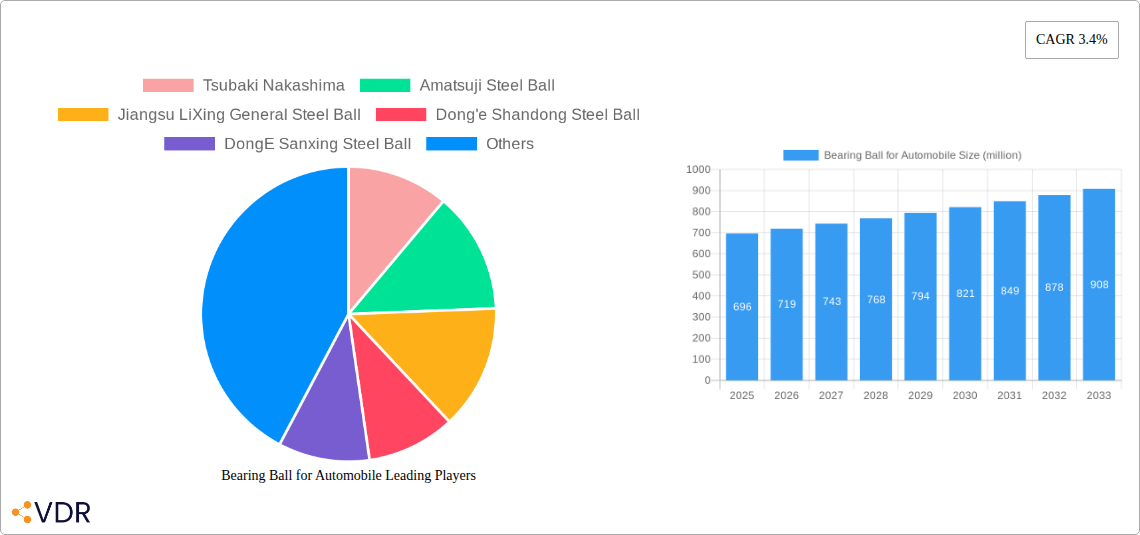
Bearing Ball for Automobile Market Size (In Million)

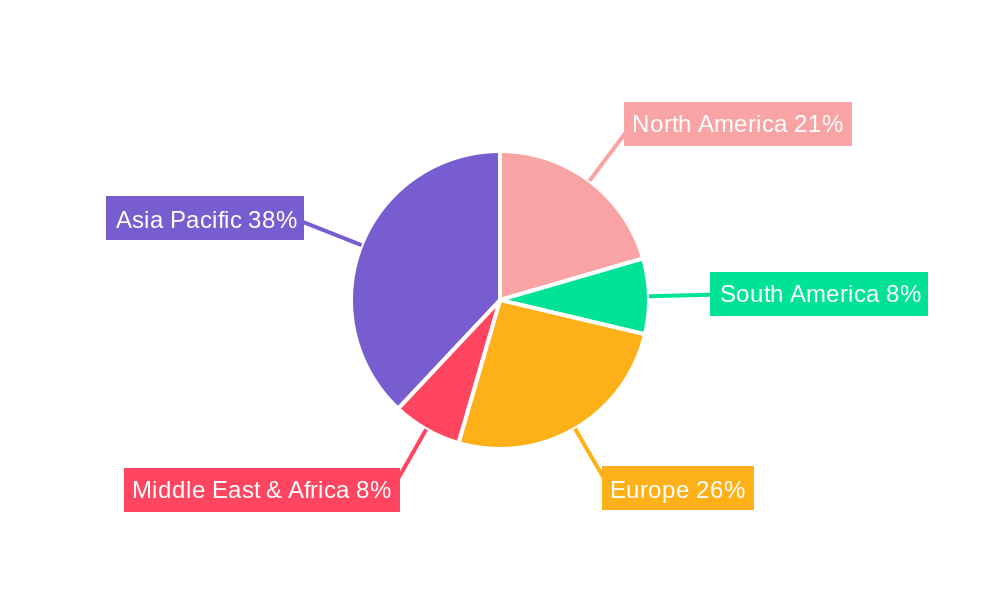
The market is segmented into distinct application categories, with passenger vehicles representing the largest share, followed by commercial vehicles. Within types, bearing balls and bearing rollers constitute the major segments, each serving specific functionalities. Geographically, Asia Pacific, driven by the massive automotive manufacturing hubs in China and India, is expected to dominate the market in terms of both production and consumption. North America and Europe also represent significant markets, owing to established automotive industries and a strong aftermarket for replacement parts. Key players such as Tsubaki Nakashima and SKF are actively investing in research and development to enhance product offerings and expand their global footprint. However, the market may face challenges such as fluctuating raw material prices and intense competition, which could impact profit margins.
Bearing Ball for Automobile Company Market Share
This in-depth report provides a definitive analysis of the global Bearing Ball for Automobile market, offering critical insights into its present state and future trajectory. Spanning a study period from 2019 to 2033, with a base year of 2025 and an estimated year also of 2025, this report meticulously dissects market dynamics, growth trends, regional dominance, product innovations, key drivers, barriers, opportunities, accelerators, and the competitive landscape. Targeting industry professionals, procurement managers, R&D specialists, and strategic planners, this report equips stakeholders with the data and foresight needed to navigate this dynamic sector.
The report presents a comprehensive market outlook, covering crucial segments such as Passenger Vehicle and Commercial Vehicle applications, and distinguishing between Bearing Ball and Bearing Roller types. Quantitative data, including market share percentages and CAGR estimates, is integrated with qualitative analyses of technological advancements, regulatory frameworks, and competitive strategies. The estimated market size for the global Bearing Ball for Automobile market in 2025 is projected to be $15.2 billion, with a robust CAGR of 5.8% expected during the forecast period of 2025-2033. This growth is driven by an increasing global vehicle production, the demand for enhanced vehicle performance and efficiency, and the continuous evolution of automotive technologies.
Bearing Ball for Automobile Market Dynamics & Structure
The Bearing Ball for Automobile market exhibits a moderately concentrated structure, with a blend of large multinational players and specialized regional manufacturers. Technological innovation is a primary driver, fueled by the automotive industry's relentless pursuit of lighter, more durable, and higher-performance bearing solutions. Advancements in material science, precision manufacturing techniques, and surface treatments are continually pushing the boundaries of bearing capabilities. Regulatory frameworks, particularly concerning environmental standards and vehicle safety, indirectly influence bearing design and material choices. Competitive product substitutes, while present in some lower-tier applications, are largely outmaneuvered by the superior performance and reliability of precision-engineered bearing balls and rollers in critical automotive systems. End-user demographics are shifting towards a greater demand for fuel efficiency and reduced maintenance, directly impacting the specifications and types of bearings required. Mergers and acquisitions (M&A) trends indicate a strategic consolidation aimed at expanding product portfolios, gaining technological expertise, and strengthening market reach. For instance, in the historical period (2019-2024), there were approximately 25 notable M&A deals valued at over $500 million cumulatively, underscoring active consolidation.
- Market Concentration: Moderate concentration with key players holding significant market share.
- Technological Innovation: Driven by demands for lightweight, durable, high-performance, and efficient bearing solutions.
- Regulatory Frameworks: Influenced by safety and environmental standards, promoting innovation in materials and manufacturing.
- Competitive Substitutes: Limited in critical automotive applications due to performance advantages of precision bearings.
- End-User Demographics: Growing demand for fuel efficiency, reduced emissions, and longer vehicle lifespan.
- M&A Trends: Active consolidation for portfolio expansion and market access.
Bearing Ball for Automobile Growth Trends & Insights
The Bearing Ball for Automobile market is poised for substantial expansion, mirroring the broader automotive industry's recovery and technological evolution. The market size is anticipated to grow from an estimated $15.2 billion in 2025 to $23.7 billion by 2033, driven by a compound annual growth rate (CAGR) of 5.8%. This impressive growth is underpinned by several interconnected trends. Global vehicle production, projected to reach 95 million units in 2025, continues to be a fundamental growth driver. The increasing adoption of electric vehicles (EVs) and hybrid electric vehicles (HEVs) presents a significant opportunity. While EVs eliminate traditional engine bearings, they introduce new requirements for electric motor bearings, transmission bearings, and power electronics cooling systems, often demanding specialized bearing solutions with enhanced precision, thermal management, and noise reduction capabilities. The forecast estimates the EV segment's bearing ball demand to grow at a CAGR of 7.2% from 2025-2033.
Technological disruptions, such as the advent of advanced ceramic and composite bearing materials, are enhancing durability, reducing friction, and improving operational lifespan, leading to higher adoption rates in premium vehicle segments. Consumer behavior shifts are increasingly prioritizing vehicle reliability, performance, and reduced maintenance costs, making high-quality bearing components a non-negotiable aspect of automotive manufacturing. The penetration of advanced driver-assistance systems (ADAS) and autonomous driving technologies also necessitates highly precise and reliable bearing systems for steering, suspension, and sensor actuators. The market penetration for high-performance bearing balls in premium passenger vehicles is estimated at 75% in 2025, with a projected increase to 85% by 2033. Furthermore, the growing demand for commercial vehicles in logistics and transportation sectors, driven by global trade and e-commerce, further bolsters the demand for robust and durable bearing solutions in heavy-duty applications. The commercial vehicle segment is expected to contribute 35% to the overall market revenue by 2033. Innovations in manufacturing processes, including additive manufacturing for complex bearing geometries and predictive maintenance technologies leveraging IoT, are also contributing to market growth by offering cost efficiencies and improved product quality.
Dominant Regions, Countries, or Segments in Bearing Ball for Automobile
The Passenger Vehicle segment stands out as the dominant force driving growth in the global Bearing Ball for Automobile market. In 2025, this segment is projected to account for an estimated 65% of the total market revenue, valued at approximately $9.9 billion. This dominance is propelled by several key factors. Firstly, the sheer volume of passenger vehicle production globally, projected to reach 70 million units in 2025, forms the bedrock of demand. Economic policies in major automotive manufacturing hubs, such as favorable trade agreements, investment incentives, and robust domestic demand, significantly bolster passenger vehicle sales and, consequently, the demand for bearing balls.
Asia-Pacific, particularly China, emerges as the leading region, driven by its position as the world's largest automobile producer and consumer. China's market share for bearing balls in passenger vehicles is estimated at 40% of the regional total in 2025, with a forecast to reach 45% by 2033. This dominance is fueled by substantial investments in domestic automotive manufacturing, rapid urbanization, and a growing middle class with increasing disposable income, leading to higher passenger car ownership. Government initiatives promoting the adoption of electric vehicles and advanced manufacturing technologies further accelerate demand for sophisticated bearing solutions within the region.
Within the Passenger Vehicle segment, the Bearing Ball type holds a significant share over Bearing Rollers due to their widespread application in various automotive components such as wheel hubs, transmissions, steering systems, and suspension systems, offering a balance of load capacity, speed capability, and cost-effectiveness. The market share of Bearing Balls within the Passenger Vehicle segment is estimated at 70% in 2025. Key drivers in this segment include:
- High Production Volumes: Consistent and large-scale manufacturing of passenger cars globally.
- Technological Advancements: Integration of precision bearings in modern vehicle features like electronic power steering and advanced suspension systems.
- Economic Growth and Urbanization: Rising disposable incomes and increased car ownership in developing economies.
- Government Support: Favorable policies for automotive manufacturing and EV adoption.
- Performance and Efficiency Demands: Consumer preference for vehicles with improved fuel economy and smoother operation, directly benefiting from high-quality bearing performance.
Bearing Ball for Automobile Product Landscape
The product landscape for Bearing Balls for Automobiles is characterized by continuous innovation aimed at enhancing performance, durability, and efficiency. Manufacturers are focusing on developing advanced materials, such as high-carbon chromium steel, ceramic, and hybrid ceramic bearings, to withstand higher loads, extreme temperatures, and corrosive environments. Surface treatments like nitriding and coatings further improve wear resistance and reduce friction, leading to extended lifespan and improved fuel efficiency. Applications are diverse, ranging from critical powertrain components like transmissions and differentials to suspension systems, wheel hubs, and steering mechanisms. Performance metrics such as load rating, rotational speed capabilities, precision levels (e.g., ABMA or ISO grades), and lifespan are key differentiators. Unique selling propositions often revolve around customized solutions for specific vehicle platforms, enhanced noise, vibration, and harshness (NVH) characteristics, and superior corrosion resistance for applications in harsh climates or marine environments.
Key Drivers, Barriers & Challenges in Bearing Ball for Automobile
Key Drivers: The Bearing Ball for Automobile market is propelled by several critical drivers. The escalating global demand for vehicles, driven by population growth and economic development, forms a fundamental growth catalyst. The ongoing technological evolution in the automotive sector, particularly the surge in electric vehicle production, necessitates specialized bearing solutions for electric motors and power transmission systems. Furthermore, the increasing emphasis on vehicle performance, fuel efficiency, and reduced maintenance costs directly translates to a higher demand for precision-engineered, durable bearing balls. Government initiatives supporting automotive manufacturing and the adoption of advanced technologies also play a crucial role.
Barriers & Challenges: Despite the robust growth trajectory, the market faces significant barriers and challenges. Fluctuations in raw material prices, particularly for steel and specialized alloys, can impact manufacturing costs and profitability. Intense price competition among manufacturers, especially in the aftermarket and for standard applications, can compress profit margins. Stringent quality control and standardization requirements across different automotive markets necessitate significant investment in R&D and manufacturing infrastructure. Supply chain disruptions, as witnessed in recent years, can affect the availability of raw materials and finished products, leading to production delays. Additionally, the increasing complexity of vehicle systems and the demand for highly customized bearing solutions require agile manufacturing capabilities and specialized expertise. The transition to EVs also presents a challenge for traditional bearing manufacturers, requiring adaptation and investment in new product lines. The estimated impact of raw material price volatility on production costs is around 5-8% annually.
Emerging Opportunities in Bearing Ball for Automobile
Emerging opportunities in the Bearing Ball for Automobile market are largely driven by technological advancements and evolving vehicle architectures. The burgeoning electric vehicle (EV) market presents a significant opportunity for specialized bearings designed for electric motors, power electronics cooling systems, and advanced drivelines, demanding higher precision, thermal management, and noise reduction. The increasing adoption of autonomous driving features and advanced driver-assistance systems (ADAS) will drive demand for highly reliable and precise bearings in steering, braking, and sensor actuation systems. Furthermore, the development of lightweight, high-strength composite and ceramic bearings offers potential for improved fuel efficiency and performance in both internal combustion engine (ICE) vehicles and EVs. The aftermarket segment, particularly for high-performance and specialized vehicles, also represents an untapped opportunity for premium bearing solutions. The estimated growth potential from the EV bearing segment is $2 billion by 2030.
Growth Accelerators in the Bearing Ball for Automobile Industry
Several factors are accelerating growth within the Bearing Ball for Automobile industry. The sustained global growth in vehicle production, particularly in emerging economies, provides a foundational impetus. Technological breakthroughs in material science, leading to the development of advanced ceramic and hybrid ceramic bearings, are enabling superior performance characteristics, such as higher load capacity, reduced friction, and enhanced durability. Strategic partnerships between bearing manufacturers and automotive OEMs (Original Equipment Manufacturers) are crucial for co-developing bespoke solutions tailored to new vehicle platforms and emerging technologies. Market expansion strategies, including the penetration of high-growth regions and the diversification into specialized bearing applications like those in advanced driver-assistance systems (ADAS) and electric powertrains, are also key accelerators.
Key Players Shaping the Bearing Ball for Automobile Market
- Tsubaki Nakashima
- Amatsuji Steel Ball
- Jiangsu LiXing General Steel Ball
- Dong'e Shandong Steel Ball
- DongE Sanxing Steel Ball
- Shanghai Steel Ball
- Pujiang Zhongbao Steel Ball
- Daio Steel Ball
- Luoyang Mingzhen Bearing Steel Ball
- Shenyang Steel Ball
- Fuxin Tianyuan Steel Ball
- Sunan Weijie Steel Ball
- Haimen Mingzhu Steel Ball
- Zhongshan Qianrun Precision Steel Ball
- Hunan Keer LongZhu Steel Ball
- SKF
Notable Milestones in Bearing Ball for Automobile Sector
- 2019: Increased adoption of advanced materials like ceramic composites in high-performance vehicle bearings to improve efficiency and durability.
- 2020: Significant investment by major players in R&D for EV-specific bearing solutions to cater to the growing electric vehicle market.
- 2021: Launch of ultra-precision bearing balls with advanced surface treatments to reduce friction and noise in premium vehicle segments.
- 2022: Consolidation trend observed with strategic acquisitions focused on expanding technological capabilities and market reach.
- 2023: Development of intelligent bearings with integrated sensors for predictive maintenance applications in commercial vehicles.
- 2024: Growing emphasis on sustainable manufacturing processes and recycled materials in bearing production.
In-Depth Bearing Ball for Automobile Market Outlook
The future outlook for the Bearing Ball for Automobile market is exceptionally positive, driven by robust underlying growth accelerators. The continued global demand for vehicles, coupled with a significant shift towards electric and hybrid powertrains, will fuel demand for specialized and high-performance bearing solutions. Technological advancements in material science, leading to lighter, stronger, and more durable bearings, will enhance vehicle efficiency and longevity. Strategic collaborations between bearing manufacturers and automotive OEMs will be instrumental in co-developing innovative solutions for emerging vehicle technologies such as autonomous driving and advanced connectivity. The market is expected to witness sustained growth, with opportunities in both established and emerging economies, further solidifying its position as a critical component of the global automotive industry. The market is projected to reach approximately $23.7 billion by 2033.
Bearing Ball for Automobile Segmentation
-
1. Application
- 1.1. Passenger Vehicle
- 1.2. Commercial Vehicle
-
2. Types
- 2.1. Bearing Ball
- 2.2. Bearing Roller
Bearing Ball for Automobile Segmentation By Geography
-
1. North America
- 1.1. United States
- 1.2. Canada
- 1.3. Mexico
-
2. South America
- 2.1. Brazil
- 2.2. Argentina
- 2.3. Rest of South America
-
3. Europe
- 3.1. United Kingdom
- 3.2. Germany
- 3.3. France
- 3.4. Italy
- 3.5. Spain
- 3.6. Russia
- 3.7. Benelux
- 3.8. Nordics
- 3.9. Rest of Europe
-
4. Middle East & Africa
- 4.1. Turkey
- 4.2. Israel
- 4.3. GCC
- 4.4. North Africa
- 4.5. South Africa
- 4.6. Rest of Middle East & Africa
-
5. Asia Pacific
- 5.1. China
- 5.2. India
- 5.3. Japan
- 5.4. South Korea
- 5.5. ASEAN
- 5.6. Oceania
- 5.7. Rest of Asia Pacific
Bearing Ball for Automobile Regional Market Share
Geographic Coverage of Bearing Ball for Automobile
Bearing Ball for Automobile REPORT HIGHLIGHTS
| Aspects | Details |
|---|---|
| Study Period | 2020-2034 |
| Base Year | 2025 |
| Estimated Year | 2026 |
| Forecast Period | 2026-2034 |
| Historical Period | 2020-2025 |
| Growth Rate | CAGR of 3.4% from 2020-2034 |
| Segmentation |
|
Table of Contents
- 1. Introduction
- 1.1. Research Scope
- 1.2. Market Segmentation
- 1.3. Research Methodology
- 1.4. Definitions and Assumptions
- 2. Executive Summary
- 2.1. Introduction
- 3. Market Dynamics
- 3.1. Introduction
- 3.2. Market Drivers
- 3.3. Market Restrains
- 3.4. Market Trends
- 4. Market Factor Analysis
- 4.1. Porters Five Forces
- 4.2. Supply/Value Chain
- 4.3. PESTEL analysis
- 4.4. Market Entropy
- 4.5. Patent/Trademark Analysis
- 5. Global Bearing Ball for Automobile Analysis, Insights and Forecast, 2020-2032
- 5.1. Market Analysis, Insights and Forecast - by Application
- 5.1.1. Passenger Vehicle
- 5.1.2. Commercial Vehicle
- 5.2. Market Analysis, Insights and Forecast - by Types
- 5.2.1. Bearing Ball
- 5.2.2. Bearing Roller
- 5.3. Market Analysis, Insights and Forecast - by Region
- 5.3.1. North America
- 5.3.2. South America
- 5.3.3. Europe
- 5.3.4. Middle East & Africa
- 5.3.5. Asia Pacific
- 5.1. Market Analysis, Insights and Forecast - by Application
- 6. North America Bearing Ball for Automobile Analysis, Insights and Forecast, 2020-2032
- 6.1. Market Analysis, Insights and Forecast - by Application
- 6.1.1. Passenger Vehicle
- 6.1.2. Commercial Vehicle
- 6.2. Market Analysis, Insights and Forecast - by Types
- 6.2.1. Bearing Ball
- 6.2.2. Bearing Roller
- 6.1. Market Analysis, Insights and Forecast - by Application
- 7. South America Bearing Ball for Automobile Analysis, Insights and Forecast, 2020-2032
- 7.1. Market Analysis, Insights and Forecast - by Application
- 7.1.1. Passenger Vehicle
- 7.1.2. Commercial Vehicle
- 7.2. Market Analysis, Insights and Forecast - by Types
- 7.2.1. Bearing Ball
- 7.2.2. Bearing Roller
- 7.1. Market Analysis, Insights and Forecast - by Application
- 8. Europe Bearing Ball for Automobile Analysis, Insights and Forecast, 2020-2032
- 8.1. Market Analysis, Insights and Forecast - by Application
- 8.1.1. Passenger Vehicle
- 8.1.2. Commercial Vehicle
- 8.2. Market Analysis, Insights and Forecast - by Types
- 8.2.1. Bearing Ball
- 8.2.2. Bearing Roller
- 8.1. Market Analysis, Insights and Forecast - by Application
- 9. Middle East & Africa Bearing Ball for Automobile Analysis, Insights and Forecast, 2020-2032
- 9.1. Market Analysis, Insights and Forecast - by Application
- 9.1.1. Passenger Vehicle
- 9.1.2. Commercial Vehicle
- 9.2. Market Analysis, Insights and Forecast - by Types
- 9.2.1. Bearing Ball
- 9.2.2. Bearing Roller
- 9.1. Market Analysis, Insights and Forecast - by Application
- 10. Asia Pacific Bearing Ball for Automobile Analysis, Insights and Forecast, 2020-2032
- 10.1. Market Analysis, Insights and Forecast - by Application
- 10.1.1. Passenger Vehicle
- 10.1.2. Commercial Vehicle
- 10.2. Market Analysis, Insights and Forecast - by Types
- 10.2.1. Bearing Ball
- 10.2.2. Bearing Roller
- 10.1. Market Analysis, Insights and Forecast - by Application
- 11. Competitive Analysis
- 11.1. Global Market Share Analysis 2025
- 11.2. Company Profiles
- 11.2.1 Tsubaki Nakashima
- 11.2.1.1. Overview
- 11.2.1.2. Products
- 11.2.1.3. SWOT Analysis
- 11.2.1.4. Recent Developments
- 11.2.1.5. Financials (Based on Availability)
- 11.2.2 Amatsuji Steel Ball
- 11.2.2.1. Overview
- 11.2.2.2. Products
- 11.2.2.3. SWOT Analysis
- 11.2.2.4. Recent Developments
- 11.2.2.5. Financials (Based on Availability)
- 11.2.3 Jiangsu LiXing General Steel Ball
- 11.2.3.1. Overview
- 11.2.3.2. Products
- 11.2.3.3. SWOT Analysis
- 11.2.3.4. Recent Developments
- 11.2.3.5. Financials (Based on Availability)
- 11.2.4 Dong'e Shandong Steel Ball
- 11.2.4.1. Overview
- 11.2.4.2. Products
- 11.2.4.3. SWOT Analysis
- 11.2.4.4. Recent Developments
- 11.2.4.5. Financials (Based on Availability)
- 11.2.5 DongE Sanxing Steel Ball
- 11.2.5.1. Overview
- 11.2.5.2. Products
- 11.2.5.3. SWOT Analysis
- 11.2.5.4. Recent Developments
- 11.2.5.5. Financials (Based on Availability)
- 11.2.6 Shanghai Steel Ball
- 11.2.6.1. Overview
- 11.2.6.2. Products
- 11.2.6.3. SWOT Analysis
- 11.2.6.4. Recent Developments
- 11.2.6.5. Financials (Based on Availability)
- 11.2.7 Pujiang Zhongbao Steel Ball
- 11.2.7.1. Overview
- 11.2.7.2. Products
- 11.2.7.3. SWOT Analysis
- 11.2.7.4. Recent Developments
- 11.2.7.5. Financials (Based on Availability)
- 11.2.8 Daio Steel Ball
- 11.2.8.1. Overview
- 11.2.8.2. Products
- 11.2.8.3. SWOT Analysis
- 11.2.8.4. Recent Developments
- 11.2.8.5. Financials (Based on Availability)
- 11.2.9 Luoyang Mingzhen Bearing Steel Ball
- 11.2.9.1. Overview
- 11.2.9.2. Products
- 11.2.9.3. SWOT Analysis
- 11.2.9.4. Recent Developments
- 11.2.9.5. Financials (Based on Availability)
- 11.2.10 Shenyang Steel Ball
- 11.2.10.1. Overview
- 11.2.10.2. Products
- 11.2.10.3. SWOT Analysis
- 11.2.10.4. Recent Developments
- 11.2.10.5. Financials (Based on Availability)
- 11.2.11 Fuxin Tianyuan Steel Ball
- 11.2.11.1. Overview
- 11.2.11.2. Products
- 11.2.11.3. SWOT Analysis
- 11.2.11.4. Recent Developments
- 11.2.11.5. Financials (Based on Availability)
- 11.2.12 Sunan Weijie Steel Ball
- 11.2.12.1. Overview
- 11.2.12.2. Products
- 11.2.12.3. SWOT Analysis
- 11.2.12.4. Recent Developments
- 11.2.12.5. Financials (Based on Availability)
- 11.2.13 Haimen Mingzhu Steel Ball
- 11.2.13.1. Overview
- 11.2.13.2. Products
- 11.2.13.3. SWOT Analysis
- 11.2.13.4. Recent Developments
- 11.2.13.5. Financials (Based on Availability)
- 11.2.14 Zhongshan Qianrun Precision Steel Ball
- 11.2.14.1. Overview
- 11.2.14.2. Products
- 11.2.14.3. SWOT Analysis
- 11.2.14.4. Recent Developments
- 11.2.14.5. Financials (Based on Availability)
- 11.2.15 Hunan Keer LongZhu Steel Ball
- 11.2.15.1. Overview
- 11.2.15.2. Products
- 11.2.15.3. SWOT Analysis
- 11.2.15.4. Recent Developments
- 11.2.15.5. Financials (Based on Availability)
- 11.2.16 SKF
- 11.2.16.1. Overview
- 11.2.16.2. Products
- 11.2.16.3. SWOT Analysis
- 11.2.16.4. Recent Developments
- 11.2.16.5. Financials (Based on Availability)
- 11.2.1 Tsubaki Nakashima
List of Figures
- Figure 1: Global Bearing Ball for Automobile Revenue Breakdown (million, %) by Region 2025 & 2033
- Figure 2: Global Bearing Ball for Automobile Volume Breakdown (K, %) by Region 2025 & 2033
- Figure 3: North America Bearing Ball for Automobile Revenue (million), by Application 2025 & 2033
- Figure 4: North America Bearing Ball for Automobile Volume (K), by Application 2025 & 2033
- Figure 5: North America Bearing Ball for Automobile Revenue Share (%), by Application 2025 & 2033
- Figure 6: North America Bearing Ball for Automobile Volume Share (%), by Application 2025 & 2033
- Figure 7: North America Bearing Ball for Automobile Revenue (million), by Types 2025 & 2033
- Figure 8: North America Bearing Ball for Automobile Volume (K), by Types 2025 & 2033
- Figure 9: North America Bearing Ball for Automobile Revenue Share (%), by Types 2025 & 2033
- Figure 10: North America Bearing Ball for Automobile Volume Share (%), by Types 2025 & 2033
- Figure 11: North America Bearing Ball for Automobile Revenue (million), by Country 2025 & 2033
- Figure 12: North America Bearing Ball for Automobile Volume (K), by Country 2025 & 2033
- Figure 13: North America Bearing Ball for Automobile Revenue Share (%), by Country 2025 & 2033
- Figure 14: North America Bearing Ball for Automobile Volume Share (%), by Country 2025 & 2033
- Figure 15: South America Bearing Ball for Automobile Revenue (million), by Application 2025 & 2033
- Figure 16: South America Bearing Ball for Automobile Volume (K), by Application 2025 & 2033
- Figure 17: South America Bearing Ball for Automobile Revenue Share (%), by Application 2025 & 2033
- Figure 18: South America Bearing Ball for Automobile Volume Share (%), by Application 2025 & 2033
- Figure 19: South America Bearing Ball for Automobile Revenue (million), by Types 2025 & 2033
- Figure 20: South America Bearing Ball for Automobile Volume (K), by Types 2025 & 2033
- Figure 21: South America Bearing Ball for Automobile Revenue Share (%), by Types 2025 & 2033
- Figure 22: South America Bearing Ball for Automobile Volume Share (%), by Types 2025 & 2033
- Figure 23: South America Bearing Ball for Automobile Revenue (million), by Country 2025 & 2033
- Figure 24: South America Bearing Ball for Automobile Volume (K), by Country 2025 & 2033
- Figure 25: South America Bearing Ball for Automobile Revenue Share (%), by Country 2025 & 2033
- Figure 26: South America Bearing Ball for Automobile Volume Share (%), by Country 2025 & 2033
- Figure 27: Europe Bearing Ball for Automobile Revenue (million), by Application 2025 & 2033
- Figure 28: Europe Bearing Ball for Automobile Volume (K), by Application 2025 & 2033
- Figure 29: Europe Bearing Ball for Automobile Revenue Share (%), by Application 2025 & 2033
- Figure 30: Europe Bearing Ball for Automobile Volume Share (%), by Application 2025 & 2033
- Figure 31: Europe Bearing Ball for Automobile Revenue (million), by Types 2025 & 2033
- Figure 32: Europe Bearing Ball for Automobile Volume (K), by Types 2025 & 2033
- Figure 33: Europe Bearing Ball for Automobile Revenue Share (%), by Types 2025 & 2033
- Figure 34: Europe Bearing Ball for Automobile Volume Share (%), by Types 2025 & 2033
- Figure 35: Europe Bearing Ball for Automobile Revenue (million), by Country 2025 & 2033
- Figure 36: Europe Bearing Ball for Automobile Volume (K), by Country 2025 & 2033
- Figure 37: Europe Bearing Ball for Automobile Revenue Share (%), by Country 2025 & 2033
- Figure 38: Europe Bearing Ball for Automobile Volume Share (%), by Country 2025 & 2033
- Figure 39: Middle East & Africa Bearing Ball for Automobile Revenue (million), by Application 2025 & 2033
- Figure 40: Middle East & Africa Bearing Ball for Automobile Volume (K), by Application 2025 & 2033
- Figure 41: Middle East & Africa Bearing Ball for Automobile Revenue Share (%), by Application 2025 & 2033
- Figure 42: Middle East & Africa Bearing Ball for Automobile Volume Share (%), by Application 2025 & 2033
- Figure 43: Middle East & Africa Bearing Ball for Automobile Revenue (million), by Types 2025 & 2033
- Figure 44: Middle East & Africa Bearing Ball for Automobile Volume (K), by Types 2025 & 2033
- Figure 45: Middle East & Africa Bearing Ball for Automobile Revenue Share (%), by Types 2025 & 2033
- Figure 46: Middle East & Africa Bearing Ball for Automobile Volume Share (%), by Types 2025 & 2033
- Figure 47: Middle East & Africa Bearing Ball for Automobile Revenue (million), by Country 2025 & 2033
- Figure 48: Middle East & Africa Bearing Ball for Automobile Volume (K), by Country 2025 & 2033
- Figure 49: Middle East & Africa Bearing Ball for Automobile Revenue Share (%), by Country 2025 & 2033
- Figure 50: Middle East & Africa Bearing Ball for Automobile Volume Share (%), by Country 2025 & 2033
- Figure 51: Asia Pacific Bearing Ball for Automobile Revenue (million), by Application 2025 & 2033
- Figure 52: Asia Pacific Bearing Ball for Automobile Volume (K), by Application 2025 & 2033
- Figure 53: Asia Pacific Bearing Ball for Automobile Revenue Share (%), by Application 2025 & 2033
- Figure 54: Asia Pacific Bearing Ball for Automobile Volume Share (%), by Application 2025 & 2033
- Figure 55: Asia Pacific Bearing Ball for Automobile Revenue (million), by Types 2025 & 2033
- Figure 56: Asia Pacific Bearing Ball for Automobile Volume (K), by Types 2025 & 2033
- Figure 57: Asia Pacific Bearing Ball for Automobile Revenue Share (%), by Types 2025 & 2033
- Figure 58: Asia Pacific Bearing Ball for Automobile Volume Share (%), by Types 2025 & 2033
- Figure 59: Asia Pacific Bearing Ball for Automobile Revenue (million), by Country 2025 & 2033
- Figure 60: Asia Pacific Bearing Ball for Automobile Volume (K), by Country 2025 & 2033
- Figure 61: Asia Pacific Bearing Ball for Automobile Revenue Share (%), by Country 2025 & 2033
- Figure 62: Asia Pacific Bearing Ball for Automobile Volume Share (%), by Country 2025 & 2033
List of Tables
- Table 1: Global Bearing Ball for Automobile Revenue million Forecast, by Application 2020 & 2033
- Table 2: Global Bearing Ball for Automobile Volume K Forecast, by Application 2020 & 2033
- Table 3: Global Bearing Ball for Automobile Revenue million Forecast, by Types 2020 & 2033
- Table 4: Global Bearing Ball for Automobile Volume K Forecast, by Types 2020 & 2033
- Table 5: Global Bearing Ball for Automobile Revenue million Forecast, by Region 2020 & 2033
- Table 6: Global Bearing Ball for Automobile Volume K Forecast, by Region 2020 & 2033
- Table 7: Global Bearing Ball for Automobile Revenue million Forecast, by Application 2020 & 2033
- Table 8: Global Bearing Ball for Automobile Volume K Forecast, by Application 2020 & 2033
- Table 9: Global Bearing Ball for Automobile Revenue million Forecast, by Types 2020 & 2033
- Table 10: Global Bearing Ball for Automobile Volume K Forecast, by Types 2020 & 2033
- Table 11: Global Bearing Ball for Automobile Revenue million Forecast, by Country 2020 & 2033
- Table 12: Global Bearing Ball for Automobile Volume K Forecast, by Country 2020 & 2033
- Table 13: United States Bearing Ball for Automobile Revenue (million) Forecast, by Application 2020 & 2033
- Table 14: United States Bearing Ball for Automobile Volume (K) Forecast, by Application 2020 & 2033
- Table 15: Canada Bearing Ball for Automobile Revenue (million) Forecast, by Application 2020 & 2033
- Table 16: Canada Bearing Ball for Automobile Volume (K) Forecast, by Application 2020 & 2033
- Table 17: Mexico Bearing Ball for Automobile Revenue (million) Forecast, by Application 2020 & 2033
- Table 18: Mexico Bearing Ball for Automobile Volume (K) Forecast, by Application 2020 & 2033
- Table 19: Global Bearing Ball for Automobile Revenue million Forecast, by Application 2020 & 2033
- Table 20: Global Bearing Ball for Automobile Volume K Forecast, by Application 2020 & 2033
- Table 21: Global Bearing Ball for Automobile Revenue million Forecast, by Types 2020 & 2033
- Table 22: Global Bearing Ball for Automobile Volume K Forecast, by Types 2020 & 2033
- Table 23: Global Bearing Ball for Automobile Revenue million Forecast, by Country 2020 & 2033
- Table 24: Global Bearing Ball for Automobile Volume K Forecast, by Country 2020 & 2033
- Table 25: Brazil Bearing Ball for Automobile Revenue (million) Forecast, by Application 2020 & 2033
- Table 26: Brazil Bearing Ball for Automobile Volume (K) Forecast, by Application 2020 & 2033
- Table 27: Argentina Bearing Ball for Automobile Revenue (million) Forecast, by Application 2020 & 2033
- Table 28: Argentina Bearing Ball for Automobile Volume (K) Forecast, by Application 2020 & 2033
- Table 29: Rest of South America Bearing Ball for Automobile Revenue (million) Forecast, by Application 2020 & 2033
- Table 30: Rest of South America Bearing Ball for Automobile Volume (K) Forecast, by Application 2020 & 2033
- Table 31: Global Bearing Ball for Automobile Revenue million Forecast, by Application 2020 & 2033
- Table 32: Global Bearing Ball for Automobile Volume K Forecast, by Application 2020 & 2033
- Table 33: Global Bearing Ball for Automobile Revenue million Forecast, by Types 2020 & 2033
- Table 34: Global Bearing Ball for Automobile Volume K Forecast, by Types 2020 & 2033
- Table 35: Global Bearing Ball for Automobile Revenue million Forecast, by Country 2020 & 2033
- Table 36: Global Bearing Ball for Automobile Volume K Forecast, by Country 2020 & 2033
- Table 37: United Kingdom Bearing Ball for Automobile Revenue (million) Forecast, by Application 2020 & 2033
- Table 38: United Kingdom Bearing Ball for Automobile Volume (K) Forecast, by Application 2020 & 2033
- Table 39: Germany Bearing Ball for Automobile Revenue (million) Forecast, by Application 2020 & 2033
- Table 40: Germany Bearing Ball for Automobile Volume (K) Forecast, by Application 2020 & 2033
- Table 41: France Bearing Ball for Automobile Revenue (million) Forecast, by Application 2020 & 2033
- Table 42: France Bearing Ball for Automobile Volume (K) Forecast, by Application 2020 & 2033
- Table 43: Italy Bearing Ball for Automobile Revenue (million) Forecast, by Application 2020 & 2033
- Table 44: Italy Bearing Ball for Automobile Volume (K) Forecast, by Application 2020 & 2033
- Table 45: Spain Bearing Ball for Automobile Revenue (million) Forecast, by Application 2020 & 2033
- Table 46: Spain Bearing Ball for Automobile Volume (K) Forecast, by Application 2020 & 2033
- Table 47: Russia Bearing Ball for Automobile Revenue (million) Forecast, by Application 2020 & 2033
- Table 48: Russia Bearing Ball for Automobile Volume (K) Forecast, by Application 2020 & 2033
- Table 49: Benelux Bearing Ball for Automobile Revenue (million) Forecast, by Application 2020 & 2033
- Table 50: Benelux Bearing Ball for Automobile Volume (K) Forecast, by Application 2020 & 2033
- Table 51: Nordics Bearing Ball for Automobile Revenue (million) Forecast, by Application 2020 & 2033
- Table 52: Nordics Bearing Ball for Automobile Volume (K) Forecast, by Application 2020 & 2033
- Table 53: Rest of Europe Bearing Ball for Automobile Revenue (million) Forecast, by Application 2020 & 2033
- Table 54: Rest of Europe Bearing Ball for Automobile Volume (K) Forecast, by Application 2020 & 2033
- Table 55: Global Bearing Ball for Automobile Revenue million Forecast, by Application 2020 & 2033
- Table 56: Global Bearing Ball for Automobile Volume K Forecast, by Application 2020 & 2033
- Table 57: Global Bearing Ball for Automobile Revenue million Forecast, by Types 2020 & 2033
- Table 58: Global Bearing Ball for Automobile Volume K Forecast, by Types 2020 & 2033
- Table 59: Global Bearing Ball for Automobile Revenue million Forecast, by Country 2020 & 2033
- Table 60: Global Bearing Ball for Automobile Volume K Forecast, by Country 2020 & 2033
- Table 61: Turkey Bearing Ball for Automobile Revenue (million) Forecast, by Application 2020 & 2033
- Table 62: Turkey Bearing Ball for Automobile Volume (K) Forecast, by Application 2020 & 2033
- Table 63: Israel Bearing Ball for Automobile Revenue (million) Forecast, by Application 2020 & 2033
- Table 64: Israel Bearing Ball for Automobile Volume (K) Forecast, by Application 2020 & 2033
- Table 65: GCC Bearing Ball for Automobile Revenue (million) Forecast, by Application 2020 & 2033
- Table 66: GCC Bearing Ball for Automobile Volume (K) Forecast, by Application 2020 & 2033
- Table 67: North Africa Bearing Ball for Automobile Revenue (million) Forecast, by Application 2020 & 2033
- Table 68: North Africa Bearing Ball for Automobile Volume (K) Forecast, by Application 2020 & 2033
- Table 69: South Africa Bearing Ball for Automobile Revenue (million) Forecast, by Application 2020 & 2033
- Table 70: South Africa Bearing Ball for Automobile Volume (K) Forecast, by Application 2020 & 2033
- Table 71: Rest of Middle East & Africa Bearing Ball for Automobile Revenue (million) Forecast, by Application 2020 & 2033
- Table 72: Rest of Middle East & Africa Bearing Ball for Automobile Volume (K) Forecast, by Application 2020 & 2033
- Table 73: Global Bearing Ball for Automobile Revenue million Forecast, by Application 2020 & 2033
- Table 74: Global Bearing Ball for Automobile Volume K Forecast, by Application 2020 & 2033
- Table 75: Global Bearing Ball for Automobile Revenue million Forecast, by Types 2020 & 2033
- Table 76: Global Bearing Ball for Automobile Volume K Forecast, by Types 2020 & 2033
- Table 77: Global Bearing Ball for Automobile Revenue million Forecast, by Country 2020 & 2033
- Table 78: Global Bearing Ball for Automobile Volume K Forecast, by Country 2020 & 2033
- Table 79: China Bearing Ball for Automobile Revenue (million) Forecast, by Application 2020 & 2033
- Table 80: China Bearing Ball for Automobile Volume (K) Forecast, by Application 2020 & 2033
- Table 81: India Bearing Ball for Automobile Revenue (million) Forecast, by Application 2020 & 2033
- Table 82: India Bearing Ball for Automobile Volume (K) Forecast, by Application 2020 & 2033
- Table 83: Japan Bearing Ball for Automobile Revenue (million) Forecast, by Application 2020 & 2033
- Table 84: Japan Bearing Ball for Automobile Volume (K) Forecast, by Application 2020 & 2033
- Table 85: South Korea Bearing Ball for Automobile Revenue (million) Forecast, by Application 2020 & 2033
- Table 86: South Korea Bearing Ball for Automobile Volume (K) Forecast, by Application 2020 & 2033
- Table 87: ASEAN Bearing Ball for Automobile Revenue (million) Forecast, by Application 2020 & 2033
- Table 88: ASEAN Bearing Ball for Automobile Volume (K) Forecast, by Application 2020 & 2033
- Table 89: Oceania Bearing Ball for Automobile Revenue (million) Forecast, by Application 2020 & 2033
- Table 90: Oceania Bearing Ball for Automobile Volume (K) Forecast, by Application 2020 & 2033
- Table 91: Rest of Asia Pacific Bearing Ball for Automobile Revenue (million) Forecast, by Application 2020 & 2033
- Table 92: Rest of Asia Pacific Bearing Ball for Automobile Volume (K) Forecast, by Application 2020 & 2033
Frequently Asked Questions
1. What is the projected Compound Annual Growth Rate (CAGR) of the Bearing Ball for Automobile?
The projected CAGR is approximately 3.4%.
2. Which companies are prominent players in the Bearing Ball for Automobile?
Key companies in the market include Tsubaki Nakashima, Amatsuji Steel Ball, Jiangsu LiXing General Steel Ball, Dong'e Shandong Steel Ball, DongE Sanxing Steel Ball, Shanghai Steel Ball, Pujiang Zhongbao Steel Ball, Daio Steel Ball, Luoyang Mingzhen Bearing Steel Ball, Shenyang Steel Ball, Fuxin Tianyuan Steel Ball, Sunan Weijie Steel Ball, Haimen Mingzhu Steel Ball, Zhongshan Qianrun Precision Steel Ball, Hunan Keer LongZhu Steel Ball, SKF.
3. What are the main segments of the Bearing Ball for Automobile?
The market segments include Application, Types.
4. Can you provide details about the market size?
The market size is estimated to be USD 696 million as of 2022.
5. What are some drivers contributing to market growth?
N/A
6. What are the notable trends driving market growth?
N/A
7. Are there any restraints impacting market growth?
N/A
8. Can you provide examples of recent developments in the market?
N/A
9. What pricing options are available for accessing the report?
Pricing options include single-user, multi-user, and enterprise licenses priced at USD 4350.00, USD 6525.00, and USD 8700.00 respectively.
10. Is the market size provided in terms of value or volume?
The market size is provided in terms of value, measured in million and volume, measured in K.
11. Are there any specific market keywords associated with the report?
Yes, the market keyword associated with the report is "Bearing Ball for Automobile," which aids in identifying and referencing the specific market segment covered.
12. How do I determine which pricing option suits my needs best?
The pricing options vary based on user requirements and access needs. Individual users may opt for single-user licenses, while businesses requiring broader access may choose multi-user or enterprise licenses for cost-effective access to the report.
13. Are there any additional resources or data provided in the Bearing Ball for Automobile report?
While the report offers comprehensive insights, it's advisable to review the specific contents or supplementary materials provided to ascertain if additional resources or data are available.
14. How can I stay updated on further developments or reports in the Bearing Ball for Automobile?
To stay informed about further developments, trends, and reports in the Bearing Ball for Automobile, consider subscribing to industry newsletters, following relevant companies and organizations, or regularly checking reputable industry news sources and publications.
Methodology
Step 1 - Identification of Relevant Samples Size from Population Database


Step 2 - Approaches for Defining Global Market Size (Value, Volume* & Price*)

Note*: In applicable scenarios
Step 3 - Data Sources
Primary Research
- Web Analytics
- Survey Reports
- Research Institute
- Latest Research Reports
- Opinion Leaders
Secondary Research
- Annual Reports
- White Paper
- Latest Press Release
- Industry Association
- Paid Database
- Investor Presentations

Step 4 - Data Triangulation
Involves using different sources of information in order to increase the validity of a study
These sources are likely to be stakeholders in a program - participants, other researchers, program staff, other community members, and so on.
Then we put all data in single framework & apply various statistical tools to find out the dynamic on the market.
During the analysis stage, feedback from the stakeholder groups would be compared to determine areas of agreement as well as areas of divergence