

Key Insights
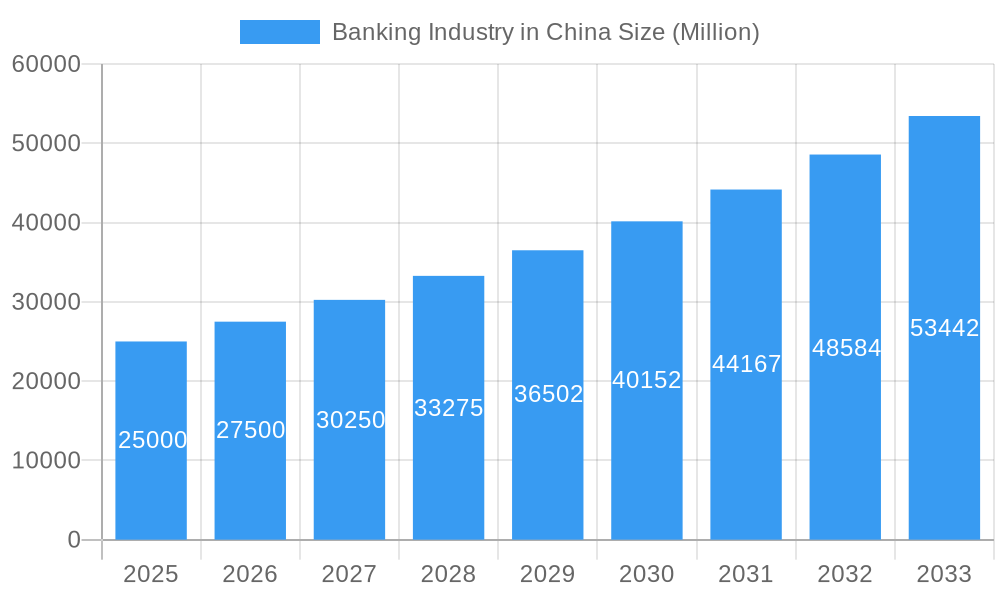
China's banking industry, a cornerstone of the nation's economic engine, is experiencing robust growth, projected to maintain a Compound Annual Growth Rate (CAGR) of 10% from 2025 to 2033. This expansion is fueled by several key factors. The rapid digitalization of financial services, driven by increasing smartphone penetration and fintech innovation, is significantly boosting transactional volumes and expanding access to banking services across both urban and rural populations. Government initiatives promoting financial inclusion and supporting small and medium-sized enterprises (SMEs) further contribute to this growth. The rising middle class with increased disposable income is also driving demand for a wider array of banking products, including credit cards, loans, and investment products. However, challenges remain. Stringent regulatory oversight aimed at mitigating financial risks and preventing systemic instability presents ongoing hurdles for banks. Competition from burgeoning fintech companies and the need for substantial investments in upgrading IT infrastructure and cybersecurity measures also pose significant obstacles. The industry is witnessing a shift towards digital channels, with mobile banking and online platforms gaining immense popularity, transforming the traditional banking landscape.
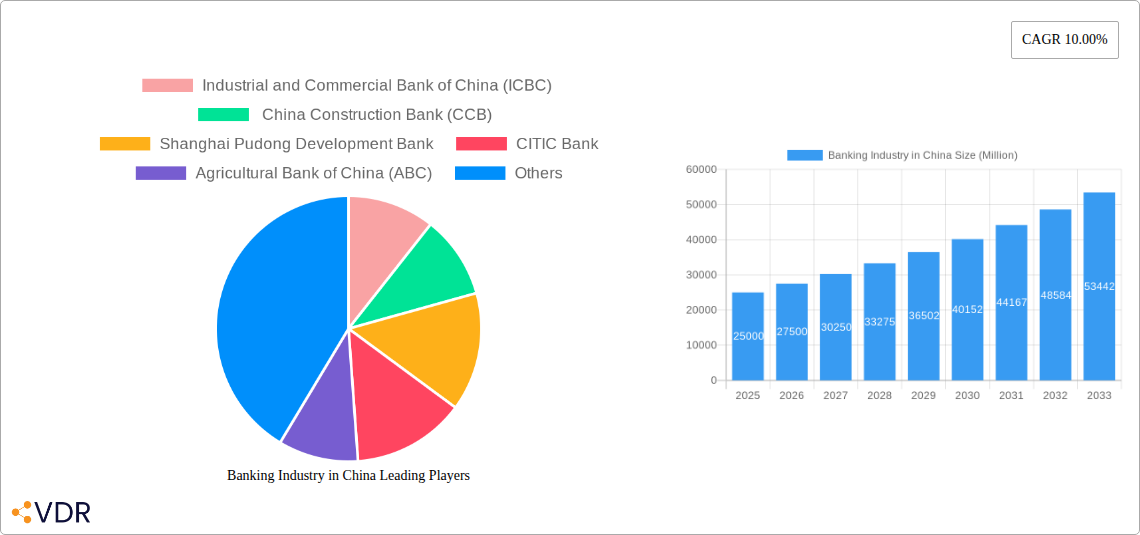
Banking Industry in China Market Size (In Billion)
Segment-wise, the transactional accounts and credit card segments are expected to experience particularly rapid growth, mirroring the escalating digital adoption rate and the increasing reliance on credit for consumption. The industry is also witnessing increased consolidation, with larger banks acquiring smaller institutions to gain market share and expand their product offerings. Geographic distribution reveals significant concentration in major urban centers, yet efforts towards financial inclusion are gradually expanding access to banking services in less-developed regions. The dominance of state-owned banks like ICBC, CCB, and ABC is expected to continue, but privately-owned banks are also actively competing, enhancing innovation and competitiveness within the sector. Future growth hinges on successfully navigating regulatory complexities, investing in technological advancements, and adapting to the evolving needs of a digitally savvy consumer base.
Banking Industry in China Company Market Share
This comprehensive report provides an in-depth analysis of China's banking industry, covering market dynamics, growth trends, key players, and future outlook. The study period spans from 2019 to 2033, with 2025 as the base and estimated year. This report is invaluable for industry professionals, investors, and strategists seeking to understand and capitalize on opportunities within this dynamic market. The report analyzes parent markets (financial services) and child markets (transactional banking, lending, investment banking etc.) for a comprehensive understanding.
Banking Industry in China Market Dynamics & Structure
China's banking sector is characterized by high market concentration, dominated by state-owned giants like ICBC and CCB. Technological innovation, driven by fintech advancements and digitalization, is reshaping the landscape. Stringent regulatory frameworks imposed by the China Banking and Insurance Regulatory Commission (CBIRC) influence operations and risk management. The market faces competitive pressure from fintech companies offering alternative financial services. Demographics shift towards a larger middle class and increasingly tech-savvy population fuels demand for diverse financial products. M&A activity remains significant, albeit under regulatory scrutiny, aiming to consolidate market share and expand service offerings.
- Market Concentration: ICBC and CCB hold a combined market share of approximately xx%.
- Technological Innovation: Rapid adoption of mobile banking, AI, and big data analytics.
- Regulatory Framework: Stringent regulations on capital adequacy, risk management, and data privacy.
- Competitive Substitutes: Rise of fintech companies and alternative payment platforms.
- End-user Demographics: Growing middle class and increasing digital literacy drive demand.
- M&A Trends: xx M&A deals valued at approximately xx Million USD in the historical period.
Banking Industry in China Growth Trends & Insights
The Chinese banking industry experienced robust growth during the historical period (2019-2024), fueled by economic expansion and increasing financial inclusion. The market size reached xx Million units in 2024, exhibiting a CAGR of xx% during the period. Technological disruptions, including the rise of mobile payments and digital lending platforms, have significantly impacted consumer behavior. Adoption rates of digital banking services have surged, leading to a shift towards online and mobile channels. The forecast period (2025-2033) projects continued growth, although at a potentially moderated pace, influenced by macroeconomic factors and regulatory changes. Market penetration of digital banking services is projected to reach xx% by 2033.
Dominant Regions, Countries, or Segments in Banking Industry in China
The coastal regions of China, particularly the Yangtze River Delta and the Pearl River Delta, are the dominant regions for banking activities, accounting for xx% of total market value in 2024. Within product segments, Loans (xx Million units in 2024) and Transactional Accounts (xx Million units in 2024) represent the largest segments, driven by robust economic activity and increasing financial transactions. By Industry, the Services segment enjoys the highest growth due to increasing demand for financial advisory services, wealth management, etc. Direct sales continue to be the dominant channel in 2024, representing xx% of the market.
- Key Drivers: Economic growth, urbanization, rising disposable incomes, supportive government policies.
- Dominance Factors: High population density, advanced infrastructure, and concentration of businesses.
- Growth Potential: Continued expansion of the middle class and increasing demand for sophisticated financial products.
Banking Industry in China Product Landscape
The banking industry offers a broad range of products, including transactional accounts, savings accounts, debit and credit cards, loans (personal, commercial, and mortgage), and other specialized financial services. Recent innovations focus on digitalization, offering mobile banking apps with enhanced security features and personalized financial management tools. Fintech partnerships are driving the development of innovative payment solutions and lending platforms, enhancing customer experience and efficiency. Key performance metrics include customer acquisition cost, loan default rates, and net interest margins.
Key Drivers, Barriers & Challenges in Banking Industry in China
Key Drivers: Government initiatives promoting financial inclusion, rapid technological advancements in fintech, and growing demand for diverse financial services. The Belt and Road Initiative also presents significant expansion opportunities.
Key Challenges: Stringent regulatory compliance, increasing competition from fintech companies, concerns regarding cybersecurity and data privacy, and managing non-performing loans (NPLs). The impact of the NPLs on the overall profitability is estimated at xx% in 2024.
Emerging Opportunities in Banking Industry in China
Untapped markets in rural areas and smaller cities present significant opportunities for expansion. The increasing adoption of digital technologies creates scope for innovative financial products and services. The growing demand for wealth management services, insurance products, and personalized financial advice offers significant potential.
Growth Accelerators in the Banking Industry in China Industry
Technological innovation, strategic partnerships with fintech companies, and expansion into underserved markets are crucial growth drivers. Government support for digitalization and financial inclusion creates a favorable environment. Efficient risk management practices and robust regulatory compliance are also essential for sustainable growth.
Key Players Shaping the Banking Industry in China Market
- Industrial and Commercial Bank of China (ICBC)
- China Construction Bank (CCB)
- Shanghai Pudong Development Bank
- CITIC Bank
- Agricultural Bank of China (ABC)
- China Everbright Bank
- Bank of China (BOC)
- Ping An Bank
- Bank of Communications
- China Merchants Bank
Notable Milestones in Banking Industry in China Sector
- 2020: Launch of the Digital RMB pilot program.
- 2021: Increased regulatory scrutiny on fintech lending practices.
- 2022: Significant investments in cybersecurity infrastructure across major banks.
- 2023: Growing adoption of open banking APIs.
- 2024: Implementation of stricter regulations related to data privacy.
In-Depth Banking Industry in China Market Outlook
The Chinese banking industry is poised for continued growth, albeit with a moderated pace compared to previous years. Strategic partnerships with fintech companies will drive innovation. Expansion into underserved markets and focus on personalized financial services will be key to success. The long-term outlook remains positive, with significant opportunities for growth and market leadership. The market is expected to reach xx Million units by 2033.
Banking Industry in China Segmentation
-
1. Product
- 1.1. Transactional Accounts
- 1.2. Savings Accounts
- 1.3. Debit Cards
- 1.4. Credit Cards
- 1.5. Loans
- 1.6. Other Products
-
2. Industry
- 2.1. Hardware
- 2.2. Software
- 2.3. Services
-
3. Channel
- 3.1. Direct Sales
- 3.2. Distributor
Banking Industry in China Segmentation By Geography
-
1. North America
- 1.1. United States
- 1.2. Canada
- 1.3. Mexico
-
2. South America
- 2.1. Brazil
- 2.2. Argentina
- 2.3. Rest of South America
-
3. Europe
- 3.1. United Kingdom
- 3.2. Germany
- 3.3. France
- 3.4. Italy
- 3.5. Spain
- 3.6. Russia
- 3.7. Benelux
- 3.8. Nordics
- 3.9. Rest of Europe
-
4. Middle East & Africa
- 4.1. Turkey
- 4.2. Israel
- 4.3. GCC
- 4.4. North Africa
- 4.5. South Africa
- 4.6. Rest of Middle East & Africa
-
5. Asia Pacific
- 5.1. China
- 5.2. India
- 5.3. Japan
- 5.4. South Korea
- 5.5. ASEAN
- 5.6. Oceania
- 5.7. Rest of Asia Pacific
Banking Industry in China Regional Market Share
Geographic Coverage of Banking Industry in China
Banking Industry in China REPORT HIGHLIGHTS
| Aspects | Details |
|---|---|
| Study Period | 2020-2034 |
| Base Year | 2025 |
| Estimated Year | 2026 |
| Forecast Period | 2026-2034 |
| Historical Period | 2020-2025 |
| Growth Rate | CAGR of 10.00% from 2020-2034 |
| Segmentation |
|
Table of Contents
- 1. Introduction
- 1.1. Research Scope
- 1.2. Market Segmentation
- 1.3. Research Objective
- 1.4. Definitions and Assumptions
- 2. Executive Summary
- 2.1. Market Snapshot
- 3. Market Dynamics
- 3.1. Market Drivers
- 3.2. Market Restrains
- 3.3. Market Trends
- 3.4. Market Opportunities
- 4. Market Factor Analysis
- 4.1. Porters Five Forces
- 4.1.1. Bargaining Power of Suppliers
- 4.1.2. Bargaining Power of Buyers
- 4.1.3. Threat of New Entrants
- 4.1.4. Threat of Substitutes
- 4.1.5. Competitive Rivalry
- 4.2. PESTEL analysis
- 4.3. BCG Analysis
- 4.3.1. Stars (High Growth, High Market Share)
- 4.3.2. Cash Cows (Low Growth, High Market Share)
- 4.3.3. Question Mark (High Growth, Low Market Share)
- 4.3.4. Dogs (Low Growth, Low Market Share)
- 4.4. Ansoff Matrix Analysis
- 4.5. Supply Chain Analysis
- 4.6. Regulatory Landscape
- 4.7. Current Market Potential and Opportunity Assessment (TAM–SAM–SOM Framework)
- 4.8. VDR Analyst Note
- 4.1. Porters Five Forces
- 5. Market Analysis, Insights and Forecast 2021-2033
- 5.1. Market Analysis, Insights and Forecast - by Product
- 5.1.1. Transactional Accounts
- 5.1.2. Savings Accounts
- 5.1.3. Debit Cards
- 5.1.4. Credit Cards
- 5.1.5. Loans
- 5.1.6. Other Products
- 5.2. Market Analysis, Insights and Forecast - by Industry
- 5.2.1. Hardware
- 5.2.2. Software
- 5.2.3. Services
- 5.3. Market Analysis, Insights and Forecast - by Channel
- 5.3.1. Direct Sales
- 5.3.2. Distributor
- 5.4. Market Analysis, Insights and Forecast - by Region
- 5.4.1. North America
- 5.4.2. South America
- 5.4.3. Europe
- 5.4.4. Middle East & Africa
- 5.4.5. Asia Pacific
- 5.1. Market Analysis, Insights and Forecast - by Product
- 6. Global Banking Industry in China Analysis, Insights and Forecast, 2021-2033
- 6.1. Market Analysis, Insights and Forecast - by Product
- 6.1.1. Transactional Accounts
- 6.1.2. Savings Accounts
- 6.1.3. Debit Cards
- 6.1.4. Credit Cards
- 6.1.5. Loans
- 6.1.6. Other Products
- 6.2. Market Analysis, Insights and Forecast - by Industry
- 6.2.1. Hardware
- 6.2.2. Software
- 6.2.3. Services
- 6.3. Market Analysis, Insights and Forecast - by Channel
- 6.3.1. Direct Sales
- 6.3.2. Distributor
- 6.1. Market Analysis, Insights and Forecast - by Product
- 7. North America Banking Industry in China Analysis, Insights and Forecast, 2021-2033
- 7.1. Market Analysis, Insights and Forecast - by Product
- 7.1.1. Transactional Accounts
- 7.1.2. Savings Accounts
- 7.1.3. Debit Cards
- 7.1.4. Credit Cards
- 7.1.5. Loans
- 7.1.6. Other Products
- 7.2. Market Analysis, Insights and Forecast - by Industry
- 7.2.1. Hardware
- 7.2.2. Software
- 7.2.3. Services
- 7.3. Market Analysis, Insights and Forecast - by Channel
- 7.3.1. Direct Sales
- 7.3.2. Distributor
- 7.1. Market Analysis, Insights and Forecast - by Product
- 8. South America Banking Industry in China Analysis, Insights and Forecast, 2021-2033
- 8.1. Market Analysis, Insights and Forecast - by Product
- 8.1.1. Transactional Accounts
- 8.1.2. Savings Accounts
- 8.1.3. Debit Cards
- 8.1.4. Credit Cards
- 8.1.5. Loans
- 8.1.6. Other Products
- 8.2. Market Analysis, Insights and Forecast - by Industry
- 8.2.1. Hardware
- 8.2.2. Software
- 8.2.3. Services
- 8.3. Market Analysis, Insights and Forecast - by Channel
- 8.3.1. Direct Sales
- 8.3.2. Distributor
- 8.1. Market Analysis, Insights and Forecast - by Product
- 9. Europe Banking Industry in China Analysis, Insights and Forecast, 2021-2033
- 9.1. Market Analysis, Insights and Forecast - by Product
- 9.1.1. Transactional Accounts
- 9.1.2. Savings Accounts
- 9.1.3. Debit Cards
- 9.1.4. Credit Cards
- 9.1.5. Loans
- 9.1.6. Other Products
- 9.2. Market Analysis, Insights and Forecast - by Industry
- 9.2.1. Hardware
- 9.2.2. Software
- 9.2.3. Services
- 9.3. Market Analysis, Insights and Forecast - by Channel
- 9.3.1. Direct Sales
- 9.3.2. Distributor
- 9.1. Market Analysis, Insights and Forecast - by Product
- 10. Middle East & Africa Banking Industry in China Analysis, Insights and Forecast, 2021-2033
- 10.1. Market Analysis, Insights and Forecast - by Product
- 10.1.1. Transactional Accounts
- 10.1.2. Savings Accounts
- 10.1.3. Debit Cards
- 10.1.4. Credit Cards
- 10.1.5. Loans
- 10.1.6. Other Products
- 10.2. Market Analysis, Insights and Forecast - by Industry
- 10.2.1. Hardware
- 10.2.2. Software
- 10.2.3. Services
- 10.3. Market Analysis, Insights and Forecast - by Channel
- 10.3.1. Direct Sales
- 10.3.2. Distributor
- 10.1. Market Analysis, Insights and Forecast - by Product
- 11. Asia Pacific Banking Industry in China Analysis, Insights and Forecast, 2021-2033
- 11.1. Market Analysis, Insights and Forecast - by Product
- 11.1.1. Transactional Accounts
- 11.1.2. Savings Accounts
- 11.1.3. Debit Cards
- 11.1.4. Credit Cards
- 11.1.5. Loans
- 11.1.6. Other Products
- 11.2. Market Analysis, Insights and Forecast - by Industry
- 11.2.1. Hardware
- 11.2.2. Software
- 11.2.3. Services
- 11.3. Market Analysis, Insights and Forecast - by Channel
- 11.3.1. Direct Sales
- 11.3.2. Distributor
- 11.1. Market Analysis, Insights and Forecast - by Product
- 12. Competitive Analysis
- 12.1. Company Profiles
- 12.1.1 Industrial and Commercial Bank of China (ICBC)
- 12.1.1.1. Company Overview
- 12.1.1.2. Products
- 12.1.1.3. Company Financials
- 12.1.1.4. SWOT Analysis
- 12.1.2 China Construction Bank (CCB)
- 12.1.2.1. Company Overview
- 12.1.2.2. Products
- 12.1.2.3. Company Financials
- 12.1.2.4. SWOT Analysis
- 12.1.3 Shanghai Pudong Development Bank
- 12.1.3.1. Company Overview
- 12.1.3.2. Products
- 12.1.3.3. Company Financials
- 12.1.3.4. SWOT Analysis
- 12.1.4 CITIC Bank
- 12.1.4.1. Company Overview
- 12.1.4.2. Products
- 12.1.4.3. Company Financials
- 12.1.4.4. SWOT Analysis
- 12.1.5 Agricultural Bank of China (ABC)
- 12.1.5.1. Company Overview
- 12.1.5.2. Products
- 12.1.5.3. Company Financials
- 12.1.5.4. SWOT Analysis
- 12.1.6 China Everbright Bank
- 12.1.6.1. Company Overview
- 12.1.6.2. Products
- 12.1.6.3. Company Financials
- 12.1.6.4. SWOT Analysis
- 12.1.7 Bank of China (BOC)
- 12.1.7.1. Company Overview
- 12.1.7.2. Products
- 12.1.7.3. Company Financials
- 12.1.7.4. SWOT Analysis
- 12.1.8 Ping An Bank
- 12.1.8.1. Company Overview
- 12.1.8.2. Products
- 12.1.8.3. Company Financials
- 12.1.8.4. SWOT Analysis
- 12.1.9 Bank of Communications
- 12.1.9.1. Company Overview
- 12.1.9.2. Products
- 12.1.9.3. Company Financials
- 12.1.9.4. SWOT Analysis
- 12.1.10 China Merchants Bank
- 12.1.10.1. Company Overview
- 12.1.10.2. Products
- 12.1.10.3. Company Financials
- 12.1.10.4. SWOT Analysis
- 12.1.1 Industrial and Commercial Bank of China (ICBC)
- 12.2. Market Entropy
- 12.2.1 Company's Key Areas Served
- 12.2.2 Recent Developments
- 12.3. Company Market Share Analysis 2025
- 12.3.1 Top 5 Companies Market Share Analysis
- 12.3.2 Top 3 Companies Market Share Analysis
- 12.4. List of Potential Customers
- 13. Research Methodology
List of Figures
- Figure 1: Global Banking Industry in China Revenue Breakdown (Million, %) by Region 2025 & 2033
- Figure 2: North America Banking Industry in China Revenue (Million), by Product 2025 & 2033
- Figure 3: North America Banking Industry in China Revenue Share (%), by Product 2025 & 2033
- Figure 4: North America Banking Industry in China Revenue (Million), by Industry 2025 & 2033
- Figure 5: North America Banking Industry in China Revenue Share (%), by Industry 2025 & 2033
- Figure 6: North America Banking Industry in China Revenue (Million), by Channel 2025 & 2033
- Figure 7: North America Banking Industry in China Revenue Share (%), by Channel 2025 & 2033
- Figure 8: North America Banking Industry in China Revenue (Million), by Country 2025 & 2033
- Figure 9: North America Banking Industry in China Revenue Share (%), by Country 2025 & 2033
- Figure 10: South America Banking Industry in China Revenue (Million), by Product 2025 & 2033
- Figure 11: South America Banking Industry in China Revenue Share (%), by Product 2025 & 2033
- Figure 12: South America Banking Industry in China Revenue (Million), by Industry 2025 & 2033
- Figure 13: South America Banking Industry in China Revenue Share (%), by Industry 2025 & 2033
- Figure 14: South America Banking Industry in China Revenue (Million), by Channel 2025 & 2033
- Figure 15: South America Banking Industry in China Revenue Share (%), by Channel 2025 & 2033
- Figure 16: South America Banking Industry in China Revenue (Million), by Country 2025 & 2033
- Figure 17: South America Banking Industry in China Revenue Share (%), by Country 2025 & 2033
- Figure 18: Europe Banking Industry in China Revenue (Million), by Product 2025 & 2033
- Figure 19: Europe Banking Industry in China Revenue Share (%), by Product 2025 & 2033
- Figure 20: Europe Banking Industry in China Revenue (Million), by Industry 2025 & 2033
- Figure 21: Europe Banking Industry in China Revenue Share (%), by Industry 2025 & 2033
- Figure 22: Europe Banking Industry in China Revenue (Million), by Channel 2025 & 2033
- Figure 23: Europe Banking Industry in China Revenue Share (%), by Channel 2025 & 2033
- Figure 24: Europe Banking Industry in China Revenue (Million), by Country 2025 & 2033
- Figure 25: Europe Banking Industry in China Revenue Share (%), by Country 2025 & 2033
- Figure 26: Middle East & Africa Banking Industry in China Revenue (Million), by Product 2025 & 2033
- Figure 27: Middle East & Africa Banking Industry in China Revenue Share (%), by Product 2025 & 2033
- Figure 28: Middle East & Africa Banking Industry in China Revenue (Million), by Industry 2025 & 2033
- Figure 29: Middle East & Africa Banking Industry in China Revenue Share (%), by Industry 2025 & 2033
- Figure 30: Middle East & Africa Banking Industry in China Revenue (Million), by Channel 2025 & 2033
- Figure 31: Middle East & Africa Banking Industry in China Revenue Share (%), by Channel 2025 & 2033
- Figure 32: Middle East & Africa Banking Industry in China Revenue (Million), by Country 2025 & 2033
- Figure 33: Middle East & Africa Banking Industry in China Revenue Share (%), by Country 2025 & 2033
- Figure 34: Asia Pacific Banking Industry in China Revenue (Million), by Product 2025 & 2033
- Figure 35: Asia Pacific Banking Industry in China Revenue Share (%), by Product 2025 & 2033
- Figure 36: Asia Pacific Banking Industry in China Revenue (Million), by Industry 2025 & 2033
- Figure 37: Asia Pacific Banking Industry in China Revenue Share (%), by Industry 2025 & 2033
- Figure 38: Asia Pacific Banking Industry in China Revenue (Million), by Channel 2025 & 2033
- Figure 39: Asia Pacific Banking Industry in China Revenue Share (%), by Channel 2025 & 2033
- Figure 40: Asia Pacific Banking Industry in China Revenue (Million), by Country 2025 & 2033
- Figure 41: Asia Pacific Banking Industry in China Revenue Share (%), by Country 2025 & 2033
List of Tables
- Table 1: Global Banking Industry in China Revenue Million Forecast, by Product 2020 & 2033
- Table 2: Global Banking Industry in China Revenue Million Forecast, by Industry 2020 & 2033
- Table 3: Global Banking Industry in China Revenue Million Forecast, by Channel 2020 & 2033
- Table 4: Global Banking Industry in China Revenue Million Forecast, by Region 2020 & 2033
- Table 5: Global Banking Industry in China Revenue Million Forecast, by Product 2020 & 2033
- Table 6: Global Banking Industry in China Revenue Million Forecast, by Industry 2020 & 2033
- Table 7: Global Banking Industry in China Revenue Million Forecast, by Channel 2020 & 2033
- Table 8: Global Banking Industry in China Revenue Million Forecast, by Country 2020 & 2033
- Table 9: United States Banking Industry in China Revenue (Million) Forecast, by Application 2020 & 2033
- Table 10: Canada Banking Industry in China Revenue (Million) Forecast, by Application 2020 & 2033
- Table 11: Mexico Banking Industry in China Revenue (Million) Forecast, by Application 2020 & 2033
- Table 12: Global Banking Industry in China Revenue Million Forecast, by Product 2020 & 2033
- Table 13: Global Banking Industry in China Revenue Million Forecast, by Industry 2020 & 2033
- Table 14: Global Banking Industry in China Revenue Million Forecast, by Channel 2020 & 2033
- Table 15: Global Banking Industry in China Revenue Million Forecast, by Country 2020 & 2033
- Table 16: Brazil Banking Industry in China Revenue (Million) Forecast, by Application 2020 & 2033
- Table 17: Argentina Banking Industry in China Revenue (Million) Forecast, by Application 2020 & 2033
- Table 18: Rest of South America Banking Industry in China Revenue (Million) Forecast, by Application 2020 & 2033
- Table 19: Global Banking Industry in China Revenue Million Forecast, by Product 2020 & 2033
- Table 20: Global Banking Industry in China Revenue Million Forecast, by Industry 2020 & 2033
- Table 21: Global Banking Industry in China Revenue Million Forecast, by Channel 2020 & 2033
- Table 22: Global Banking Industry in China Revenue Million Forecast, by Country 2020 & 2033
- Table 23: United Kingdom Banking Industry in China Revenue (Million) Forecast, by Application 2020 & 2033
- Table 24: Germany Banking Industry in China Revenue (Million) Forecast, by Application 2020 & 2033
- Table 25: France Banking Industry in China Revenue (Million) Forecast, by Application 2020 & 2033
- Table 26: Italy Banking Industry in China Revenue (Million) Forecast, by Application 2020 & 2033
- Table 27: Spain Banking Industry in China Revenue (Million) Forecast, by Application 2020 & 2033
- Table 28: Russia Banking Industry in China Revenue (Million) Forecast, by Application 2020 & 2033
- Table 29: Benelux Banking Industry in China Revenue (Million) Forecast, by Application 2020 & 2033
- Table 30: Nordics Banking Industry in China Revenue (Million) Forecast, by Application 2020 & 2033
- Table 31: Rest of Europe Banking Industry in China Revenue (Million) Forecast, by Application 2020 & 2033
- Table 32: Global Banking Industry in China Revenue Million Forecast, by Product 2020 & 2033
- Table 33: Global Banking Industry in China Revenue Million Forecast, by Industry 2020 & 2033
- Table 34: Global Banking Industry in China Revenue Million Forecast, by Channel 2020 & 2033
- Table 35: Global Banking Industry in China Revenue Million Forecast, by Country 2020 & 2033
- Table 36: Turkey Banking Industry in China Revenue (Million) Forecast, by Application 2020 & 2033
- Table 37: Israel Banking Industry in China Revenue (Million) Forecast, by Application 2020 & 2033
- Table 38: GCC Banking Industry in China Revenue (Million) Forecast, by Application 2020 & 2033
- Table 39: North Africa Banking Industry in China Revenue (Million) Forecast, by Application 2020 & 2033
- Table 40: South Africa Banking Industry in China Revenue (Million) Forecast, by Application 2020 & 2033
- Table 41: Rest of Middle East & Africa Banking Industry in China Revenue (Million) Forecast, by Application 2020 & 2033
- Table 42: Global Banking Industry in China Revenue Million Forecast, by Product 2020 & 2033
- Table 43: Global Banking Industry in China Revenue Million Forecast, by Industry 2020 & 2033
- Table 44: Global Banking Industry in China Revenue Million Forecast, by Channel 2020 & 2033
- Table 45: Global Banking Industry in China Revenue Million Forecast, by Country 2020 & 2033
- Table 46: China Banking Industry in China Revenue (Million) Forecast, by Application 2020 & 2033
- Table 47: India Banking Industry in China Revenue (Million) Forecast, by Application 2020 & 2033
- Table 48: Japan Banking Industry in China Revenue (Million) Forecast, by Application 2020 & 2033
- Table 49: South Korea Banking Industry in China Revenue (Million) Forecast, by Application 2020 & 2033
- Table 50: ASEAN Banking Industry in China Revenue (Million) Forecast, by Application 2020 & 2033
- Table 51: Oceania Banking Industry in China Revenue (Million) Forecast, by Application 2020 & 2033
- Table 52: Rest of Asia Pacific Banking Industry in China Revenue (Million) Forecast, by Application 2020 & 2033
Frequently Asked Questions
1. What is the projected Compound Annual Growth Rate (CAGR) of the Banking Industry in China?
The projected CAGR is approximately 10.00%.
2. Which companies are prominent players in the Banking Industry in China?
Key companies in the market include Industrial and Commercial Bank of China (ICBC) , China Construction Bank (CCB) , Shanghai Pudong Development Bank , CITIC Bank, Agricultural Bank of China (ABC) , China Everbright Bank , Bank of China (BOC) , Ping An Bank , Bank of Communications , China Merchants Bank .
3. What are the main segments of the Banking Industry in China?
The market segments include Product, Industry, Channel.
4. Can you provide details about the market size?
The market size is estimated to be USD XX Million as of 2022.
5. What are some drivers contributing to market growth?
Guaranteed Protection Drives The Market.
6. What are the notable trends driving market growth?
Technology and Digitalization Trends are Driving the Market.
7. Are there any restraints impacting market growth?
Long and Costly Legal Procedures.
8. Can you provide examples of recent developments in the market?
N/A
9. What pricing options are available for accessing the report?
Pricing options include single-user, multi-user, and enterprise licenses priced at USD 3800, USD 4500, and USD 5800 respectively.
10. Is the market size provided in terms of value or volume?
The market size is provided in terms of value, measured in Million.
11. Are there any specific market keywords associated with the report?
Yes, the market keyword associated with the report is "Banking Industry in China," which aids in identifying and referencing the specific market segment covered.
12. How do I determine which pricing option suits my needs best?
The pricing options vary based on user requirements and access needs. Individual users may opt for single-user licenses, while businesses requiring broader access may choose multi-user or enterprise licenses for cost-effective access to the report.
13. Are there any additional resources or data provided in the Banking Industry in China report?
While the report offers comprehensive insights, it's advisable to review the specific contents or supplementary materials provided to ascertain if additional resources or data are available.
14. How can I stay updated on further developments or reports in the Banking Industry in China?
To stay informed about further developments, trends, and reports in the Banking Industry in China, consider subscribing to industry newsletters, following relevant companies and organizations, or regularly checking reputable industry news sources and publications.
Methodology
Step 1 - Identification of Relevant Samples Size from Population Database


Step 2 - Approaches for Defining Global Market Size (Value, Volume* & Price*)

Note*: In applicable scenarios
Step 3 - Data Sources
Primary Research
- Web Analytics
- Survey Reports
- Research Institute
- Latest Research Reports
- Opinion Leaders
Secondary Research
- Annual Reports
- White Paper
- Latest Press Release
- Industry Association
- Paid Database
- Investor Presentations

Step 4 - Data Triangulation
Involves using different sources of information in order to increase the validity of a study
These sources are likely to be stakeholders in a program - participants, other researchers, program staff, other community members, and so on.
Then we put all data in single framework & apply various statistical tools to find out the dynamic on the market.
During the analysis stage, feedback from the stakeholder groups would be compared to determine areas of agreement as well as areas of divergence