

Key Insights
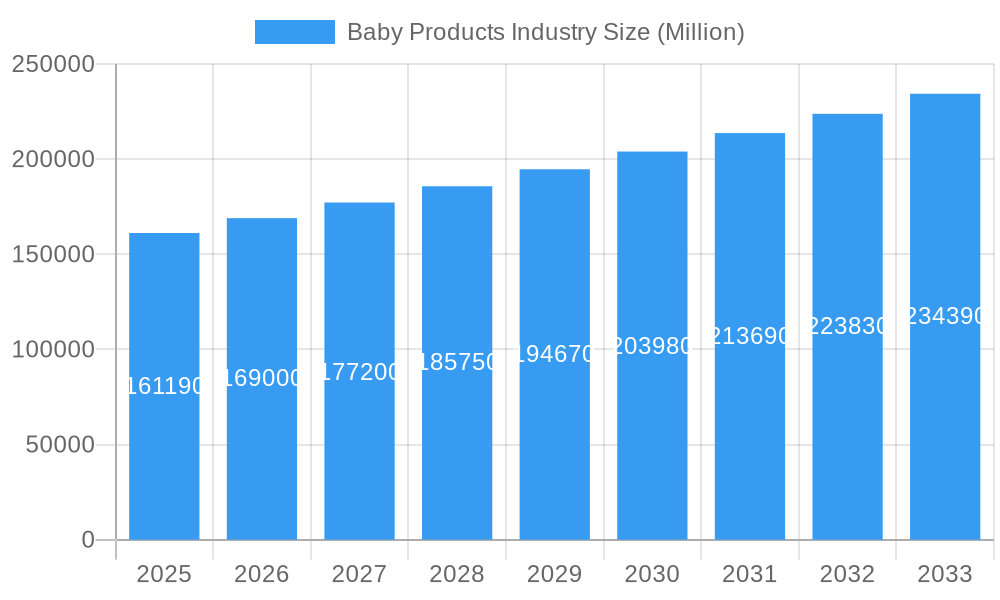
The global baby products market, valued at $161.19 billion in 2025, is projected to experience robust growth, driven by several key factors. Rising disposable incomes in developing economies, coupled with increasing awareness of hygiene and childcare practices, are significantly boosting demand for a wider range of baby products. The preference for premium and specialized products, like organic and hypoallergenic options, is also fueling market expansion. Furthermore, the growing popularity of online retail channels provides convenient access to a vast selection of baby products, contributing to market growth. The market is segmented by distribution channel (supermarkets/hypermarkets, convenience stores, pharmacies, online retail, others) and product type (skincare, haircare, toiletries, diapers & wipes, food & beverages). Online retail is experiencing particularly rapid growth, leveraging e-commerce platforms' convenience and reach. The competitive landscape includes major multinational corporations like Procter & Gamble, Johnson & Johnson, and Nestlé, alongside regional players catering to specific market needs. These companies invest heavily in research and development to innovate products, enhancing their market position. While challenges exist, such as fluctuating raw material prices and stringent regulatory requirements, the long-term outlook remains positive, driven by sustained population growth and increasing parental spending on child well-being.
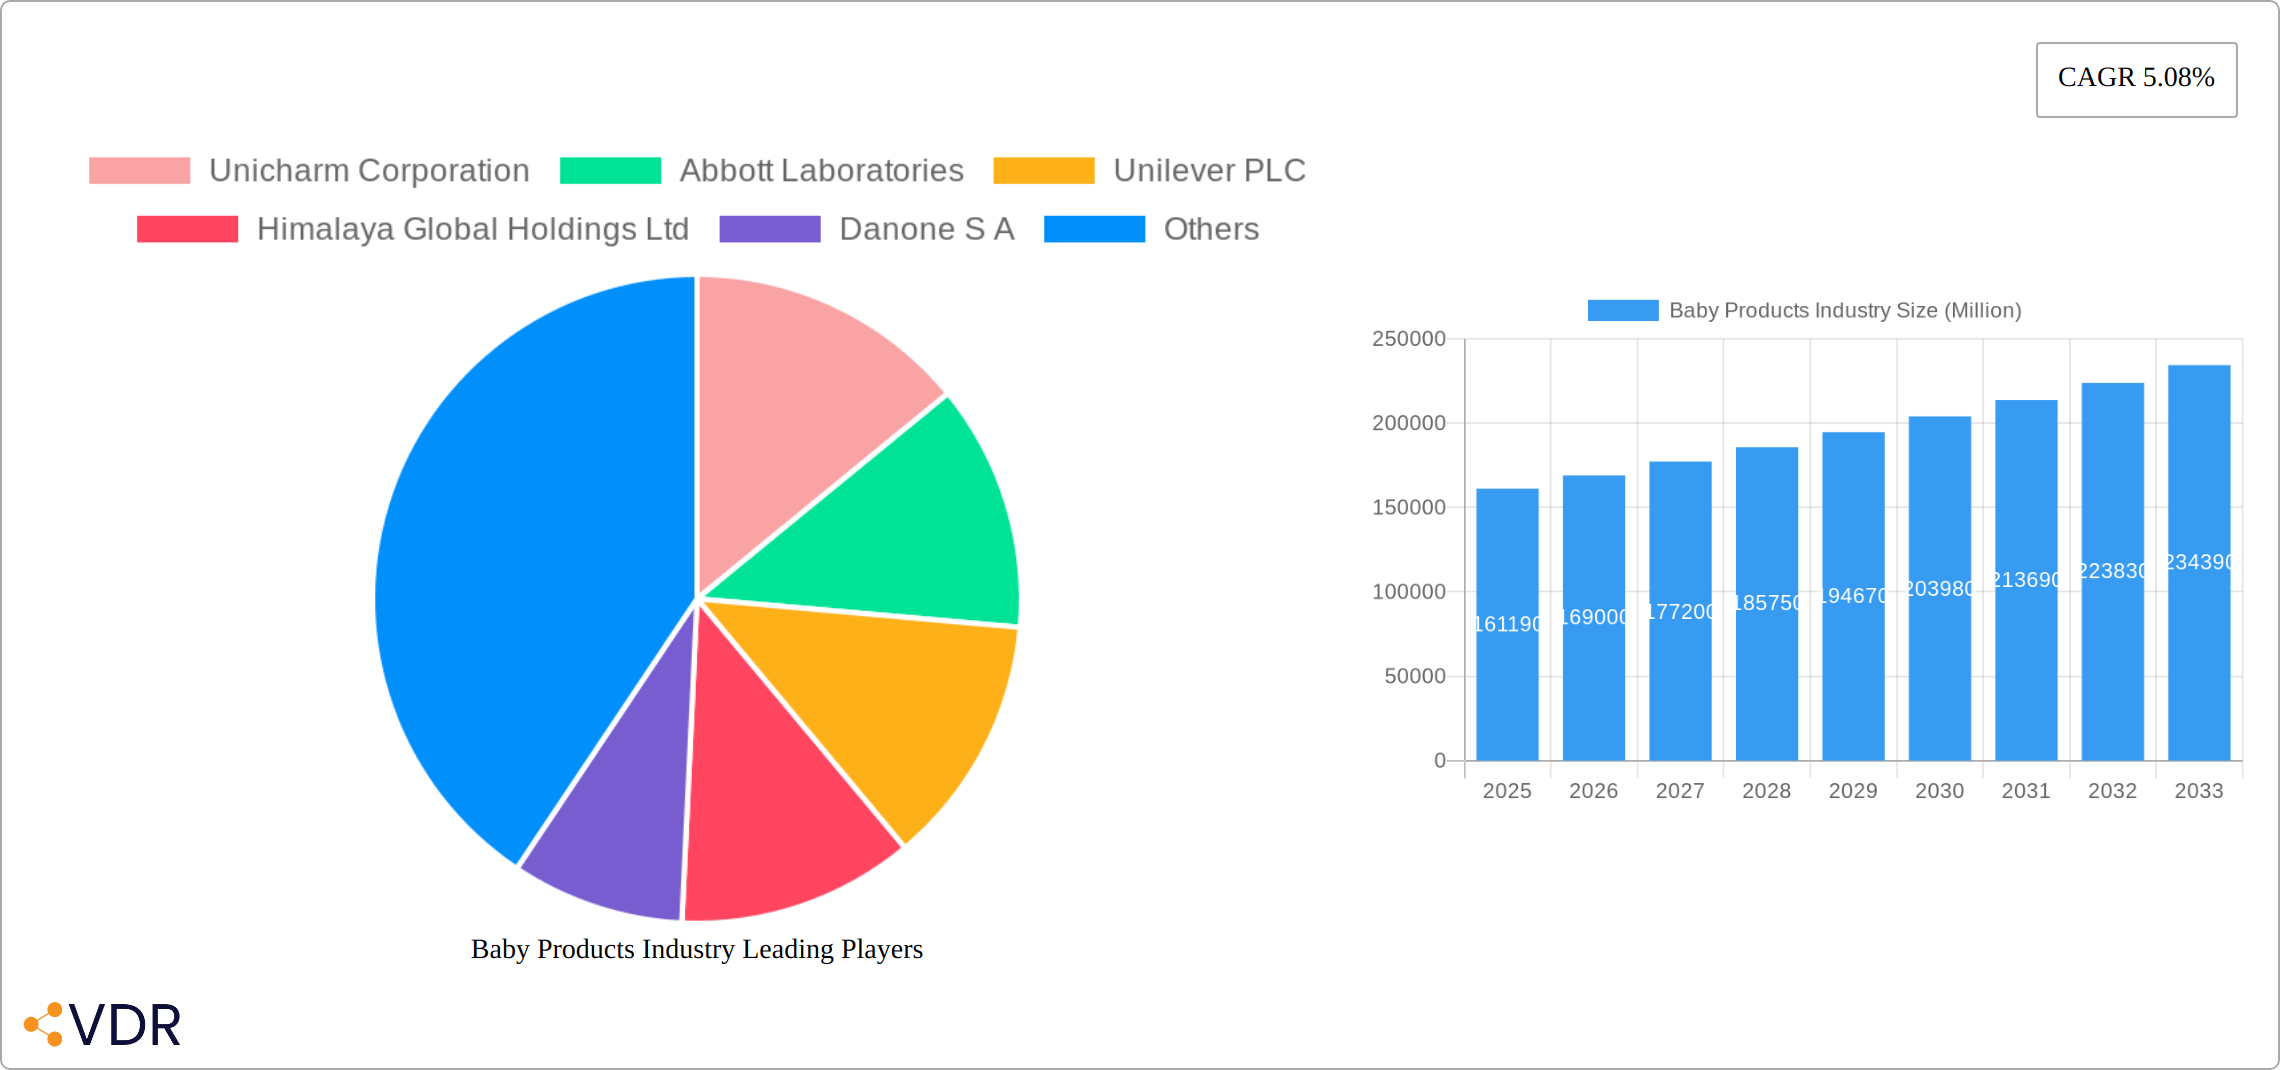
Baby Products Industry Market Size (In Billion)
The market's geographic distribution shows significant regional variations. North America and Europe currently hold substantial market shares, reflecting high levels of disposable income and established retail infrastructure. However, the Asia-Pacific region is anticipated to witness the most rapid growth due to its large and expanding population base and increasing urbanization. This region's market share is poised for substantial expansion, driven by rising middle-class incomes and changing consumer preferences. South America and the Middle East & Africa also offer significant, albeit less developed, growth potential. Future growth will likely be influenced by factors such as evolving consumer preferences, technological advancements in product design and manufacturing, and the ongoing impact of economic fluctuations across different regions. Strategic partnerships, acquisitions, and innovative product launches will continue to shape the competitive landscape.
Baby Products Industry Company Market Share
Baby Products Industry Market Report: 2019-2033
This comprehensive report provides a detailed analysis of the global baby products industry, encompassing market dynamics, growth trends, key players, and future outlook. Covering the period from 2019 to 2033, with a focus on 2025, this report is an invaluable resource for industry professionals, investors, and anyone seeking to understand this dynamic market. The report leverages extensive data analysis and insights to cater to both the parent market (purchasing decisions) and the child market (product usage & preference). The analysis covers a market valued at xx Million units in 2025, projected to reach xx Million units by 2033.
Baby Products Industry Market Dynamics & Structure
This section analyzes the competitive landscape of the baby products market, encompassing market concentration, technological advancements, regulatory impacts, and strategic mergers and acquisitions (M&A). The study period (2019-2024) reveals a moderately concentrated market, with key players like Procter & Gamble, Johnson & Johnson, and Unilever holding significant market share, while smaller niche players focus on specialized products.
- Market Concentration: The market exhibits a moderate level of concentration, with the top 5 players holding an estimated xx% market share in 2025.
- Technological Innovation: Technological advancements, particularly in materials science (e.g., improved diaper absorbency) and digital marketing (e.g., personalized recommendations), are significant growth drivers. Barriers include high R&D costs and stringent regulatory requirements.
- Regulatory Frameworks: Stringent safety and labeling regulations vary across regions, influencing product development and distribution strategies. Compliance costs represent a significant challenge for smaller players.
- Competitive Product Substitutes: Limited direct substitutes exist for essential baby products like diapers and formula. However, the market experiences competition from private label brands and store brands.
- End-User Demographics: Growing millennial and Gen Z parenthood, coupled with rising disposable incomes in emerging economies, are major catalysts for market expansion. Shifting parental preferences and increased awareness of sustainability are also key considerations.
- M&A Trends: The industry witnessed xx M&A deals during the historical period (2019-2024), predominantly focused on expanding product portfolios and geographic reach. The estimated value of these deals totaled xx Million units.
Baby Products Industry Growth Trends & Insights
The baby products market exhibits a robust and dynamic growth trajectory, shaped by a confluence of factors impacting market size, product adoption, technological innovation, and evolving consumer preferences. Analysis reveals a consistent growth trend, with a Compound Annual Growth Rate (CAGR) of xx% observed during the historical period (2019-2024), and a projected CAGR of xx% anticipated for the forecast period (2025-2033). This expansion is fueled by several key factors: the rise in disposable incomes, particularly within developing nations; increasing adoption of premium and specialized baby products reflecting a greater emphasis on child well-being; a growing preference for organic and eco-friendly options reflecting heightened environmental consciousness; the expanding reach of online retail channels offering unparalleled convenience and accessibility; and the impactful influence of digital marketing strategies in shaping consumer choices. Furthermore, continuous technological advancements, such as sophisticated diaper designs and smart baby monitors, are driving significant product innovation and market expansion.
Dominant Regions, Countries, or Segments in Baby Products Industry
The baby products market demonstrates geographic and segmental variations in growth dynamics. While North America and Western Europe currently maintain leading positions due to high per capita spending on baby products, the Asia-Pacific region is experiencing exceptionally rapid growth, driven by burgeoning birth rates and increasing disposable incomes. This diverse landscape is further segmented by distribution channels and product types:
- Distribution Channels: Online retail channels are experiencing exponential growth, surpassing traditional channels in terms of expansion rate, due to their convenience and accessibility. Supermarkets/Hypermarkets, however, still maintain a dominant market share. Direct-to-consumer (DTC) channels are also emerging as significant contributors, offering specialized products and personalized experiences.
- Product Type: Baby diapers and wipes remain the largest product segment, followed by baby food and beverages. The baby skincare segment exhibits particularly strong growth, fueled by rising parental awareness regarding the importance of gentle, effective skincare for sensitive infant skin.
- Key Drivers:
- Robust economic growth and rising disposable incomes: This trend is especially pronounced in developing economies, leading to increased spending power for baby products.
- Fluctuating birth rates: While birth rates are increasing in some regions, others are experiencing declines. This demographic shift has a notable impact on market demand.
- Government support and initiatives: Policies promoting maternal and child health significantly influence market growth, particularly in countries with supportive governmental programs.
- Improved infrastructure: Enhanced retail networks and efficient logistics facilitate better product distribution and market penetration.
Baby Products Industry Product Landscape
The baby products market showcases continuous innovation in product design and functionality. Recent product launches highlight advancements in diaper absorbency, improved rash protection, and the incorporation of natural and organic ingredients. Unique selling propositions often center around enhanced comfort, superior performance, and eco-friendly attributes. The emphasis on hypoallergenic formulations and sustainable packaging reflects growing consumer demand. Technological progress focuses on optimizing material composition, enhancing product safety, and improving user experience.
Key Drivers, Barriers & Challenges in Baby Products Industry
The baby products industry faces a complex interplay of driving forces and restraining factors.
Key Drivers:
- Increasing birth rates in many developing economies, expanding the potential customer base.
- Rising disposable incomes globally, leading to greater spending on premium baby products.
- Continuous technological advancements leading to innovative and improved products.
- Growing parental awareness of the significance of baby health and hygiene, driving demand for high-quality products.
Challenges and Restraints:
- Stringent regulatory compliance requirements, increasing production costs and complexity.
- Volatility in raw material prices, creating uncertainty in product pricing and profitability.
- Intense competition among established brands and emerging players, necessitating continuous innovation and marketing efforts.
- Supply chain disruptions resulting from geopolitical instability and global events. These disruptions contributed to a xx% increase in production costs in 2024, highlighting the vulnerability of the supply chain.
Emerging Opportunities in Baby Products Industry
- Expansion into untapped markets in developing countries, presenting significant growth potential.
- The rising demand for organic, sustainable, and eco-friendly products aligns with growing consumer values.
- Developing personalized and customized products catering to specific infant needs offers a unique competitive advantage.
- Leveraging technology to enhance product safety, efficacy, and convenience, creating smarter and more user-friendly products.
Growth Accelerators in the Baby Products Industry
Sustained growth in the baby products industry hinges on several key factors. Technological advancements, strategic partnerships, and expansion into new markets are pivotal catalysts for long-term success. Innovation in areas such as smart baby products and personalized nutrition solutions will continue to drive market expansion. Strategic collaborations between manufacturers, retailers, and healthcare providers are crucial for enhancing market penetration and reach. Finally, proactively identifying and developing underserved markets and emerging economies presents significant opportunities for sustained growth and market leadership.
Key Players Shaping the Baby Products Industry Market
Notable Milestones in Baby Products Industry Sector
- January 2024: Pampers launched a new Pampers Premium Care Diaper with 360-degree coverage and enhanced rash protection. This launch significantly impacted the premium diaper segment, driving competition and innovation.
- January 2024: Procter & Gamble Korea launched Pampers Baby-Dry Pants, emphasizing improved absorbency. This contributed to increased competition in the baby diaper market and highlighted the ongoing focus on absorbency technology.
- February 2024: MamyPoko Pants launched Extra Absorb Pants featuring 30+ patented technologies and up to 60% higher absorbency. This signifies technological advancements and increased competitive pressure in the diaper market.
In-Depth Baby Products Industry Market Outlook
The baby products industry is poised for continued growth, driven by technological advancements, increasing consumer demand for premium and specialized products, and expansion into new markets. Strategic partnerships and innovations in areas like sustainable materials and smart baby products will further shape the market's trajectory. Opportunities exist for companies to leverage digital marketing, personalized product offerings, and e-commerce channels to enhance market penetration and customer engagement. The long-term outlook remains positive, with significant growth potential across various segments and geographies.
Baby Products Industry Segmentation
-
1. Product Type
- 1.1. Baby Skin Care
- 1.2. Baby Hair Care
-
1.3. Baby Toiletries
- 1.3.1. Baby Bath Products and Fragrances
- 1.3.2. Baby Diapers and Wipes
- 1.4. Baby Food and Beverages
-
2. Distribution Channel
- 2.1. Supermarkets/Hypermarkets
- 2.2. Convenience Stores
- 2.3. Pharmacies/Drug Stores
- 2.4. Online Retail Stores
- 2.5. Other Distribution Channels
Baby Products Industry Segmentation By Geography
-
1. North America
- 1.1. United States
- 1.2. Canada
- 1.3. Mexico
- 1.4. Rest of North America
-
2. Europe
- 2.1. United Kingdom
- 2.2. Germany
- 2.3. Spain
- 2.4. France
- 2.5. Italy
- 2.6. Russia
- 2.7. Rest of Europe
-
3. Asia Pacific
- 3.1. China
- 3.2. Japan
- 3.3. India
- 3.4. Australia
- 3.5. Rest of Asia Pacific
-
4. South America
- 4.1. Brazil
- 4.2. Argentina
- 4.3. Rest of South America
-
5. Middle East and Africa
- 5.1. South Africa
- 5.2. Saudi Arabia
- 5.3. Rest of Middle East and Africa
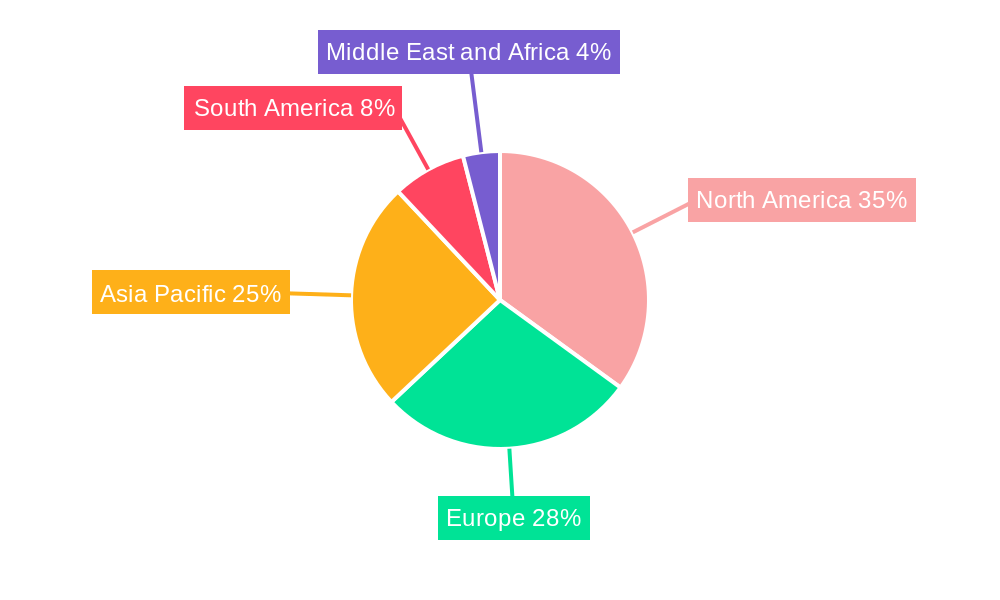
Baby Products Industry Regional Market Share
Geographic Coverage of Baby Products Industry
Baby Products Industry REPORT HIGHLIGHTS
| Aspects | Details |
|---|---|
| Study Period | 2020-2034 |
| Base Year | 2025 |
| Estimated Year | 2026 |
| Forecast Period | 2026-2034 |
| Historical Period | 2020-2025 |
| Growth Rate | CAGR of 5.08% from 2020-2034 |
| Segmentation |
|
Table of Contents
- 1. Introduction
- 1.1. Research Scope
- 1.2. Market Segmentation
- 1.3. Research Objective
- 1.4. Definitions and Assumptions
- 2. Executive Summary
- 2.1. Market Snapshot
- 3. Market Dynamics
- 3.1. Market Drivers
- 3.2. Market Restrains
- 3.3. Market Trends
- 3.4. Market Opportunities
- 4. Market Factor Analysis
- 4.1. Porters Five Forces
- 4.1.1. Bargaining Power of Suppliers
- 4.1.2. Bargaining Power of Buyers
- 4.1.3. Threat of New Entrants
- 4.1.4. Threat of Substitutes
- 4.1.5. Competitive Rivalry
- 4.2. PESTEL analysis
- 4.3. BCG Analysis
- 4.3.1. Stars (High Growth, High Market Share)
- 4.3.2. Cash Cows (Low Growth, High Market Share)
- 4.3.3. Question Mark (High Growth, Low Market Share)
- 4.3.4. Dogs (Low Growth, Low Market Share)
- 4.4. Ansoff Matrix Analysis
- 4.5. Supply Chain Analysis
- 4.6. Regulatory Landscape
- 4.7. Current Market Potential and Opportunity Assessment (TAM–SAM–SOM Framework)
- 4.8. VDR Analyst Note
- 4.1. Porters Five Forces
- 5. Market Analysis, Insights and Forecast 2021-2033
- 5.1. Market Analysis, Insights and Forecast - by Product Type
- 5.1.1. Baby Skin Care
- 5.1.2. Baby Hair Care
- 5.1.3. Baby Toiletries
- 5.1.3.1. Baby Bath Products and Fragrances
- 5.1.3.2. Baby Diapers and Wipes
- 5.1.4. Baby Food and Beverages
- 5.2. Market Analysis, Insights and Forecast - by Distribution Channel
- 5.2.1. Supermarkets/Hypermarkets
- 5.2.2. Convenience Stores
- 5.2.3. Pharmacies/Drug Stores
- 5.2.4. Online Retail Stores
- 5.2.5. Other Distribution Channels
- 5.3. Market Analysis, Insights and Forecast - by Region
- 5.3.1. North America
- 5.3.2. Europe
- 5.3.3. Asia Pacific
- 5.3.4. South America
- 5.3.5. Middle East and Africa
- 5.1. Market Analysis, Insights and Forecast - by Product Type
- 6. Global Baby Products Industry Analysis, Insights and Forecast, 2021-2033
- 6.1. Market Analysis, Insights and Forecast - by Product Type
- 6.1.1. Baby Skin Care
- 6.1.2. Baby Hair Care
- 6.1.3. Baby Toiletries
- 6.1.3.1. Baby Bath Products and Fragrances
- 6.1.3.2. Baby Diapers and Wipes
- 6.1.4. Baby Food and Beverages
- 6.2. Market Analysis, Insights and Forecast - by Distribution Channel
- 6.2.1. Supermarkets/Hypermarkets
- 6.2.2. Convenience Stores
- 6.2.3. Pharmacies/Drug Stores
- 6.2.4. Online Retail Stores
- 6.2.5. Other Distribution Channels
- 6.1. Market Analysis, Insights and Forecast - by Product Type
- 7. North America Baby Products Industry Analysis, Insights and Forecast, 2021-2033
- 7.1. Market Analysis, Insights and Forecast - by Product Type
- 7.1.1. Baby Skin Care
- 7.1.2. Baby Hair Care
- 7.1.3. Baby Toiletries
- 7.1.3.1. Baby Bath Products and Fragrances
- 7.1.3.2. Baby Diapers and Wipes
- 7.1.4. Baby Food and Beverages
- 7.2. Market Analysis, Insights and Forecast - by Distribution Channel
- 7.2.1. Supermarkets/Hypermarkets
- 7.2.2. Convenience Stores
- 7.2.3. Pharmacies/Drug Stores
- 7.2.4. Online Retail Stores
- 7.2.5. Other Distribution Channels
- 7.1. Market Analysis, Insights and Forecast - by Product Type
- 8. Europe Baby Products Industry Analysis, Insights and Forecast, 2021-2033
- 8.1. Market Analysis, Insights and Forecast - by Product Type
- 8.1.1. Baby Skin Care
- 8.1.2. Baby Hair Care
- 8.1.3. Baby Toiletries
- 8.1.3.1. Baby Bath Products and Fragrances
- 8.1.3.2. Baby Diapers and Wipes
- 8.1.4. Baby Food and Beverages
- 8.2. Market Analysis, Insights and Forecast - by Distribution Channel
- 8.2.1. Supermarkets/Hypermarkets
- 8.2.2. Convenience Stores
- 8.2.3. Pharmacies/Drug Stores
- 8.2.4. Online Retail Stores
- 8.2.5. Other Distribution Channels
- 8.1. Market Analysis, Insights and Forecast - by Product Type
- 9. Asia Pacific Baby Products Industry Analysis, Insights and Forecast, 2021-2033
- 9.1. Market Analysis, Insights and Forecast - by Product Type
- 9.1.1. Baby Skin Care
- 9.1.2. Baby Hair Care
- 9.1.3. Baby Toiletries
- 9.1.3.1. Baby Bath Products and Fragrances
- 9.1.3.2. Baby Diapers and Wipes
- 9.1.4. Baby Food and Beverages
- 9.2. Market Analysis, Insights and Forecast - by Distribution Channel
- 9.2.1. Supermarkets/Hypermarkets
- 9.2.2. Convenience Stores
- 9.2.3. Pharmacies/Drug Stores
- 9.2.4. Online Retail Stores
- 9.2.5. Other Distribution Channels
- 9.1. Market Analysis, Insights and Forecast - by Product Type
- 10. South America Baby Products Industry Analysis, Insights and Forecast, 2021-2033
- 10.1. Market Analysis, Insights and Forecast - by Product Type
- 10.1.1. Baby Skin Care
- 10.1.2. Baby Hair Care
- 10.1.3. Baby Toiletries
- 10.1.3.1. Baby Bath Products and Fragrances
- 10.1.3.2. Baby Diapers and Wipes
- 10.1.4. Baby Food and Beverages
- 10.2. Market Analysis, Insights and Forecast - by Distribution Channel
- 10.2.1. Supermarkets/Hypermarkets
- 10.2.2. Convenience Stores
- 10.2.3. Pharmacies/Drug Stores
- 10.2.4. Online Retail Stores
- 10.2.5. Other Distribution Channels
- 10.1. Market Analysis, Insights and Forecast - by Product Type
- 11. Middle East and Africa Baby Products Industry Analysis, Insights and Forecast, 2021-2033
- 11.1. Market Analysis, Insights and Forecast - by Product Type
- 11.1.1. Baby Skin Care
- 11.1.2. Baby Hair Care
- 11.1.3. Baby Toiletries
- 11.1.3.1. Baby Bath Products and Fragrances
- 11.1.3.2. Baby Diapers and Wipes
- 11.1.4. Baby Food and Beverages
- 11.2. Market Analysis, Insights and Forecast - by Distribution Channel
- 11.2.1. Supermarkets/Hypermarkets
- 11.2.2. Convenience Stores
- 11.2.3. Pharmacies/Drug Stores
- 11.2.4. Online Retail Stores
- 11.2.5. Other Distribution Channels
- 11.1. Market Analysis, Insights and Forecast - by Product Type
- 12. Competitive Analysis
- 12.1. Company Profiles
- 12.1.1 Unicharm Corporation
- 12.1.1.1. Company Overview
- 12.1.1.2. Products
- 12.1.1.3. Company Financials
- 12.1.1.4. SWOT Analysis
- 12.1.2 Abbott Laboratories
- 12.1.2.1. Company Overview
- 12.1.2.2. Products
- 12.1.2.3. Company Financials
- 12.1.2.4. SWOT Analysis
- 12.1.3 Unilever PLC
- 12.1.3.1. Company Overview
- 12.1.3.2. Products
- 12.1.3.3. Company Financials
- 12.1.3.4. SWOT Analysis
- 12.1.4 Himalaya Global Holdings Ltd
- 12.1.4.1. Company Overview
- 12.1.4.2. Products
- 12.1.4.3. Company Financials
- 12.1.4.4. SWOT Analysis
- 12.1.5 Danone S A
- 12.1.5.1. Company Overview
- 12.1.5.2. Products
- 12.1.5.3. Company Financials
- 12.1.5.4. SWOT Analysis
- 12.1.6 Kimberly-Clark Corporation
- 12.1.6.1. Company Overview
- 12.1.6.2. Products
- 12.1.6.3. Company Financials
- 12.1.6.4. SWOT Analysis
- 12.1.7 Johnson & Johnson
- 12.1.7.1. Company Overview
- 12.1.7.2. Products
- 12.1.7.3. Company Financials
- 12.1.7.4. SWOT Analysis
- 12.1.8 Procter & Gamble Company
- 12.1.8.1. Company Overview
- 12.1.8.2. Products
- 12.1.8.3. Company Financials
- 12.1.8.4. SWOT Analysis
- 12.1.9 Royal Frieslandcampina N V *List Not Exhaustive
- 12.1.9.1. Company Overview
- 12.1.9.2. Products
- 12.1.9.3. Company Financials
- 12.1.9.4. SWOT Analysis
- 12.1.10 Nestlé S A
- 12.1.10.1. Company Overview
- 12.1.10.2. Products
- 12.1.10.3. Company Financials
- 12.1.10.4. SWOT Analysis
- 12.1.1 Unicharm Corporation
- 12.2. Market Entropy
- 12.2.1 Company's Key Areas Served
- 12.2.2 Recent Developments
- 12.3. Company Market Share Analysis 2025
- 12.3.1 Top 5 Companies Market Share Analysis
- 12.3.2 Top 3 Companies Market Share Analysis
- 12.4. List of Potential Customers
- 13. Research Methodology
List of Figures
- Figure 1: Global Baby Products Industry Revenue Breakdown (Million, %) by Region 2025 & 2033
- Figure 2: Global Baby Products Industry Volume Breakdown (K Units, %) by Region 2025 & 2033
- Figure 3: North America Baby Products Industry Revenue (Million), by Product Type 2025 & 2033
- Figure 4: North America Baby Products Industry Volume (K Units), by Product Type 2025 & 2033
- Figure 5: North America Baby Products Industry Revenue Share (%), by Product Type 2025 & 2033
- Figure 6: North America Baby Products Industry Volume Share (%), by Product Type 2025 & 2033
- Figure 7: North America Baby Products Industry Revenue (Million), by Distribution Channel 2025 & 2033
- Figure 8: North America Baby Products Industry Volume (K Units), by Distribution Channel 2025 & 2033
- Figure 9: North America Baby Products Industry Revenue Share (%), by Distribution Channel 2025 & 2033
- Figure 10: North America Baby Products Industry Volume Share (%), by Distribution Channel 2025 & 2033
- Figure 11: North America Baby Products Industry Revenue (Million), by Country 2025 & 2033
- Figure 12: North America Baby Products Industry Volume (K Units), by Country 2025 & 2033
- Figure 13: North America Baby Products Industry Revenue Share (%), by Country 2025 & 2033
- Figure 14: North America Baby Products Industry Volume Share (%), by Country 2025 & 2033
- Figure 15: Europe Baby Products Industry Revenue (Million), by Product Type 2025 & 2033
- Figure 16: Europe Baby Products Industry Volume (K Units), by Product Type 2025 & 2033
- Figure 17: Europe Baby Products Industry Revenue Share (%), by Product Type 2025 & 2033
- Figure 18: Europe Baby Products Industry Volume Share (%), by Product Type 2025 & 2033
- Figure 19: Europe Baby Products Industry Revenue (Million), by Distribution Channel 2025 & 2033
- Figure 20: Europe Baby Products Industry Volume (K Units), by Distribution Channel 2025 & 2033
- Figure 21: Europe Baby Products Industry Revenue Share (%), by Distribution Channel 2025 & 2033
- Figure 22: Europe Baby Products Industry Volume Share (%), by Distribution Channel 2025 & 2033
- Figure 23: Europe Baby Products Industry Revenue (Million), by Country 2025 & 2033
- Figure 24: Europe Baby Products Industry Volume (K Units), by Country 2025 & 2033
- Figure 25: Europe Baby Products Industry Revenue Share (%), by Country 2025 & 2033
- Figure 26: Europe Baby Products Industry Volume Share (%), by Country 2025 & 2033
- Figure 27: Asia Pacific Baby Products Industry Revenue (Million), by Product Type 2025 & 2033
- Figure 28: Asia Pacific Baby Products Industry Volume (K Units), by Product Type 2025 & 2033
- Figure 29: Asia Pacific Baby Products Industry Revenue Share (%), by Product Type 2025 & 2033
- Figure 30: Asia Pacific Baby Products Industry Volume Share (%), by Product Type 2025 & 2033
- Figure 31: Asia Pacific Baby Products Industry Revenue (Million), by Distribution Channel 2025 & 2033
- Figure 32: Asia Pacific Baby Products Industry Volume (K Units), by Distribution Channel 2025 & 2033
- Figure 33: Asia Pacific Baby Products Industry Revenue Share (%), by Distribution Channel 2025 & 2033
- Figure 34: Asia Pacific Baby Products Industry Volume Share (%), by Distribution Channel 2025 & 2033
- Figure 35: Asia Pacific Baby Products Industry Revenue (Million), by Country 2025 & 2033
- Figure 36: Asia Pacific Baby Products Industry Volume (K Units), by Country 2025 & 2033
- Figure 37: Asia Pacific Baby Products Industry Revenue Share (%), by Country 2025 & 2033
- Figure 38: Asia Pacific Baby Products Industry Volume Share (%), by Country 2025 & 2033
- Figure 39: South America Baby Products Industry Revenue (Million), by Product Type 2025 & 2033
- Figure 40: South America Baby Products Industry Volume (K Units), by Product Type 2025 & 2033
- Figure 41: South America Baby Products Industry Revenue Share (%), by Product Type 2025 & 2033
- Figure 42: South America Baby Products Industry Volume Share (%), by Product Type 2025 & 2033
- Figure 43: South America Baby Products Industry Revenue (Million), by Distribution Channel 2025 & 2033
- Figure 44: South America Baby Products Industry Volume (K Units), by Distribution Channel 2025 & 2033
- Figure 45: South America Baby Products Industry Revenue Share (%), by Distribution Channel 2025 & 2033
- Figure 46: South America Baby Products Industry Volume Share (%), by Distribution Channel 2025 & 2033
- Figure 47: South America Baby Products Industry Revenue (Million), by Country 2025 & 2033
- Figure 48: South America Baby Products Industry Volume (K Units), by Country 2025 & 2033
- Figure 49: South America Baby Products Industry Revenue Share (%), by Country 2025 & 2033
- Figure 50: South America Baby Products Industry Volume Share (%), by Country 2025 & 2033
- Figure 51: Middle East and Africa Baby Products Industry Revenue (Million), by Product Type 2025 & 2033
- Figure 52: Middle East and Africa Baby Products Industry Volume (K Units), by Product Type 2025 & 2033
- Figure 53: Middle East and Africa Baby Products Industry Revenue Share (%), by Product Type 2025 & 2033
- Figure 54: Middle East and Africa Baby Products Industry Volume Share (%), by Product Type 2025 & 2033
- Figure 55: Middle East and Africa Baby Products Industry Revenue (Million), by Distribution Channel 2025 & 2033
- Figure 56: Middle East and Africa Baby Products Industry Volume (K Units), by Distribution Channel 2025 & 2033
- Figure 57: Middle East and Africa Baby Products Industry Revenue Share (%), by Distribution Channel 2025 & 2033
- Figure 58: Middle East and Africa Baby Products Industry Volume Share (%), by Distribution Channel 2025 & 2033
- Figure 59: Middle East and Africa Baby Products Industry Revenue (Million), by Country 2025 & 2033
- Figure 60: Middle East and Africa Baby Products Industry Volume (K Units), by Country 2025 & 2033
- Figure 61: Middle East and Africa Baby Products Industry Revenue Share (%), by Country 2025 & 2033
- Figure 62: Middle East and Africa Baby Products Industry Volume Share (%), by Country 2025 & 2033
List of Tables
- Table 1: Global Baby Products Industry Revenue Million Forecast, by Product Type 2020 & 2033
- Table 2: Global Baby Products Industry Volume K Units Forecast, by Product Type 2020 & 2033
- Table 3: Global Baby Products Industry Revenue Million Forecast, by Distribution Channel 2020 & 2033
- Table 4: Global Baby Products Industry Volume K Units Forecast, by Distribution Channel 2020 & 2033
- Table 5: Global Baby Products Industry Revenue Million Forecast, by Region 2020 & 2033
- Table 6: Global Baby Products Industry Volume K Units Forecast, by Region 2020 & 2033
- Table 7: Global Baby Products Industry Revenue Million Forecast, by Product Type 2020 & 2033
- Table 8: Global Baby Products Industry Volume K Units Forecast, by Product Type 2020 & 2033
- Table 9: Global Baby Products Industry Revenue Million Forecast, by Distribution Channel 2020 & 2033
- Table 10: Global Baby Products Industry Volume K Units Forecast, by Distribution Channel 2020 & 2033
- Table 11: Global Baby Products Industry Revenue Million Forecast, by Country 2020 & 2033
- Table 12: Global Baby Products Industry Volume K Units Forecast, by Country 2020 & 2033
- Table 13: United States Baby Products Industry Revenue (Million) Forecast, by Application 2020 & 2033
- Table 14: United States Baby Products Industry Volume (K Units) Forecast, by Application 2020 & 2033
- Table 15: Canada Baby Products Industry Revenue (Million) Forecast, by Application 2020 & 2033
- Table 16: Canada Baby Products Industry Volume (K Units) Forecast, by Application 2020 & 2033
- Table 17: Mexico Baby Products Industry Revenue (Million) Forecast, by Application 2020 & 2033
- Table 18: Mexico Baby Products Industry Volume (K Units) Forecast, by Application 2020 & 2033
- Table 19: Rest of North America Baby Products Industry Revenue (Million) Forecast, by Application 2020 & 2033
- Table 20: Rest of North America Baby Products Industry Volume (K Units) Forecast, by Application 2020 & 2033
- Table 21: Global Baby Products Industry Revenue Million Forecast, by Product Type 2020 & 2033
- Table 22: Global Baby Products Industry Volume K Units Forecast, by Product Type 2020 & 2033
- Table 23: Global Baby Products Industry Revenue Million Forecast, by Distribution Channel 2020 & 2033
- Table 24: Global Baby Products Industry Volume K Units Forecast, by Distribution Channel 2020 & 2033
- Table 25: Global Baby Products Industry Revenue Million Forecast, by Country 2020 & 2033
- Table 26: Global Baby Products Industry Volume K Units Forecast, by Country 2020 & 2033
- Table 27: United Kingdom Baby Products Industry Revenue (Million) Forecast, by Application 2020 & 2033
- Table 28: United Kingdom Baby Products Industry Volume (K Units) Forecast, by Application 2020 & 2033
- Table 29: Germany Baby Products Industry Revenue (Million) Forecast, by Application 2020 & 2033
- Table 30: Germany Baby Products Industry Volume (K Units) Forecast, by Application 2020 & 2033
- Table 31: Spain Baby Products Industry Revenue (Million) Forecast, by Application 2020 & 2033
- Table 32: Spain Baby Products Industry Volume (K Units) Forecast, by Application 2020 & 2033
- Table 33: France Baby Products Industry Revenue (Million) Forecast, by Application 2020 & 2033
- Table 34: France Baby Products Industry Volume (K Units) Forecast, by Application 2020 & 2033
- Table 35: Italy Baby Products Industry Revenue (Million) Forecast, by Application 2020 & 2033
- Table 36: Italy Baby Products Industry Volume (K Units) Forecast, by Application 2020 & 2033
- Table 37: Russia Baby Products Industry Revenue (Million) Forecast, by Application 2020 & 2033
- Table 38: Russia Baby Products Industry Volume (K Units) Forecast, by Application 2020 & 2033
- Table 39: Rest of Europe Baby Products Industry Revenue (Million) Forecast, by Application 2020 & 2033
- Table 40: Rest of Europe Baby Products Industry Volume (K Units) Forecast, by Application 2020 & 2033
- Table 41: Global Baby Products Industry Revenue Million Forecast, by Product Type 2020 & 2033
- Table 42: Global Baby Products Industry Volume K Units Forecast, by Product Type 2020 & 2033
- Table 43: Global Baby Products Industry Revenue Million Forecast, by Distribution Channel 2020 & 2033
- Table 44: Global Baby Products Industry Volume K Units Forecast, by Distribution Channel 2020 & 2033
- Table 45: Global Baby Products Industry Revenue Million Forecast, by Country 2020 & 2033
- Table 46: Global Baby Products Industry Volume K Units Forecast, by Country 2020 & 2033
- Table 47: China Baby Products Industry Revenue (Million) Forecast, by Application 2020 & 2033
- Table 48: China Baby Products Industry Volume (K Units) Forecast, by Application 2020 & 2033
- Table 49: Japan Baby Products Industry Revenue (Million) Forecast, by Application 2020 & 2033
- Table 50: Japan Baby Products Industry Volume (K Units) Forecast, by Application 2020 & 2033
- Table 51: India Baby Products Industry Revenue (Million) Forecast, by Application 2020 & 2033
- Table 52: India Baby Products Industry Volume (K Units) Forecast, by Application 2020 & 2033
- Table 53: Australia Baby Products Industry Revenue (Million) Forecast, by Application 2020 & 2033
- Table 54: Australia Baby Products Industry Volume (K Units) Forecast, by Application 2020 & 2033
- Table 55: Rest of Asia Pacific Baby Products Industry Revenue (Million) Forecast, by Application 2020 & 2033
- Table 56: Rest of Asia Pacific Baby Products Industry Volume (K Units) Forecast, by Application 2020 & 2033
- Table 57: Global Baby Products Industry Revenue Million Forecast, by Product Type 2020 & 2033
- Table 58: Global Baby Products Industry Volume K Units Forecast, by Product Type 2020 & 2033
- Table 59: Global Baby Products Industry Revenue Million Forecast, by Distribution Channel 2020 & 2033
- Table 60: Global Baby Products Industry Volume K Units Forecast, by Distribution Channel 2020 & 2033
- Table 61: Global Baby Products Industry Revenue Million Forecast, by Country 2020 & 2033
- Table 62: Global Baby Products Industry Volume K Units Forecast, by Country 2020 & 2033
- Table 63: Brazil Baby Products Industry Revenue (Million) Forecast, by Application 2020 & 2033
- Table 64: Brazil Baby Products Industry Volume (K Units) Forecast, by Application 2020 & 2033
- Table 65: Argentina Baby Products Industry Revenue (Million) Forecast, by Application 2020 & 2033
- Table 66: Argentina Baby Products Industry Volume (K Units) Forecast, by Application 2020 & 2033
- Table 67: Rest of South America Baby Products Industry Revenue (Million) Forecast, by Application 2020 & 2033
- Table 68: Rest of South America Baby Products Industry Volume (K Units) Forecast, by Application 2020 & 2033
- Table 69: Global Baby Products Industry Revenue Million Forecast, by Product Type 2020 & 2033
- Table 70: Global Baby Products Industry Volume K Units Forecast, by Product Type 2020 & 2033
- Table 71: Global Baby Products Industry Revenue Million Forecast, by Distribution Channel 2020 & 2033
- Table 72: Global Baby Products Industry Volume K Units Forecast, by Distribution Channel 2020 & 2033
- Table 73: Global Baby Products Industry Revenue Million Forecast, by Country 2020 & 2033
- Table 74: Global Baby Products Industry Volume K Units Forecast, by Country 2020 & 2033
- Table 75: South Africa Baby Products Industry Revenue (Million) Forecast, by Application 2020 & 2033
- Table 76: South Africa Baby Products Industry Volume (K Units) Forecast, by Application 2020 & 2033
- Table 77: Saudi Arabia Baby Products Industry Revenue (Million) Forecast, by Application 2020 & 2033
- Table 78: Saudi Arabia Baby Products Industry Volume (K Units) Forecast, by Application 2020 & 2033
- Table 79: Rest of Middle East and Africa Baby Products Industry Revenue (Million) Forecast, by Application 2020 & 2033
- Table 80: Rest of Middle East and Africa Baby Products Industry Volume (K Units) Forecast, by Application 2020 & 2033
Frequently Asked Questions
1. What is the projected Compound Annual Growth Rate (CAGR) of the Baby Products Industry?
The projected CAGR is approximately 5.08%.
2. Which companies are prominent players in the Baby Products Industry?
Key companies in the market include Unicharm Corporation, Abbott Laboratories, Unilever PLC, Himalaya Global Holdings Ltd, Danone S A, Kimberly-Clark Corporation, Johnson & Johnson, Procter & Gamble Company, Royal Frieslandcampina N V *List Not Exhaustive, Nestlé S A.
3. What are the main segments of the Baby Products Industry?
The market segments include Product Type, Distribution Channel.
4. Can you provide details about the market size?
The market size is estimated to be USD 161.19 Million as of 2022.
5. What are some drivers contributing to market growth?
Concerns Among Parents Toward Baby Personal Care and Hygiene; Influence of Endorsements and Aggressive Marketing.
6. What are the notable trends driving market growth?
Increasing Preference for Fortified Baby Food.
7. Are there any restraints impacting market growth?
Presence of Counterfeit Products.
8. Can you provide examples of recent developments in the market?
February 2024: MamyPoko Pants launched Extra Absorb Pants with 30+ patented technologies. The diapers are claimed to be up to 60% absorbent.
9. What pricing options are available for accessing the report?
Pricing options include single-user, multi-user, and enterprise licenses priced at USD 4750, USD 5250, and USD 8750 respectively.
10. Is the market size provided in terms of value or volume?
The market size is provided in terms of value, measured in Million and volume, measured in K Units.
11. Are there any specific market keywords associated with the report?
Yes, the market keyword associated with the report is "Baby Products Industry," which aids in identifying and referencing the specific market segment covered.
12. How do I determine which pricing option suits my needs best?
The pricing options vary based on user requirements and access needs. Individual users may opt for single-user licenses, while businesses requiring broader access may choose multi-user or enterprise licenses for cost-effective access to the report.
13. Are there any additional resources or data provided in the Baby Products Industry report?
While the report offers comprehensive insights, it's advisable to review the specific contents or supplementary materials provided to ascertain if additional resources or data are available.
14. How can I stay updated on further developments or reports in the Baby Products Industry?
To stay informed about further developments, trends, and reports in the Baby Products Industry, consider subscribing to industry newsletters, following relevant companies and organizations, or regularly checking reputable industry news sources and publications.
Methodology
Step 1 - Identification of Relevant Samples Size from Population Database


Step 2 - Approaches for Defining Global Market Size (Value, Volume* & Price*)

Note*: In applicable scenarios
Step 3 - Data Sources
Primary Research
- Web Analytics
- Survey Reports
- Research Institute
- Latest Research Reports
- Opinion Leaders
Secondary Research
- Annual Reports
- White Paper
- Latest Press Release
- Industry Association
- Paid Database
- Investor Presentations

Step 4 - Data Triangulation
Involves using different sources of information in order to increase the validity of a study
These sources are likely to be stakeholders in a program - participants, other researchers, program staff, other community members, and so on.
Then we put all data in single framework & apply various statistical tools to find out the dynamic on the market.
During the analysis stage, feedback from the stakeholder groups would be compared to determine areas of agreement as well as areas of divergence