Challenges to Overcome in Autonomous Underwater Vehicles Market Growth: Analysis 2025-2033

Autonomous Underwater Vehicles by Production Analysis, by Consumption Analysis, by Import Market Analysis (Value & Volume), by Export Market Analysis (Value & Volume), by Price Trend Analysis, by North America (United States, Canada, Mexico), by South America (Brazil, Argentina, Rest of South America), by Europe (United Kingdom, Germany, France, Italy, Spain, Russia, Benelux, Nordics, Rest of Europe), by Middle East & Africa (Turkey, Israel, GCC, North Africa, South Africa, Rest of Middle East & Africa), by Asia Pacific (China, India, Japan, South Korea, ASEAN, Oceania, Rest of Asia Pacific) Forecast 2025-2033

Jun 24 2025
Base Year: 2024

234 Pages
Main Logo

Challenges to Overcome in Autonomous Underwater Vehicles Market Growth: Analysis 2025-2033


Home
Industries
Aerospace & Defense
sponsor image
sponsor image
sponsor image
sponsor image

Tailored for you

  • In-depth Analysis Tailored to Specified Regions or Segments
  • Company Profiles Customized to User Preferences
  • Comprehensive Insights Focused on Specific Segments or Regions
  • Customized Evaluation of Competitive Landscape to Meet Your Needs
  • Tailored Customization to Address Other Specific Requirements
Ask for customization


Key Insights

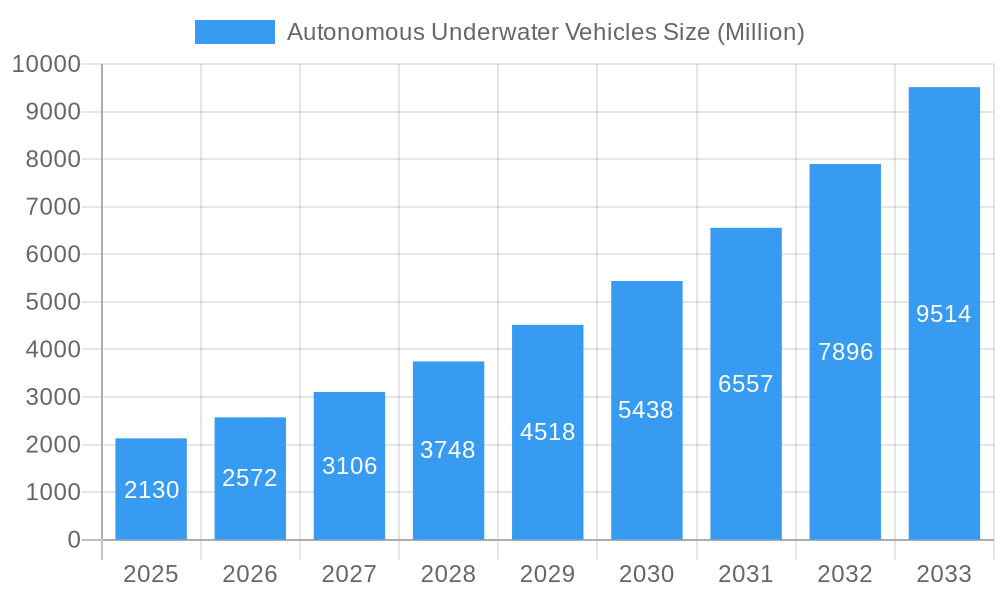
The Autonomous Underwater Vehicle (AUV) market is experiencing robust growth, projected to reach \$2.13 billion in 2025 and exhibiting a Compound Annual Growth Rate (CAGR) of 20.62% from 2025 to 2033. This expansion is driven by several key factors. Increasing demand for underwater surveys and inspections across diverse sectors like oil and gas, military and defense, and environmental monitoring is a primary catalyst. Advancements in sensor technology, AI-powered navigation systems, and improved battery life are enhancing AUV capabilities, enabling more complex and extended missions. Furthermore, the growing need for efficient infrastructure inspection, particularly in offshore energy operations and pipelines, is fueling market growth. The rise of autonomous systems and the reduction in operational costs associated with AUVs compared to traditional manned submersibles are also contributing to wider adoption. The market's segmentation by application (Military & Defense, Oil & Gas, Environment Protection & Monitoring, Oceanography, Archaeology & Exploration, Search & Salvage Operations) and type (Small, Medium, Large) reflects the diverse applications and varying operational requirements. The geographical distribution of the market shows a strong presence in North America and Europe, with the Asia-Pacific region emerging as a rapidly growing market due to increasing investment in infrastructure projects and offshore energy exploration.
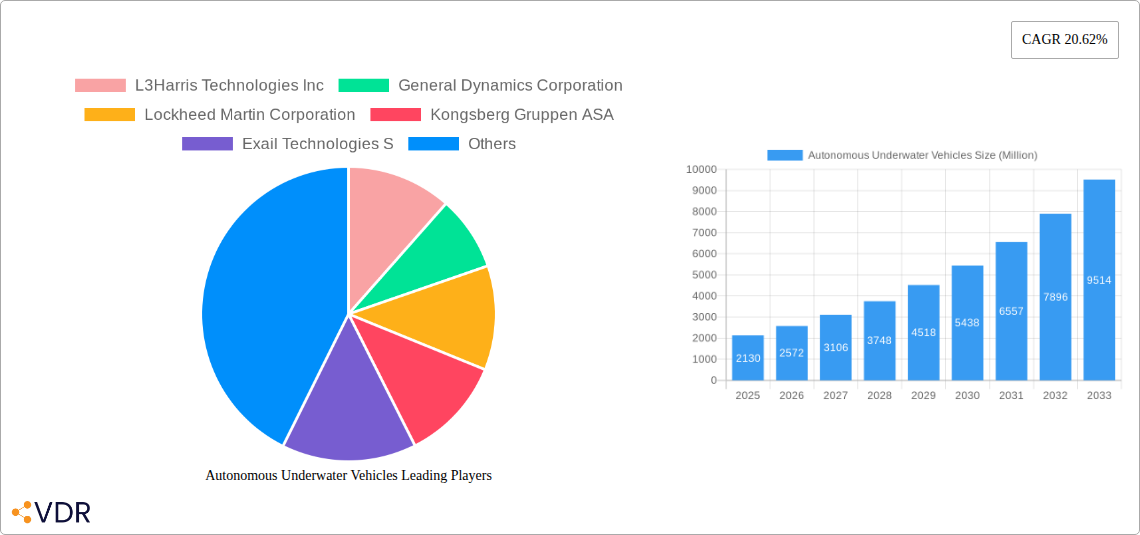
The competitive landscape is characterized by established players like L3Harris Technologies Inc, General Dynamics Corporation, Lockheed Martin Corporation, and Kongsberg Gruppen ASA, alongside emerging technology companies. These companies are focusing on innovation in areas such as advanced sensor integration, enhanced navigation systems, and improved data processing capabilities. Strategic partnerships and collaborations are becoming increasingly common as companies strive to expand their market reach and leverage specialized expertise. Future growth will likely be influenced by factors such as technological advancements, government regulations related to autonomous systems, and the increasing need for data-driven insights in diverse underwater applications. The market is expected to witness further consolidation and the entry of new players in the coming years, driven by the significant growth potential in various applications and regions.

Autonomous Underwater Vehicles Research Report - Market Size, Growth & Forecast

Autonomous Underwater Vehicles (AUV) Market Report: 2019-2033

This comprehensive report provides a detailed analysis of the Autonomous Underwater Vehicles (AUV) market, encompassing market dynamics, growth trends, regional dominance, product landscape, key players, and future outlook. The study period covers 2019-2033, with 2025 as the base and estimated year. The report is essential for industry professionals, investors, and anyone seeking in-depth knowledge of this rapidly evolving sector. The parent market is the underwater robotics market, while the child market focuses specifically on autonomous systems.

The AUV market is projected to reach xx Million units by 2033.

Autonomous Underwater Vehicles Market Dynamics & Structure

The AUV market is characterized by a moderately concentrated landscape with key players vying for market share. Technological innovation, particularly in areas like AI, sensor technology, and energy efficiency, is a primary driver. Stringent regulatory frameworks governing underwater operations influence market dynamics, while the emergence of alternative solutions, like remotely operated vehicles (ROVs), presents competitive challenges. End-user demographics span various sectors, creating diverse demands. The market exhibits moderate M&A activity, with strategic acquisitions shaping the competitive landscape.

  • Market Concentration: Moderately concentrated, with top 10 players holding approximately 65% market share in 2025.
  • Technological Innovation: Advancements in AI, sensor integration, and battery technology are key drivers.
  • Regulatory Framework: International maritime regulations and environmental protection laws significantly impact operations.
  • Competitive Substitutes: ROVs and other remotely operated underwater systems offer alternative solutions.
  • End-User Demographics: Military & Defense, Oil & Gas, Scientific research, and Commercial sectors are key end-users.
  • M&A Trends: Strategic acquisitions focusing on technology integration and geographical expansion are expected to continue. An estimated 15-20 M&A deals are predicted between 2025 and 2033.

Autonomous Underwater Vehicles Growth Trends & Insights

The global AUV market experienced robust growth during the historical period (2019-2024), driven by increasing demand across various applications. The market size is projected to expand significantly during the forecast period (2025-2033), propelled by technological advancements, rising government investments in defense and oceanographic research, and the growing need for efficient underwater infrastructure inspection and maintenance. The adoption rate is expected to increase steadily, with higher penetration in developed nations. Technological disruptions, particularly in areas like AI-powered autonomy and improved sensor capabilities, will reshape the market landscape. Consumer behavior shifts toward more sophisticated and reliable AUV systems will further fuel growth. The CAGR for the forecast period is estimated at xx%. Market penetration in the key application segments will gradually increase over the forecast period.

Autonomous Underwater Vehicles Growth

Dominant Regions, Countries, or Segments in Autonomous Underwater Vehicles

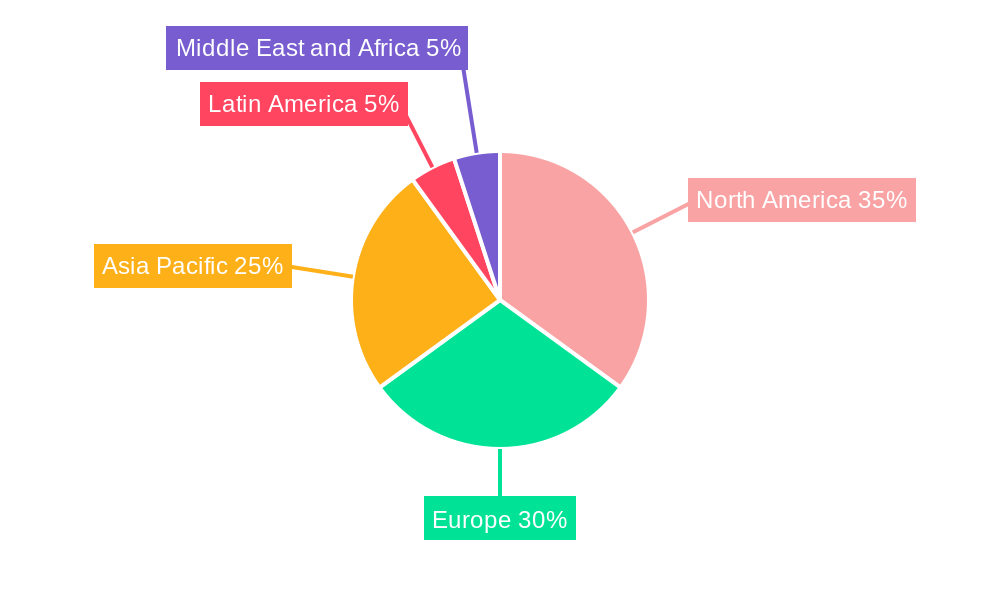
The North American region is currently the dominant market for AUVs, driven by significant military spending and a robust oil and gas sector. However, the Asia-Pacific region is expected to exhibit the highest growth rate over the forecast period, fueled by increasing investments in infrastructure development and marine research. The Military & Defense segment currently holds the largest market share, but the Oil & Gas and Environmental Protection & Monitoring segments are expected to witness substantial growth.

  • Key Drivers (North America): High defense spending, advanced technological capabilities, well-established oil & gas infrastructure.
  • Key Drivers (Asia-Pacific): Growing investments in infrastructure, expanding maritime activities, increasing focus on oceanographic research.
  • Dominant Segment (By Application): Military & Defense (xx% market share in 2025).
  • Dominant Segment (By Type): Medium-sized AUVs (xx% market share in 2025) due to versatility.
  • Growth Potential: Asia-Pacific region shows the highest growth potential.

Autonomous Underwater Vehicles Product Landscape

The AUV market offers a diverse range of products, varying in size, payload capacity, endurance, and operational capabilities. Recent innovations include advanced sensor integration, enhanced AI-powered navigation systems, and improved energy storage solutions. These advancements enable longer deployments, improved data acquisition, and enhanced operational efficiency. Unique selling propositions focus on maneuverability, reliability, and data processing capabilities. The market is witnessing a shift toward more compact and cost-effective AUVs for diverse applications.

Key Drivers, Barriers & Challenges in Autonomous Underwater Vehicles

Key Drivers:

  • Technological advancements in autonomy, sensor technology, and energy storage.
  • Increasing demand from military and defense, oil and gas, and environmental monitoring sectors.
  • Government initiatives and funding for underwater research and exploration.

Key Challenges:

  • High initial investment costs for AUV systems.
  • Dependence on reliable communication infrastructure in underwater environments.
  • Stringent safety regulations and environmental concerns that impact operations.
  • xx% increase in raw material cost in 2024 impacted the manufacturing cost by xx%.

Emerging Opportunities in Autonomous Underwater Vehicles

Emerging opportunities lie in the development of smaller, more adaptable AUVs for various applications, including aquaculture monitoring, pipeline inspection, and underwater archaeology. Untapped markets in developing economies present significant growth potential. The integration of advanced AI and machine learning algorithms for autonomous decision-making and data analysis offers further opportunities for innovation. Increased demand for subsea cable inspection and repair also opens new avenues for growth.

Growth Accelerators in the Autonomous Underwater Vehicles Industry

Long-term growth will be driven by continuous technological breakthroughs in areas such as AI-powered navigation, extended endurance capabilities, and improved data processing. Strategic partnerships between technology providers and end-users will accelerate market penetration. Expanding market applications, particularly in emerging economies and previously underserved sectors, will further drive market expansion.

Key Players Shaping the Autonomous Underwater Vehicles Market

  • L3Harris Technologies Inc
  • General Dynamics Corporation
  • Lockheed Martin Corporation
  • Kongsberg Gruppen ASA
  • Exail Technologies S.A.S
  • SAAB AB
  • BAE Systems plc
  • Teledyne Technologies Inc
  • The Boeing Company

Notable Milestones in Autonomous Underwater Vehicles Sector

  • July 2023: L3Harris Technologies Inc. achieved the first fully autonomous launch and recovery of an AUV from an underway submarine using its Iver4 AUV technology. This significantly advances AUV operational capabilities.
  • February 2024: Kongsberg was awarded a contract by the Defense Innovation Unit (DIU) to provide HUGIN AUV capabilities to the US military, highlighting the growing demand for advanced AUV systems in defense applications.

In-Depth Autonomous Underwater Vehicles Market Outlook

The future of the AUV market is bright, with significant growth potential driven by technological advancements, increasing demand across diverse sectors, and expanding applications in previously untapped markets. Strategic opportunities lie in developing innovative AUV systems with enhanced autonomy, improved sensor capabilities, and extended endurance. Focus on cost-effective solutions and partnerships will be crucial for sustained growth and market penetration.

Autonomous Underwater Vehicles Segmentation

  • 1. Production Analysis
  • 2. Consumption Analysis
  • 3. Import Market Analysis (Value & Volume)
  • 4. Export Market Analysis (Value & Volume)
  • 5. Price Trend Analysis

Autonomous Underwater Vehicles Segmentation By Geography

  • 1. North America
    • 1.1. United States
    • 1.2. Canada
    • 1.3. Mexico
  • 2. South America
    • 2.1. Brazil
    • 2.2. Argentina
    • 2.3. Rest of South America
  • 3. Europe
    • 3.1. United Kingdom
    • 3.2. Germany
    • 3.3. France
    • 3.4. Italy
    • 3.5. Spain
    • 3.6. Russia
    • 3.7. Benelux
    • 3.8. Nordics
    • 3.9. Rest of Europe
  • 4. Middle East & Africa
    • 4.1. Turkey
    • 4.2. Israel
    • 4.3. GCC
    • 4.4. North Africa
    • 4.5. South Africa
    • 4.6. Rest of Middle East & Africa
  • 5. Asia Pacific
    • 5.1. China
    • 5.2. India
    • 5.3. Japan
    • 5.4. South Korea
    • 5.5. ASEAN
    • 5.6. Oceania
    • 5.7. Rest of Asia Pacific
Autonomous Underwater Vehicles Regional Share


Autonomous Underwater Vehicles REPORT HIGHLIGHTS

AspectsDetails
Study Period 2019-2033
Base Year 2024
Estimated Year 2025
Forecast Period2025-2033
Historical Period2019-2024
Growth RateCAGR of 20.62% from 2019-2033
Segmentation
    • By Production Analysis
    • By Consumption Analysis
    • By Import Market Analysis (Value & Volume)
    • By Export Market Analysis (Value & Volume)
    • By Price Trend Analysis
  • By Geography
    • North America
      • United States
      • Canada
      • Mexico
    • South America
      • Brazil
      • Argentina
      • Rest of South America
    • Europe
      • United Kingdom
      • Germany
      • France
      • Italy
      • Spain
      • Russia
      • Benelux
      • Nordics
      • Rest of Europe
    • Middle East & Africa
      • Turkey
      • Israel
      • GCC
      • North Africa
      • South Africa
      • Rest of Middle East & Africa
    • Asia Pacific
      • China
      • India
      • Japan
      • South Korea
      • ASEAN
      • Oceania
      • Rest of Asia Pacific


Table of Contents

  1. 1. Introduction
    • 1.1. Research Scope
    • 1.2. Market Segmentation
    • 1.3. Research Methodology
    • 1.4. Definitions and Assumptions
  2. 2. Executive Summary
    • 2.1. Introduction
  3. 3. Market Dynamics
    • 3.1. Introduction
      • 3.2. Market Drivers
        • 3.2.1. Increase in Internet of Things (IoT) and Autonomous Systems; Rise in Demand for Military and Defense Satellite Communication Solutions
      • 3.3. Market Restrains
        • 3.3.1. Cybersecurity Threats to Satellite Communication; Interference in Transmission of Data
      • 3.4. Market Trends
        • 3.4.1. Military & Defense will a Hold Significant Market Share
  4. 4. Market Factor Analysis
    • 4.1. Porters Five Forces
    • 4.2. Supply/Value Chain
    • 4.3. PESTEL analysis
    • 4.4. Market Entropy
    • 4.5. Patent/Trademark Analysis
  5. 5. Global Autonomous Underwater Vehicles Analysis, Insights and Forecast, 2019-2031
    • 5.1. Market Analysis, Insights and Forecast - by Production Analysis
      • 5.2. Market Analysis, Insights and Forecast - by Consumption Analysis
        • 5.3. Market Analysis, Insights and Forecast - by Import Market Analysis (Value & Volume)
          • 5.4. Market Analysis, Insights and Forecast - by Export Market Analysis (Value & Volume)
            • 5.5. Market Analysis, Insights and Forecast - by Price Trend Analysis
              • 5.6. Market Analysis, Insights and Forecast - by Region
                • 5.6.1. North America
                • 5.6.2. South America
                • 5.6.3. Europe
                • 5.6.4. Middle East & Africa
                • 5.6.5. Asia Pacific
            • 6. North America Autonomous Underwater Vehicles Analysis, Insights and Forecast, 2019-2031
              • 6.1. Market Analysis, Insights and Forecast - by Production Analysis
                • 6.2. Market Analysis, Insights and Forecast - by Consumption Analysis
                  • 6.3. Market Analysis, Insights and Forecast - by Import Market Analysis (Value & Volume)
                    • 6.4. Market Analysis, Insights and Forecast - by Export Market Analysis (Value & Volume)
                      • 6.5. Market Analysis, Insights and Forecast - by Price Trend Analysis
                      • 7. South America Autonomous Underwater Vehicles Analysis, Insights and Forecast, 2019-2031
                        • 7.1. Market Analysis, Insights and Forecast - by Production Analysis
                          • 7.2. Market Analysis, Insights and Forecast - by Consumption Analysis
                            • 7.3. Market Analysis, Insights and Forecast - by Import Market Analysis (Value & Volume)
                              • 7.4. Market Analysis, Insights and Forecast - by Export Market Analysis (Value & Volume)
                                • 7.5. Market Analysis, Insights and Forecast - by Price Trend Analysis
                                • 8. Europe Autonomous Underwater Vehicles Analysis, Insights and Forecast, 2019-2031
                                  • 8.1. Market Analysis, Insights and Forecast - by Production Analysis
                                    • 8.2. Market Analysis, Insights and Forecast - by Consumption Analysis
                                      • 8.3. Market Analysis, Insights and Forecast - by Import Market Analysis (Value & Volume)
                                        • 8.4. Market Analysis, Insights and Forecast - by Export Market Analysis (Value & Volume)
                                          • 8.5. Market Analysis, Insights and Forecast - by Price Trend Analysis
                                          • 9. Middle East & Africa Autonomous Underwater Vehicles Analysis, Insights and Forecast, 2019-2031
                                            • 9.1. Market Analysis, Insights and Forecast - by Production Analysis
                                              • 9.2. Market Analysis, Insights and Forecast - by Consumption Analysis
                                                • 9.3. Market Analysis, Insights and Forecast - by Import Market Analysis (Value & Volume)
                                                  • 9.4. Market Analysis, Insights and Forecast - by Export Market Analysis (Value & Volume)
                                                    • 9.5. Market Analysis, Insights and Forecast - by Price Trend Analysis
                                                    • 10. Asia Pacific Autonomous Underwater Vehicles Analysis, Insights and Forecast, 2019-2031
                                                      • 10.1. Market Analysis, Insights and Forecast - by Production Analysis
                                                        • 10.2. Market Analysis, Insights and Forecast - by Consumption Analysis
                                                          • 10.3. Market Analysis, Insights and Forecast - by Import Market Analysis (Value & Volume)
                                                            • 10.4. Market Analysis, Insights and Forecast - by Export Market Analysis (Value & Volume)
                                                              • 10.5. Market Analysis, Insights and Forecast - by Price Trend Analysis
                                                              • 11. North America Autonomous Underwater Vehicles Analysis, Insights and Forecast, 2019-2031
                                                                  • 11.1. Market Analysis, Insights and Forecast - By Country/Sub-region
                                                                    • 11.1.1 United States
                                                                    • 11.1.2 Canada
                                                              • 12. Europe Autonomous Underwater Vehicles Analysis, Insights and Forecast, 2019-2031
                                                                  • 12.1. Market Analysis, Insights and Forecast - By Country/Sub-region
                                                                    • 12.1.1 United Kingdom
                                                                    • 12.1.2 France
                                                                    • 12.1.3 Germany
                                                                    • 12.1.4 Russia
                                                                    • 12.1.5 Rest of Europe
                                                              • 13. Asia Pacific Autonomous Underwater Vehicles Analysis, Insights and Forecast, 2019-2031
                                                                  • 13.1. Market Analysis, Insights and Forecast - By Country/Sub-region
                                                                    • 13.1.1 India
                                                                    • 13.1.2 China
                                                                    • 13.1.3 Japan
                                                                    • 13.1.4 South Korea
                                                                    • 13.1.5 Rest of Asia Pacific
                                                              • 14. Latin America Autonomous Underwater Vehicles Analysis, Insights and Forecast, 2019-2031
                                                                  • 14.1. Market Analysis, Insights and Forecast - By Country/Sub-region
                                                                    • 14.1.1 Brazil
                                                                    • 14.1.2 Rest of Latin America
                                                              • 15. Middle East and Africa Autonomous Underwater Vehicles Analysis, Insights and Forecast, 2019-2031
                                                                  • 15.1. Market Analysis, Insights and Forecast - By Country/Sub-region
                                                                    • 15.1.1 United Arab Emirates
                                                                    • 15.1.2 Saudi Arabia
                                                                    • 15.1.3 Israel
                                                                    • 15.1.4 Rest of Middle East and Africa
                                                              • 16. Competitive Analysis
                                                                • 16.1. Global Market Share Analysis 2024
                                                                  • 16.2. Company Profiles
                                                                    • 16.2.1 L3Harris Technologies Inc
                                                                      • 16.2.1.1. Overview
                                                                      • 16.2.1.2. Products
                                                                      • 16.2.1.3. SWOT Analysis
                                                                      • 16.2.1.4. Recent Developments
                                                                      • 16.2.1.5. Financials (Based on Availability)
                                                                    • 16.2.2 General Dynamics Corporation
                                                                      • 16.2.2.1. Overview
                                                                      • 16.2.2.2. Products
                                                                      • 16.2.2.3. SWOT Analysis
                                                                      • 16.2.2.4. Recent Developments
                                                                      • 16.2.2.5. Financials (Based on Availability)
                                                                    • 16.2.3 Lockheed Martin Corporation
                                                                      • 16.2.3.1. Overview
                                                                      • 16.2.3.2. Products
                                                                      • 16.2.3.3. SWOT Analysis
                                                                      • 16.2.3.4. Recent Developments
                                                                      • 16.2.3.5. Financials (Based on Availability)
                                                                    • 16.2.4 Kongsberg Gruppen ASA
                                                                      • 16.2.4.1. Overview
                                                                      • 16.2.4.2. Products
                                                                      • 16.2.4.3. SWOT Analysis
                                                                      • 16.2.4.4. Recent Developments
                                                                      • 16.2.4.5. Financials (Based on Availability)
                                                                    • 16.2.5 Exail Technologies S
                                                                      • 16.2.5.1. Overview
                                                                      • 16.2.5.2. Products
                                                                      • 16.2.5.3. SWOT Analysis
                                                                      • 16.2.5.4. Recent Developments
                                                                      • 16.2.5.5. Financials (Based on Availability)
                                                                    • 16.2.6 SAAB AB
                                                                      • 16.2.6.1. Overview
                                                                      • 16.2.6.2. Products
                                                                      • 16.2.6.3. SWOT Analysis
                                                                      • 16.2.6.4. Recent Developments
                                                                      • 16.2.6.5. Financials (Based on Availability)
                                                                    • 16.2.7 BAE Systems plc
                                                                      • 16.2.7.1. Overview
                                                                      • 16.2.7.2. Products
                                                                      • 16.2.7.3. SWOT Analysis
                                                                      • 16.2.7.4. Recent Developments
                                                                      • 16.2.7.5. Financials (Based on Availability)
                                                                    • 16.2.8 Teledyne Technologies Inc
                                                                      • 16.2.8.1. Overview
                                                                      • 16.2.8.2. Products
                                                                      • 16.2.8.3. SWOT Analysis
                                                                      • 16.2.8.4. Recent Developments
                                                                      • 16.2.8.5. Financials (Based on Availability)
                                                                    • 16.2.9 The Boeing Company
                                                                      • 16.2.9.1. Overview
                                                                      • 16.2.9.2. Products
                                                                      • 16.2.9.3. SWOT Analysis
                                                                      • 16.2.9.4. Recent Developments
                                                                      • 16.2.9.5. Financials (Based on Availability)

                                                              List of Figures

                                                              1. Figure 1: Global Autonomous Underwater Vehicles Revenue Breakdown (Million, %) by Region 2024 & 2032
                                                              2. Figure 2: North America Autonomous Underwater Vehicles Revenue (Million), by Country 2024 & 2032
                                                              3. Figure 3: North America Autonomous Underwater Vehicles Revenue Share (%), by Country 2024 & 2032
                                                              4. Figure 4: Europe Autonomous Underwater Vehicles Revenue (Million), by Country 2024 & 2032
                                                              5. Figure 5: Europe Autonomous Underwater Vehicles Revenue Share (%), by Country 2024 & 2032
                                                              6. Figure 6: Asia Pacific Autonomous Underwater Vehicles Revenue (Million), by Country 2024 & 2032
                                                              7. Figure 7: Asia Pacific Autonomous Underwater Vehicles Revenue Share (%), by Country 2024 & 2032
                                                              8. Figure 8: Latin America Autonomous Underwater Vehicles Revenue (Million), by Country 2024 & 2032
                                                              9. Figure 9: Latin America Autonomous Underwater Vehicles Revenue Share (%), by Country 2024 & 2032
                                                              10. Figure 10: Middle East and Africa Autonomous Underwater Vehicles Revenue (Million), by Country 2024 & 2032
                                                              11. Figure 11: Middle East and Africa Autonomous Underwater Vehicles Revenue Share (%), by Country 2024 & 2032
                                                              12. Figure 12: North America Autonomous Underwater Vehicles Revenue (Million), by Production Analysis 2024 & 2032
                                                              13. Figure 13: North America Autonomous Underwater Vehicles Revenue Share (%), by Production Analysis 2024 & 2032
                                                              14. Figure 14: North America Autonomous Underwater Vehicles Revenue (Million), by Consumption Analysis 2024 & 2032
                                                              15. Figure 15: North America Autonomous Underwater Vehicles Revenue Share (%), by Consumption Analysis 2024 & 2032
                                                              16. Figure 16: North America Autonomous Underwater Vehicles Revenue (Million), by Import Market Analysis (Value & Volume) 2024 & 2032
                                                              17. Figure 17: North America Autonomous Underwater Vehicles Revenue Share (%), by Import Market Analysis (Value & Volume) 2024 & 2032
                                                              18. Figure 18: North America Autonomous Underwater Vehicles Revenue (Million), by Export Market Analysis (Value & Volume) 2024 & 2032
                                                              19. Figure 19: North America Autonomous Underwater Vehicles Revenue Share (%), by Export Market Analysis (Value & Volume) 2024 & 2032
                                                              20. Figure 20: North America Autonomous Underwater Vehicles Revenue (Million), by Price Trend Analysis 2024 & 2032
                                                              21. Figure 21: North America Autonomous Underwater Vehicles Revenue Share (%), by Price Trend Analysis 2024 & 2032
                                                              22. Figure 22: North America Autonomous Underwater Vehicles Revenue (Million), by Country 2024 & 2032
                                                              23. Figure 23: North America Autonomous Underwater Vehicles Revenue Share (%), by Country 2024 & 2032
                                                              24. Figure 24: South America Autonomous Underwater Vehicles Revenue (Million), by Production Analysis 2024 & 2032
                                                              25. Figure 25: South America Autonomous Underwater Vehicles Revenue Share (%), by Production Analysis 2024 & 2032
                                                              26. Figure 26: South America Autonomous Underwater Vehicles Revenue (Million), by Consumption Analysis 2024 & 2032
                                                              27. Figure 27: South America Autonomous Underwater Vehicles Revenue Share (%), by Consumption Analysis 2024 & 2032
                                                              28. Figure 28: South America Autonomous Underwater Vehicles Revenue (Million), by Import Market Analysis (Value & Volume) 2024 & 2032
                                                              29. Figure 29: South America Autonomous Underwater Vehicles Revenue Share (%), by Import Market Analysis (Value & Volume) 2024 & 2032
                                                              30. Figure 30: South America Autonomous Underwater Vehicles Revenue (Million), by Export Market Analysis (Value & Volume) 2024 & 2032
                                                              31. Figure 31: South America Autonomous Underwater Vehicles Revenue Share (%), by Export Market Analysis (Value & Volume) 2024 & 2032
                                                              32. Figure 32: South America Autonomous Underwater Vehicles Revenue (Million), by Price Trend Analysis 2024 & 2032
                                                              33. Figure 33: South America Autonomous Underwater Vehicles Revenue Share (%), by Price Trend Analysis 2024 & 2032
                                                              34. Figure 34: South America Autonomous Underwater Vehicles Revenue (Million), by Country 2024 & 2032
                                                              35. Figure 35: South America Autonomous Underwater Vehicles Revenue Share (%), by Country 2024 & 2032
                                                              36. Figure 36: Europe Autonomous Underwater Vehicles Revenue (Million), by Production Analysis 2024 & 2032
                                                              37. Figure 37: Europe Autonomous Underwater Vehicles Revenue Share (%), by Production Analysis 2024 & 2032
                                                              38. Figure 38: Europe Autonomous Underwater Vehicles Revenue (Million), by Consumption Analysis 2024 & 2032
                                                              39. Figure 39: Europe Autonomous Underwater Vehicles Revenue Share (%), by Consumption Analysis 2024 & 2032
                                                              40. Figure 40: Europe Autonomous Underwater Vehicles Revenue (Million), by Import Market Analysis (Value & Volume) 2024 & 2032
                                                              41. Figure 41: Europe Autonomous Underwater Vehicles Revenue Share (%), by Import Market Analysis (Value & Volume) 2024 & 2032
                                                              42. Figure 42: Europe Autonomous Underwater Vehicles Revenue (Million), by Export Market Analysis (Value & Volume) 2024 & 2032
                                                              43. Figure 43: Europe Autonomous Underwater Vehicles Revenue Share (%), by Export Market Analysis (Value & Volume) 2024 & 2032
                                                              44. Figure 44: Europe Autonomous Underwater Vehicles Revenue (Million), by Price Trend Analysis 2024 & 2032
                                                              45. Figure 45: Europe Autonomous Underwater Vehicles Revenue Share (%), by Price Trend Analysis 2024 & 2032
                                                              46. Figure 46: Europe Autonomous Underwater Vehicles Revenue (Million), by Country 2024 & 2032
                                                              47. Figure 47: Europe Autonomous Underwater Vehicles Revenue Share (%), by Country 2024 & 2032
                                                              48. Figure 48: Middle East & Africa Autonomous Underwater Vehicles Revenue (Million), by Production Analysis 2024 & 2032
                                                              49. Figure 49: Middle East & Africa Autonomous Underwater Vehicles Revenue Share (%), by Production Analysis 2024 & 2032
                                                              50. Figure 50: Middle East & Africa Autonomous Underwater Vehicles Revenue (Million), by Consumption Analysis 2024 & 2032
                                                              51. Figure 51: Middle East & Africa Autonomous Underwater Vehicles Revenue Share (%), by Consumption Analysis 2024 & 2032
                                                              52. Figure 52: Middle East & Africa Autonomous Underwater Vehicles Revenue (Million), by Import Market Analysis (Value & Volume) 2024 & 2032
                                                              53. Figure 53: Middle East & Africa Autonomous Underwater Vehicles Revenue Share (%), by Import Market Analysis (Value & Volume) 2024 & 2032
                                                              54. Figure 54: Middle East & Africa Autonomous Underwater Vehicles Revenue (Million), by Export Market Analysis (Value & Volume) 2024 & 2032
                                                              55. Figure 55: Middle East & Africa Autonomous Underwater Vehicles Revenue Share (%), by Export Market Analysis (Value & Volume) 2024 & 2032
                                                              56. Figure 56: Middle East & Africa Autonomous Underwater Vehicles Revenue (Million), by Price Trend Analysis 2024 & 2032
                                                              57. Figure 57: Middle East & Africa Autonomous Underwater Vehicles Revenue Share (%), by Price Trend Analysis 2024 & 2032
                                                              58. Figure 58: Middle East & Africa Autonomous Underwater Vehicles Revenue (Million), by Country 2024 & 2032
                                                              59. Figure 59: Middle East & Africa Autonomous Underwater Vehicles Revenue Share (%), by Country 2024 & 2032
                                                              60. Figure 60: Asia Pacific Autonomous Underwater Vehicles Revenue (Million), by Production Analysis 2024 & 2032
                                                              61. Figure 61: Asia Pacific Autonomous Underwater Vehicles Revenue Share (%), by Production Analysis 2024 & 2032
                                                              62. Figure 62: Asia Pacific Autonomous Underwater Vehicles Revenue (Million), by Consumption Analysis 2024 & 2032
                                                              63. Figure 63: Asia Pacific Autonomous Underwater Vehicles Revenue Share (%), by Consumption Analysis 2024 & 2032
                                                              64. Figure 64: Asia Pacific Autonomous Underwater Vehicles Revenue (Million), by Import Market Analysis (Value & Volume) 2024 & 2032
                                                              65. Figure 65: Asia Pacific Autonomous Underwater Vehicles Revenue Share (%), by Import Market Analysis (Value & Volume) 2024 & 2032
                                                              66. Figure 66: Asia Pacific Autonomous Underwater Vehicles Revenue (Million), by Export Market Analysis (Value & Volume) 2024 & 2032
                                                              67. Figure 67: Asia Pacific Autonomous Underwater Vehicles Revenue Share (%), by Export Market Analysis (Value & Volume) 2024 & 2032
                                                              68. Figure 68: Asia Pacific Autonomous Underwater Vehicles Revenue (Million), by Price Trend Analysis 2024 & 2032
                                                              69. Figure 69: Asia Pacific Autonomous Underwater Vehicles Revenue Share (%), by Price Trend Analysis 2024 & 2032
                                                              70. Figure 70: Asia Pacific Autonomous Underwater Vehicles Revenue (Million), by Country 2024 & 2032
                                                              71. Figure 71: Asia Pacific Autonomous Underwater Vehicles Revenue Share (%), by Country 2024 & 2032

                                                              List of Tables

                                                              1. Table 1: Global Autonomous Underwater Vehicles Revenue Million Forecast, by Region 2019 & 2032
                                                              2. Table 2: Global Autonomous Underwater Vehicles Revenue Million Forecast, by Production Analysis 2019 & 2032
                                                              3. Table 3: Global Autonomous Underwater Vehicles Revenue Million Forecast, by Consumption Analysis 2019 & 2032
                                                              4. Table 4: Global Autonomous Underwater Vehicles Revenue Million Forecast, by Import Market Analysis (Value & Volume) 2019 & 2032
                                                              5. Table 5: Global Autonomous Underwater Vehicles Revenue Million Forecast, by Export Market Analysis (Value & Volume) 2019 & 2032
                                                              6. Table 6: Global Autonomous Underwater Vehicles Revenue Million Forecast, by Price Trend Analysis 2019 & 2032
                                                              7. Table 7: Global Autonomous Underwater Vehicles Revenue Million Forecast, by Region 2019 & 2032
                                                              8. Table 8: Global Autonomous Underwater Vehicles Revenue Million Forecast, by Country 2019 & 2032
                                                              9. Table 9: United States Autonomous Underwater Vehicles Revenue (Million) Forecast, by Application 2019 & 2032
                                                              10. Table 10: Canada Autonomous Underwater Vehicles Revenue (Million) Forecast, by Application 2019 & 2032
                                                              11. Table 11: Global Autonomous Underwater Vehicles Revenue Million Forecast, by Country 2019 & 2032
                                                              12. Table 12: United Kingdom Autonomous Underwater Vehicles Revenue (Million) Forecast, by Application 2019 & 2032
                                                              13. Table 13: France Autonomous Underwater Vehicles Revenue (Million) Forecast, by Application 2019 & 2032
                                                              14. Table 14: Germany Autonomous Underwater Vehicles Revenue (Million) Forecast, by Application 2019 & 2032
                                                              15. Table 15: Russia Autonomous Underwater Vehicles Revenue (Million) Forecast, by Application 2019 & 2032
                                                              16. Table 16: Rest of Europe Autonomous Underwater Vehicles Revenue (Million) Forecast, by Application 2019 & 2032
                                                              17. Table 17: Global Autonomous Underwater Vehicles Revenue Million Forecast, by Country 2019 & 2032
                                                              18. Table 18: India Autonomous Underwater Vehicles Revenue (Million) Forecast, by Application 2019 & 2032
                                                              19. Table 19: China Autonomous Underwater Vehicles Revenue (Million) Forecast, by Application 2019 & 2032
                                                              20. Table 20: Japan Autonomous Underwater Vehicles Revenue (Million) Forecast, by Application 2019 & 2032
                                                              21. Table 21: South Korea Autonomous Underwater Vehicles Revenue (Million) Forecast, by Application 2019 & 2032
                                                              22. Table 22: Rest of Asia Pacific Autonomous Underwater Vehicles Revenue (Million) Forecast, by Application 2019 & 2032
                                                              23. Table 23: Global Autonomous Underwater Vehicles Revenue Million Forecast, by Country 2019 & 2032
                                                              24. Table 24: Brazil Autonomous Underwater Vehicles Revenue (Million) Forecast, by Application 2019 & 2032
                                                              25. Table 25: Rest of Latin America Autonomous Underwater Vehicles Revenue (Million) Forecast, by Application 2019 & 2032
                                                              26. Table 26: Global Autonomous Underwater Vehicles Revenue Million Forecast, by Country 2019 & 2032
                                                              27. Table 27: United Arab Emirates Autonomous Underwater Vehicles Revenue (Million) Forecast, by Application 2019 & 2032
                                                              28. Table 28: Saudi Arabia Autonomous Underwater Vehicles Revenue (Million) Forecast, by Application 2019 & 2032
                                                              29. Table 29: Israel Autonomous Underwater Vehicles Revenue (Million) Forecast, by Application 2019 & 2032
                                                              30. Table 30: Rest of Middle East and Africa Autonomous Underwater Vehicles Revenue (Million) Forecast, by Application 2019 & 2032
                                                              31. Table 31: Global Autonomous Underwater Vehicles Revenue Million Forecast, by Production Analysis 2019 & 2032
                                                              32. Table 32: Global Autonomous Underwater Vehicles Revenue Million Forecast, by Consumption Analysis 2019 & 2032
                                                              33. Table 33: Global Autonomous Underwater Vehicles Revenue Million Forecast, by Import Market Analysis (Value & Volume) 2019 & 2032
                                                              34. Table 34: Global Autonomous Underwater Vehicles Revenue Million Forecast, by Export Market Analysis (Value & Volume) 2019 & 2032
                                                              35. Table 35: Global Autonomous Underwater Vehicles Revenue Million Forecast, by Price Trend Analysis 2019 & 2032
                                                              36. Table 36: Global Autonomous Underwater Vehicles Revenue Million Forecast, by Country 2019 & 2032
                                                              37. Table 37: United States Autonomous Underwater Vehicles Revenue (Million) Forecast, by Application 2019 & 2032
                                                              38. Table 38: Canada Autonomous Underwater Vehicles Revenue (Million) Forecast, by Application 2019 & 2032
                                                              39. Table 39: Mexico Autonomous Underwater Vehicles Revenue (Million) Forecast, by Application 2019 & 2032
                                                              40. Table 40: Global Autonomous Underwater Vehicles Revenue Million Forecast, by Production Analysis 2019 & 2032
                                                              41. Table 41: Global Autonomous Underwater Vehicles Revenue Million Forecast, by Consumption Analysis 2019 & 2032
                                                              42. Table 42: Global Autonomous Underwater Vehicles Revenue Million Forecast, by Import Market Analysis (Value & Volume) 2019 & 2032
                                                              43. Table 43: Global Autonomous Underwater Vehicles Revenue Million Forecast, by Export Market Analysis (Value & Volume) 2019 & 2032
                                                              44. Table 44: Global Autonomous Underwater Vehicles Revenue Million Forecast, by Price Trend Analysis 2019 & 2032
                                                              45. Table 45: Global Autonomous Underwater Vehicles Revenue Million Forecast, by Country 2019 & 2032
                                                              46. Table 46: Brazil Autonomous Underwater Vehicles Revenue (Million) Forecast, by Application 2019 & 2032
                                                              47. Table 47: Argentina Autonomous Underwater Vehicles Revenue (Million) Forecast, by Application 2019 & 2032
                                                              48. Table 48: Rest of South America Autonomous Underwater Vehicles Revenue (Million) Forecast, by Application 2019 & 2032
                                                              49. Table 49: Global Autonomous Underwater Vehicles Revenue Million Forecast, by Production Analysis 2019 & 2032
                                                              50. Table 50: Global Autonomous Underwater Vehicles Revenue Million Forecast, by Consumption Analysis 2019 & 2032
                                                              51. Table 51: Global Autonomous Underwater Vehicles Revenue Million Forecast, by Import Market Analysis (Value & Volume) 2019 & 2032
                                                              52. Table 52: Global Autonomous Underwater Vehicles Revenue Million Forecast, by Export Market Analysis (Value & Volume) 2019 & 2032
                                                              53. Table 53: Global Autonomous Underwater Vehicles Revenue Million Forecast, by Price Trend Analysis 2019 & 2032
                                                              54. Table 54: Global Autonomous Underwater Vehicles Revenue Million Forecast, by Country 2019 & 2032
                                                              55. Table 55: United Kingdom Autonomous Underwater Vehicles Revenue (Million) Forecast, by Application 2019 & 2032
                                                              56. Table 56: Germany Autonomous Underwater Vehicles Revenue (Million) Forecast, by Application 2019 & 2032
                                                              57. Table 57: France Autonomous Underwater Vehicles Revenue (Million) Forecast, by Application 2019 & 2032
                                                              58. Table 58: Italy Autonomous Underwater Vehicles Revenue (Million) Forecast, by Application 2019 & 2032
                                                              59. Table 59: Spain Autonomous Underwater Vehicles Revenue (Million) Forecast, by Application 2019 & 2032
                                                              60. Table 60: Russia Autonomous Underwater Vehicles Revenue (Million) Forecast, by Application 2019 & 2032
                                                              61. Table 61: Benelux Autonomous Underwater Vehicles Revenue (Million) Forecast, by Application 2019 & 2032
                                                              62. Table 62: Nordics Autonomous Underwater Vehicles Revenue (Million) Forecast, by Application 2019 & 2032
                                                              63. Table 63: Rest of Europe Autonomous Underwater Vehicles Revenue (Million) Forecast, by Application 2019 & 2032
                                                              64. Table 64: Global Autonomous Underwater Vehicles Revenue Million Forecast, by Production Analysis 2019 & 2032
                                                              65. Table 65: Global Autonomous Underwater Vehicles Revenue Million Forecast, by Consumption Analysis 2019 & 2032
                                                              66. Table 66: Global Autonomous Underwater Vehicles Revenue Million Forecast, by Import Market Analysis (Value & Volume) 2019 & 2032
                                                              67. Table 67: Global Autonomous Underwater Vehicles Revenue Million Forecast, by Export Market Analysis (Value & Volume) 2019 & 2032
                                                              68. Table 68: Global Autonomous Underwater Vehicles Revenue Million Forecast, by Price Trend Analysis 2019 & 2032
                                                              69. Table 69: Global Autonomous Underwater Vehicles Revenue Million Forecast, by Country 2019 & 2032
                                                              70. Table 70: Turkey Autonomous Underwater Vehicles Revenue (Million) Forecast, by Application 2019 & 2032
                                                              71. Table 71: Israel Autonomous Underwater Vehicles Revenue (Million) Forecast, by Application 2019 & 2032
                                                              72. Table 72: GCC Autonomous Underwater Vehicles Revenue (Million) Forecast, by Application 2019 & 2032
                                                              73. Table 73: North Africa Autonomous Underwater Vehicles Revenue (Million) Forecast, by Application 2019 & 2032
                                                              74. Table 74: South Africa Autonomous Underwater Vehicles Revenue (Million) Forecast, by Application 2019 & 2032
                                                              75. Table 75: Rest of Middle East & Africa Autonomous Underwater Vehicles Revenue (Million) Forecast, by Application 2019 & 2032
                                                              76. Table 76: Global Autonomous Underwater Vehicles Revenue Million Forecast, by Production Analysis 2019 & 2032
                                                              77. Table 77: Global Autonomous Underwater Vehicles Revenue Million Forecast, by Consumption Analysis 2019 & 2032
                                                              78. Table 78: Global Autonomous Underwater Vehicles Revenue Million Forecast, by Import Market Analysis (Value & Volume) 2019 & 2032
                                                              79. Table 79: Global Autonomous Underwater Vehicles Revenue Million Forecast, by Export Market Analysis (Value & Volume) 2019 & 2032
                                                              80. Table 80: Global Autonomous Underwater Vehicles Revenue Million Forecast, by Price Trend Analysis 2019 & 2032
                                                              81. Table 81: Global Autonomous Underwater Vehicles Revenue Million Forecast, by Country 2019 & 2032
                                                              82. Table 82: China Autonomous Underwater Vehicles Revenue (Million) Forecast, by Application 2019 & 2032
                                                              83. Table 83: India Autonomous Underwater Vehicles Revenue (Million) Forecast, by Application 2019 & 2032
                                                              84. Table 84: Japan Autonomous Underwater Vehicles Revenue (Million) Forecast, by Application 2019 & 2032
                                                              85. Table 85: South Korea Autonomous Underwater Vehicles Revenue (Million) Forecast, by Application 2019 & 2032
                                                              86. Table 86: ASEAN Autonomous Underwater Vehicles Revenue (Million) Forecast, by Application 2019 & 2032
                                                              87. Table 87: Oceania Autonomous Underwater Vehicles Revenue (Million) Forecast, by Application 2019 & 2032
                                                              88. Table 88: Rest of Asia Pacific Autonomous Underwater Vehicles Revenue (Million) Forecast, by Application 2019 & 2032


                                                              Frequently Asked Questions

                                                              1. What is the projected Compound Annual Growth Rate (CAGR) of the Autonomous Underwater Vehicles?

                                                              The projected CAGR is approximately 20.62%.

                                                              2. Which companies are prominent players in the Autonomous Underwater Vehicles?

                                                              Key companies in the market include L3Harris Technologies Inc, General Dynamics Corporation, Lockheed Martin Corporation, Kongsberg Gruppen ASA, Exail Technologies S, SAAB AB, BAE Systems plc, Teledyne Technologies Inc, The Boeing Company.

                                                              3. What are the main segments of the Autonomous Underwater Vehicles?

                                                              The market segments include Production Analysis, Consumption Analysis, Import Market Analysis (Value & Volume), Export Market Analysis (Value & Volume), Price Trend Analysis.

                                                              4. Can you provide details about the market size?

                                                              The market size is estimated to be USD 2.13 Million as of 2022.

                                                              5. What are some drivers contributing to market growth?

                                                              Increase in Internet of Things (IoT) and Autonomous Systems; Rise in Demand for Military and Defense Satellite Communication Solutions.

                                                              6. What are the notable trends driving market growth?

                                                              Military & Defense will a Hold Significant Market Share.

                                                              7. Are there any restraints impacting market growth?

                                                              Cybersecurity Threats to Satellite Communication; Interference in Transmission of Data.

                                                              8. Can you provide examples of recent developments in the market?

                                                              February 2024: Kongsberg was awarded a contract with the Defense Innovation Unit (DIU) to rapidly deliver HUGIN Autonomous Underwater Vehicle (AUV) capabilities for the US military.

                                                              9. What pricing options are available for accessing the report?

                                                              Pricing options include single-user, multi-user, and enterprise licenses priced at USD 4750, USD 5250, and USD 8750 respectively.

                                                              10. Is the market size provided in terms of value or volume?

                                                              The market size is provided in terms of value, measured in Million.

                                                              11. Are there any specific market keywords associated with the report?

                                                              Yes, the market keyword associated with the report is "Autonomous Underwater Vehicles," which aids in identifying and referencing the specific market segment covered.

                                                              12. How do I determine which pricing option suits my needs best?

                                                              The pricing options vary based on user requirements and access needs. Individual users may opt for single-user licenses, while businesses requiring broader access may choose multi-user or enterprise licenses for cost-effective access to the report.

                                                              13. Are there any additional resources or data provided in the Autonomous Underwater Vehicles report?

                                                              While the report offers comprehensive insights, it's advisable to review the specific contents or supplementary materials provided to ascertain if additional resources or data are available.

                                                              14. How can I stay updated on further developments or reports in the Autonomous Underwater Vehicles?

                                                              To stay informed about further developments, trends, and reports in the Autonomous Underwater Vehicles, consider subscribing to industry newsletters, following relevant companies and organizations, or regularly checking reputable industry news sources and publications.


                                                              Methodology

                                                              Step 1 - Identification of Relevant Samples Size from Population Database

                                                              Step Chart
                                                              Bar Chart
                                                              Method Chart

                                                              Step 2 - Approaches for Defining Global Market Size (Value, Volume* & Price*)

                                                              Approach Chart
                                                              Top-down and bottom-up approaches are used to validate the global market size and estimate the market size for manufactures, regional segments, product, and application.

                                                              Note*: In applicable scenarios

                                                              Step 3 - Data Sources

                                                              Primary Research

                                                              • Web Analytics
                                                              • Survey Reports
                                                              • Research Institute
                                                              • Latest Research Reports
                                                              • Opinion Leaders

                                                              Secondary Research

                                                              • Annual Reports
                                                              • White Paper
                                                              • Latest Press Release
                                                              • Industry Association
                                                              • Paid Database
                                                              • Investor Presentations
                                                              Analyst Chart

                                                              Step 4 - Data Triangulation

                                                              Involves using different sources of information in order to increase the validity of a study

                                                              These sources are likely to be stakeholders in a program - participants, other researchers, program staff, other community members, and so on.

                                                              Then we put all data in single framework & apply various statistical tools to find out the dynamic on the market.

                                                              During the analysis stage, feedback from the stakeholder groups would be compared to determine areas of agreement as well as areas of divergence

                                                              Additionally, after gathering mixed and scattered data from a wide range of sources, data is triangulated and correlated to come up with estimated figures which are further validated through primary mediums or industry experts, opinion leaders.

                                                              About Visionary Data Reports

                                                              Visionary Data Reports provides future-focused market research, advanced analytics, and strategic insights for technology, healthcare, green energy, and finance. Our reports help you anticipate trends, innovate, and lead in your industry. Our expert team combines primary research, data science, and industry knowledge to deliver actionable intelligence. We offer syndicated reports, custom analytics, and consulting services tailored to your business needs. At Visionary Data Reports, we are committed to quality, transparency, and client satisfaction. Every report is rigorously validated to ensure accuracy and relevance. Our global perspective and forward-thinking approach help you understand both current and emerging market dynamics.

                                                              Stay ahead with Visionary Data Reports. Subscribe to our newsletter for the latest insights and research highlights, and follow us on social media for real-time updates. Visionary Data Reports – Your Guide to Tomorrow’s Opportunities.

                                                              artwork spiralartwork spiralRelated Reports
                                                              artwork underline

                                                              Military Aircraft Collision Avoidance Systems Market in North America: Market Dynamics and Forecasts 2025-2033

                                                              The Military Aircraft Collision Avoidance Systems (MACAS) market is booming, projected to surpass $3.4 billion by 2033 with a CAGR exceeding 4%. Driven by advanced technologies like TCAS, TAWS, and SVS, this market offers lucrative opportunities for key players like L3Harris and Honeywell. Explore market trends, regional insights, and key segments in this detailed analysis.

                                                              July 2025
                                                              Base Year: 2024
                                                              No Of Pages: 234
                                                              Price: $4750

                                                              Charting Rocket Propulsion Market Growth: CAGR Projections for 2025-2033

                                                              The Rocket Propulsion Market is booming, projected to reach \$XX Billion by 2033 with a CAGR exceeding 8.5%! Explore market trends, key players (SpaceX, Blue Origin, etc.), segment analysis (solid, liquid, hybrid), and regional insights in this comprehensive report. Discover investment opportunities in this dynamic industry.

                                                              July 2025
                                                              Base Year: 2024
                                                              No Of Pages: 234
                                                              Price: $4750

                                                              Strategic Insights into Maritime Security Market Market Trends

                                                              The global maritime security market is experiencing steady growth driven by heightened security concerns and technological advancements. Explore market size, trends, key players (BAE Systems, Saab, Honeywell), and regional insights for the period 2019-2033. Discover the future of maritime surveillance and security.

                                                              July 2025
                                                              Base Year: 2024
                                                              No Of Pages: 197
                                                              Price: $3800

                                                              Military Aircraft Digital Glass Cockpit Systems Market Insights: Growth at XX CAGR Through 2033

                                                              The Military Aircraft Digital Glass Cockpit Systems market is booming, exceeding a 3% CAGR. Explore key drivers, trends, and restraints shaping this sector, including leading companies like L3Harris and Honeywell. Discover regional market shares and future growth projections through 2033.

                                                              July 2025
                                                              Base Year: 2024
                                                              No Of Pages: 234
                                                              Price: $4750

                                                              North America Commercial Aircraft In-Flight Entertainment System Market 2025-2033 Overview: Trends, Competitor Dynamics, and Opportunities

                                                              The North America Commercial Aircraft In-Flight Entertainment System market is booming, with a 7.11% CAGR. Discover key trends, market size projections (2025-2033), leading companies (Thales, Panasonic), and regional breakdowns. Learn how advanced connectivity and personalized content are shaping passenger experience.

                                                              July 2025
                                                              Base Year: 2024
                                                              No Of Pages: 197
                                                              Price: $3800

                                                              Satellite Payload Market’s Role in Shaping Industry Trends 2025-2033

                                                              The global satellite payload market is booming, projected to reach $31.4 billion by 2033 with an 8.54% CAGR. Driven by increased demand for communication, navigation, and surveillance, this report analyzes market segments (GEO, MEO, LEO, commercial, military), key players (SpaceX, Lockheed Martin, Airbus), and regional growth. Discover key trends and investment opportunities in this rapidly expanding sector.

                                                              July 2025
                                                              Base Year: 2024
                                                              No Of Pages: 234
                                                              Price: $4750

                                                              Passenger Emergency Oxygen Deployment Systems Market Market Demand Dynamics: Insights 2025-2033

                                                              The Passenger Emergency Oxygen Deployment Systems market is booming, projected to reach $3.24 billion by 2033 with a 7.42% CAGR. Driven by safety regulations and air travel growth, this market analysis reveals key trends, regional insights, and leading companies like Safran and RTX Corporation. Explore market segmentation, growth drivers, and competitive landscape.

                                                              July 2025
                                                              Base Year: 2024
                                                              No Of Pages: 234
                                                              Price: $4750

                                                              Regional Growth Projections for C5ISR Industry Industry

                                                              The C5ISR market is booming, driven by geopolitical tensions and technological advancements. This analysis reveals key market trends, growth projections, regional breakdowns, and leading companies in the industry, providing insights for investors and stakeholders. Explore the future of command, control, communications, computers, intelligence, surveillance, and reconnaissance.

                                                              July 2025
                                                              Base Year: 2024
                                                              No Of Pages: 234
                                                              Price: $4750

                                                              Europe Inflight Systems Market Growth Opportunities and Market Forecast 2025-2033: A Strategic Analysis

                                                              The European Inflight Systems Market is booming, projected to reach €242.5 million by 2033 with a CAGR of 2.67%. Discover key trends, growth drivers, and leading companies shaping the future of in-flight entertainment and connectivity in Europe. Explore market segmentation by class, country, and product type.

                                                              July 2025
                                                              Base Year: 2024
                                                              No Of Pages: 197
                                                              Price: $3800

                                                              Ammunition Market in NATO Market’s Decade-Long Growth Trends and Future Projections 2025-2033

                                                              The NATO Ammunition Market is booming, projected to reach over $12 billion by 2033, fueled by geopolitical tensions and defense modernization. Explore market trends, key players (RUAG, Rheinmetall, General Dynamics), and regional insights in this comprehensive analysis. Discover growth opportunities in precision-guided munitions and smart ammunition.

                                                              July 2025
                                                              Base Year: 2024
                                                              No Of Pages: 234
                                                              Price: $4750

                                                              Smart Textiles For Military Market Market’s Consumer Insights and Trends

                                                              Discover the explosive growth of the Smart Textiles for Military market, projected at a 15.37% CAGR. This in-depth analysis explores key drivers, trends, and challenges, including applications in camouflage, health monitoring, and energy harvesting. Learn about leading companies and regional market shares for strategic insights.

                                                              July 2025
                                                              Base Year: 2024
                                                              No Of Pages: 234
                                                              Price: $4750

                                                              Strategic Vision for Japan Defense Market Industry Trends

                                                              The Japan Defense Market is booming, projected to reach ¥62.65 billion by 2033 with a 3.4% CAGR. This in-depth analysis covers market size, key players (Thales, Lockheed Martin, Mitsubishi Heavy Industries), regional trends (Kanto, Kansai), and growth drivers. Discover the latest insights into Japan's defense spending and technological advancements.

                                                              July 2025
                                                              Base Year: 2024
                                                              No Of Pages: 197
                                                              Price: $3800

                                                              Exploring Consumer Shifts in GCC Aircraft MRO Industry Market 2025-2033

                                                              The GCC Aircraft MRO market is booming, projected to reach $3.25B in 2025 with a 14.46% CAGR. Discover key drivers, trends, and challenges shaping this lucrative industry, including insights into major players and regional market shares in the UAE, Saudi Arabia, and beyond. Explore the future of aircraft maintenance, repair, and overhaul in the Middle East.

                                                              July 2025
                                                              Base Year: 2024
                                                              No Of Pages: 197
                                                              Price: $3800

                                                              Understanding Growth Challenges in MEA Airport Passenger Screening Systems Industry Market 2025-2033

                                                              The MEA Airport Passenger Screening Systems market is booming, projected to reach [estimated 2033 value based on CAGR from chart data] by 2033. Driven by rising passenger numbers and enhanced security needs, this report analyzes market size, growth, key players (Vanderlande, Leidos, Garrett), and regional trends in Saudi Arabia, UAE, Qatar, and more. Discover the latest insights on advanced imaging technology, full-body scanners, and metal detectors in airport security.

                                                              July 2025
                                                              Base Year: 2024
                                                              No Of Pages: 234
                                                              Price: $4750

                                                              Asia-Pacific Commercial Aircraft Cabin Seating Market Decoded: Comprehensive Analysis and Forecasts 2025-2033

                                                              The Asia-Pacific commercial aircraft cabin seating market is booming, with a 7.32% CAGR. Discover key drivers, trends, and restraints impacting this dynamic sector, including insights into leading companies, regional market share, and future growth projections to 2033. Learn about the impact of narrowbody vs. widebody aircraft and the role of countries like China and India.

                                                              July 2025
                                                              Base Year: 2024
                                                              No Of Pages: 197
                                                              Price: $3800

                                                              Air-based Remote Weapon Stations Market Future Pathways: Strategic Insights to 2033

                                                              The Air-based Remote Weapon Stations market is booming, projected to reach $3.72 billion by 2025 with a 7.32% CAGR. Explore market trends, key players (General Dynamics, Elbit Systems), and segment analysis (aircraft, UAVs) in this comprehensive report. Discover growth drivers, restraints, and future projections to 2033.

                                                              July 2025
                                                              Base Year: 2024
                                                              No Of Pages: 234
                                                              Price: $4750

                                                              MEA Military Aviation Market Soars to XXX Million, witnessing a CAGR of XX during the forecast period 2025-2033

                                                              The MEA Military Aviation Market is booming, projected to reach $XX million by 2033 with a 3.83% CAGR. Discover key drivers, restraints, and regional breakdowns impacting this dynamic sector, including insights into major players like Boeing, Lockheed Martin, and Turkish Aerospace Industries. Explore market trends and forecasts for fixed-wing aircraft and leading MEA nations.

                                                              July 2025
                                                              Base Year: 2024
                                                              No Of Pages: 197
                                                              Price: $3800

                                                              Aircraft Heat Exchanger Market Market’s Consumer Preferences: Trends and Analysis 2025-2033

                                                              The Aircraft Heat Exchanger market is booming, projected to reach $3.75 billion by 2033 with a 9.53% CAGR. This report analyzes market size, growth drivers (fuel efficiency, UAV growth), restraints, segmentation (Plate-Fin, Flat Tube, Fixed-Wing, Rotary-Wing, UAVs), key players (Honeywell, Safran, AMETEK), and regional trends. Discover key insights and future market projections.

                                                              July 2025
                                                              Base Year: 2024
                                                              No Of Pages: 234
                                                              Price: $4750

                                                              Asia-Pacific Smart Airport Market Market Expansion: Growth Outlook 2025-2033

                                                              The Asia-Pacific smart airport market is booming, projected to reach \$451.05 million by 2025 with a 14.26% CAGR. Discover key drivers, trends, and restraints shaping this dynamic sector, including leading companies like Amadeus and Honeywell. Explore regional market share and growth projections for China, Japan, India, and more.

                                                              July 2025
                                                              Base Year: 2024
                                                              No Of Pages: 234
                                                              Price: $4750

                                                              Taiwan Defense Market Planning for the Future: Key Trends 2025-2033

                                                              Discover the booming Taiwan defense market, projected to reach $9.4 billion by 2033 with a 3.94% CAGR. This analysis explores key drivers, trends, and major players shaping this dynamic sector, including UAVs, AI, and indigenous defense production. Learn more about investment opportunities and market forecasts.

                                                              July 2025
                                                              Base Year: 2024
                                                              No Of Pages: 197
                                                              Price: $3800

                                                              Business Address

                                                              Head Office

                                                              Office no. A 5010, fifth floor, Solitaire Business Hub, Near Phoenix mall, Pune, Maharashtra 411014

                                                              Contact Information

                                                              Craig Francis

                                                              Business Development Head

                                                              +17162654855

                                                              [email protected]

                                                              Connect With Us

                                                              Secure Payment Partners

                                                              payment image
                                                              RetailLogisticsPackagingAutomotiveHealthcareAgricultureEnergy & PowerFood & BeverageAerospace & DefenseChemicals & MaterialsHospitality and TourismAnimal Nutrition & WellnessConsumer Goods and ServicesReal Estate and ConstructionHome and Property ImprovementTechnology, Media and TelecomManufacturing Products and ServicesFinancial Services and Investment Intelligence

                                                              © 2025 All rights reserved


                                                              Privacy Policy
                                                              Terms and Conditions
                                                              FAQ
                                                              • Home
                                                              • About Us
                                                              • Industries
                                                                • Aerospace & Defense
                                                                • Agriculture
                                                                • Animal Nutrition & Wellness
                                                                • Automotive
                                                                • Chemicals & Materials
                                                                • Consumer Goods and Services
                                                                • Energy & Power
                                                                • Financial Services and Investment Intelligence
                                                                • Food & Beverage
                                                                • Home and Property Improvement
                                                                • Hospitality and Tourism
                                                                • Logistics
                                                                • Manufacturing Products and Services
                                                                • Packaging
                                                                • Professional and Commercial Services
                                                                • Real Estate and Construction
                                                                • Retail
                                                                • Technology, Media and Telecom
                                                                • Healthcare
                                                              • Services
                                                              • Contact
                                                              Main Logo
                                                              • Home
                                                              • About Us
                                                              • Industries
                                                                • Aerospace & Defense
                                                                • Agriculture
                                                                • Animal Nutrition & Wellness
                                                                • Automotive
                                                                • Chemicals & Materials
                                                                • Consumer Goods and Services
                                                                • Energy & Power
                                                                • Financial Services and Investment Intelligence
                                                                • Food & Beverage
                                                                • Home and Property Improvement
                                                                • Hospitality and Tourism
                                                                • Logistics
                                                                • Manufacturing Products and Services
                                                                • Packaging
                                                                • Professional and Commercial Services
                                                                • Real Estate and Construction
                                                                • Retail
                                                                • Technology, Media and Telecom
                                                                • Healthcare
                                                              • Services
                                                              • Contact
                                                              +17162654855
                                                              [email protected]

                                                              +17162654855

                                                              [email protected]