

Key Insights
The automotive glass fiber composites market is projected for significant growth, propelled by the increasing adoption of lightweight vehicles designed to enhance fuel efficiency and reduce emissions. With a projected compound annual growth rate (CAGR) of 14.5%, the market is expected to reach $11.1 billion by 2025. Key growth drivers include the automotive industry's relentless pursuit of lightweighting to meet stringent fuel economy regulations and the accelerating integration of electric vehicles (EVs), where reduced weight directly extends battery range. The versatility of glass fiber composites across interior, exterior, structural, and powertrain applications underpins the market's broad potential. Leading entities such as Solvay Group, Asahi Fiber Glass, and Owens Corning are actively investing in R&D to optimize material performance and cost-effectiveness. Segment analysis indicates that long fiber thermoplastic (LFT) and continuous fiber thermoplastic (CFT) composites are anticipated to lead growth due to their superior mechanical properties and design flexibility, particularly for structural applications. Potential restraints include higher production costs compared to traditional materials and the requirement for specialized manufacturing processes. The Asia Pacific region, led by China and India, is expected to be the dominant market owing to its rapidly expanding automotive sector and manufacturing capabilities.
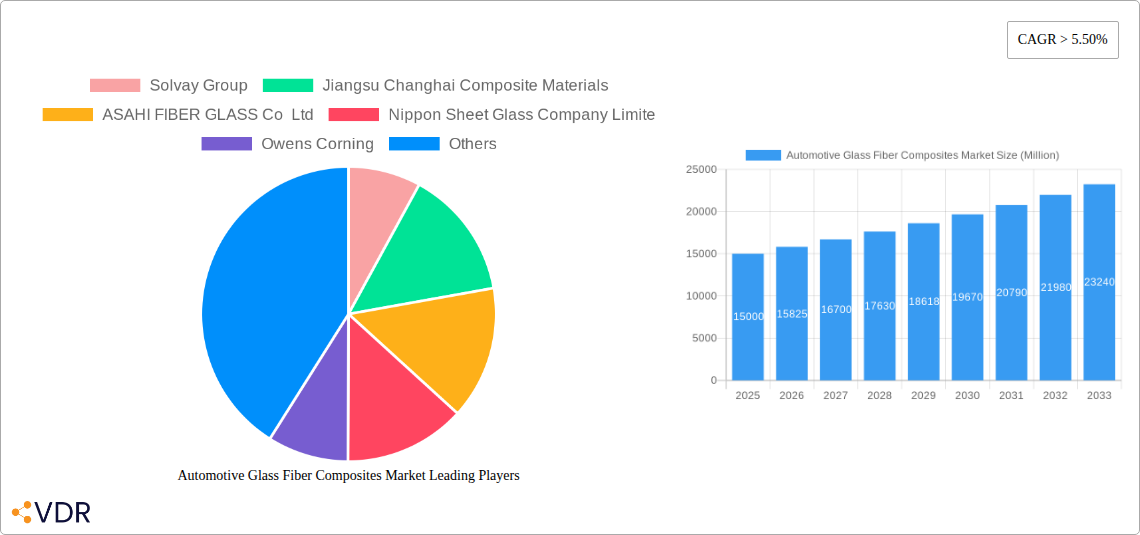
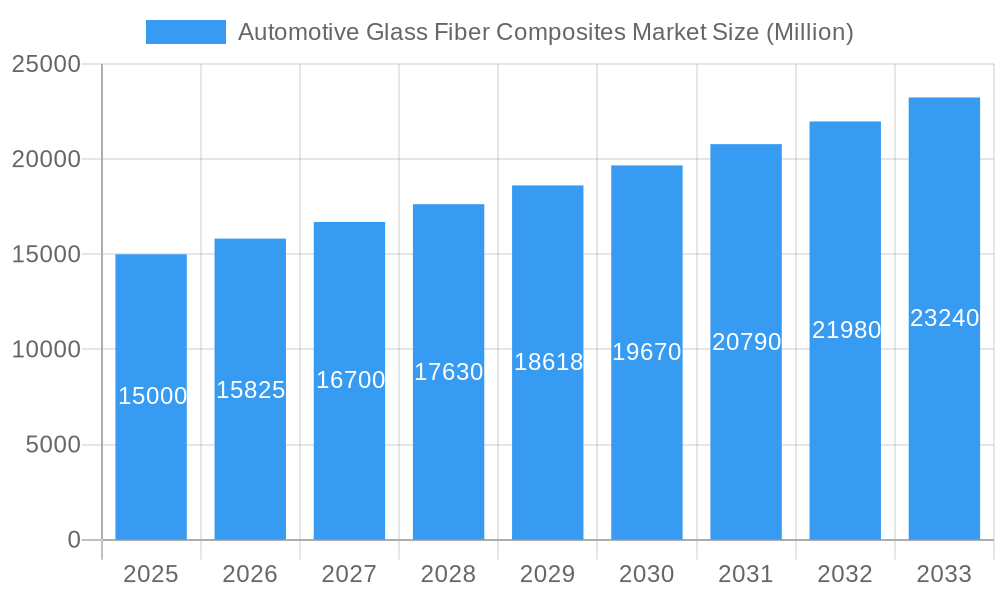
Automotive Glass Fiber Composites Market Market Size (In Billion)
Looking ahead, the automotive glass fiber composites market is set for sustained expansion through 2033, driven by the evolving landscape of electric and autonomous vehicles demanding advanced, high-performance materials. Innovations in material science, including hybrid composites, are poised to unlock novel applications and further stimulate market growth. While initial investment in manufacturing infrastructure and specialized equipment remains a considerable barrier, the long-term benefits of reduced fuel consumption, enhanced safety, and superior vehicle performance will drive widespread adoption. Regional expansion into emerging markets and strategic collaborations between automotive manufacturers and composite suppliers will shape future market dynamics. Growing emphasis on sustainability and the recyclability of certain glass fiber composites further enhance their appeal. Consequently, the automotive glass fiber composites market exhibits a positive trajectory with sustained growth anticipated throughout the forecast period.
Automotive Glass Fiber Composites Market Company Market Share
Automotive Glass Fiber Composites Market: A Comprehensive Report (2019-2033)
This comprehensive report provides a detailed analysis of the Automotive Glass Fiber Composites market, encompassing market dynamics, growth trends, regional segmentation, product landscape, key players, and future outlook. The report covers the period from 2019 to 2033, with 2025 as the base year and forecast period extending to 2033. The market is segmented by intermediate type (Short Fiber Thermoplastic (SFT), Long Fiber Thermoplastic (LFT), Continuous Fiber Thermoplastic (CFT), Other Intermediate Types) and application (Interiors, Exteriors, Structural Assembly, Power-train Components, Others). Key players analyzed include Solvay Group, Jiangsu Changhai Composite Materials, ASAHI FIBER GLASS Co Ltd, Nippon Sheet Glass Company Limited, Owens Corning, 3B (Braj Binani Group), Veplas Group, and SAERTEX GmbH & Co KG. The total market size is projected to reach xx million units by 2033.
Automotive Glass Fiber Composites Market Dynamics & Structure
The automotive glass fiber composites market is characterized by moderate concentration, with a few large players dominating alongside numerous smaller specialized firms. Technological innovation, driven by the need for lighter, stronger, and more fuel-efficient vehicles, is a key driver. Stringent regulatory frameworks concerning emissions and fuel economy further propel market growth. Competitive substitutes include other composite materials and traditional metals, but glass fiber composites maintain a strong position due to their cost-effectiveness and performance characteristics. The end-user demographic is primarily automotive manufacturers (OEMs) and Tier-1 suppliers, with a growing influence from the electric vehicle (EV) segment. Mergers and acquisitions (M&A) activity has been moderate, focused on strengthening supply chains and expanding geographical reach.
- Market Concentration: Moderately concentrated, with top 5 players holding approximately xx% market share in 2025.
- Technological Innovation: Focus on enhancing fiber strength, developing new resin systems, and improving manufacturing processes (e.g., automated fiber placement).
- Regulatory Framework: Stringent fuel efficiency and emission standards driving demand for lightweight materials.
- Competitive Substitutes: Metals (steel, aluminum), carbon fiber composites, and other polymer-based composites.
- End-User Demographics: Primarily automotive OEMs and Tier-1 suppliers, with increasing demand from the EV sector.
- M&A Trends: Strategic acquisitions to consolidate market share, expand product portfolios, and secure access to key technologies. Approx. xx M&A deals in the last 5 years.
Automotive Glass Fiber Composites Market Growth Trends & Insights
The automotive glass fiber composites market has experienced steady growth over the historical period (2019-2024), driven by increasing demand for lightweight vehicles, stringent fuel efficiency regulations, and the rising adoption of composites in automotive applications. The market size is expected to grow at a Compound Annual Growth Rate (CAGR) of xx% during the forecast period (2025-2033), reaching xx million units by 2033. This growth is fueled by the ongoing shift towards electric vehicles, which require lightweight materials to extend battery range and improve performance. Technological advancements, such as the development of high-strength fibers and improved resin systems, are also contributing to market expansion. Consumer preference for fuel-efficient and environmentally friendly vehicles further strengthens this trend. Market penetration of glass fiber composites in various automotive applications continues to increase, particularly in body panels, interior components, and structural parts.
Dominant Regions, Countries, or Segments in Automotive Glass Fiber Composites Market
The Asia-Pacific region is currently the dominant market for automotive glass fiber composites, driven by the robust growth of the automotive industry in countries like China, Japan, and India. This region benefits from a well-established manufacturing base, supportive government policies promoting the adoption of lightweight materials, and the increasing production of electric vehicles. Within the segments, the Short Fiber Thermoplastic (SFT) segment holds the largest market share due to its cost-effectiveness and ease of processing. The exterior application segment also shows significant growth potential, driven by the increasing use of composites in body panels and other exterior components.
- Key Drivers (Asia-Pacific): High automotive production volume, supportive government policies, significant investments in EV manufacturing, and a large and growing middle class.
- Dominance Factors: Established manufacturing base, cost-competitive labor, and proximity to major automotive markets.
- Growth Potential: Continued expansion of the automotive industry, particularly in the electric vehicle sector, and increasing adoption of composites in new vehicle architectures.
- SFT Segment Dominance: Cost-effectiveness, ease of processing, and suitability for a wide range of applications.
- Exterior Application Growth: Demand for lightweight and aesthetically pleasing exterior components.
Automotive Glass Fiber Composites Market Product Landscape
Product innovation focuses on improving the mechanical properties, durability, and processability of glass fiber composites. New resin systems are being developed to enhance adhesion, reduce weight, and improve recyclability. Applications continue to expand beyond traditional uses, with increased adoption in structural components, powertrain systems, and battery enclosures. Key performance metrics include tensile strength, flexural modulus, impact resistance, and thermal stability. Unique selling propositions include high strength-to-weight ratios, design flexibility, and cost-effectiveness compared to alternative materials.
Key Drivers, Barriers & Challenges in Automotive Glass Fiber Composites Market
Key Drivers:
- Growing demand for lightweight vehicles to improve fuel efficiency and reduce emissions.
- Increasing adoption of electric vehicles, which benefit from the lightweight nature of composites.
- Stringent government regulations promoting the use of lightweight materials.
- Advancements in material science and manufacturing technologies.
Key Challenges and Restraints:
- Fluctuations in raw material prices (e.g., glass fiber and resin) can impact profitability.
- Recyclability and end-of-life management of composites remain a concern.
- Competition from alternative materials (e.g., carbon fiber and aluminum) poses a challenge.
- The complexity of composite manufacturing processes can increase costs and lead times. Approximately xx% of manufacturers face challenges in scaling up production to meet demand.
Emerging Opportunities in Automotive Glass Fiber Composites Market
- Expansion into new applications, such as battery enclosures and hydrogen fuel cell components.
- Development of sustainable and recyclable composites to address environmental concerns.
- Growth in the use of advanced manufacturing techniques (e.g., automated fiber placement) to improve efficiency and reduce costs.
- Increasing demand for lightweight materials in commercial vehicles and other transportation sectors.
Growth Accelerators in the Automotive Glass Fiber Composites Market Industry
Technological breakthroughs, such as the development of high-performance fibers and advanced resin systems, are key growth catalysts. Strategic partnerships between material suppliers, automotive manufacturers, and technology providers are driving innovation and accelerating market penetration. Market expansion strategies, including investments in new manufacturing facilities and expansion into emerging markets, are also contributing to growth.
Key Players Shaping the Automotive Glass Fiber Composites Market Market
- Solvay Group
- Jiangsu Changhai Composite Materials
- ASAHI FIBER GLASS Co Ltd
- Nippon Sheet Glass Company Limited
- Owens Corning
- 3B (Braj Binani Group)
- Veplas Group
- SAERTEX GmbH & Co KG
Notable Milestones in Automotive Glass Fiber Composites Market Sector
- November 2022: Solvay and Orbia announce a joint venture to produce battery materials, representing a significant investment in the North American market. This signals growing demand for composites in the EV battery supply chain.
- October 2022: Solvay launches SolvaLite SF200 surfacing film, expanding its product portfolio for high-end automotive applications. This enhances the aesthetic appeal and performance of composite body panels.
- February 2022: Teijin Automotive Technologies expands its manufacturing capacity in China, highlighting the strong growth potential of the Asian market and growing demand for automotive composites, particularly in the rapidly expanding EV segment.
In-Depth Automotive Glass Fiber Composites Market Market Outlook
The future of the automotive glass fiber composites market is bright, with continued growth driven by the long-term trends towards lightweighting, sustainability, and the electrification of the automotive industry. Strategic partnerships, technological advancements, and expansion into new applications will play a crucial role in shaping the market's future. The market is poised for significant expansion, particularly in regions with growing automotive production and supportive government policies. The focus on developing sustainable and recyclable composites will also contribute to long-term growth and market acceptance.
Automotive Glass Fiber Composites Market Segmentation
-
1. Intermediate Type
- 1.1. Short Fiber Thermoplastic (SFT)
- 1.2. Long Fiber Thermoplastic (LFT)
- 1.3. Continuous Fiber Thermoplastic (CFT)
- 1.4. Other Intermediate Types
-
2. Application
- 2.1. Interiors
- 2.2. Exteriors
- 2.3. Structural Assembly
- 2.4. Power-train Components
- 2.5. Others
Automotive Glass Fiber Composites Market Segmentation By Geography
-
1. North America
- 1.1. United States
- 1.2. Canada
- 1.3. Rest of North America
-
2. Europe
- 2.1. Germany
- 2.2. United Kingdom
- 2.3. France
- 2.4. Rest of Europe
-
3. Asia Pacific
- 3.1. China
- 3.2. Japan
- 3.3. India
- 3.4. Rest of Asia Pacific
-
4. South America
- 4.1. Brazil
- 4.2. Rest of South America
-
5. Middle East and Africa
- 5.1. United Arab Emirates
- 5.2. South Africa
- 5.3. Rest of Middle East and Africa
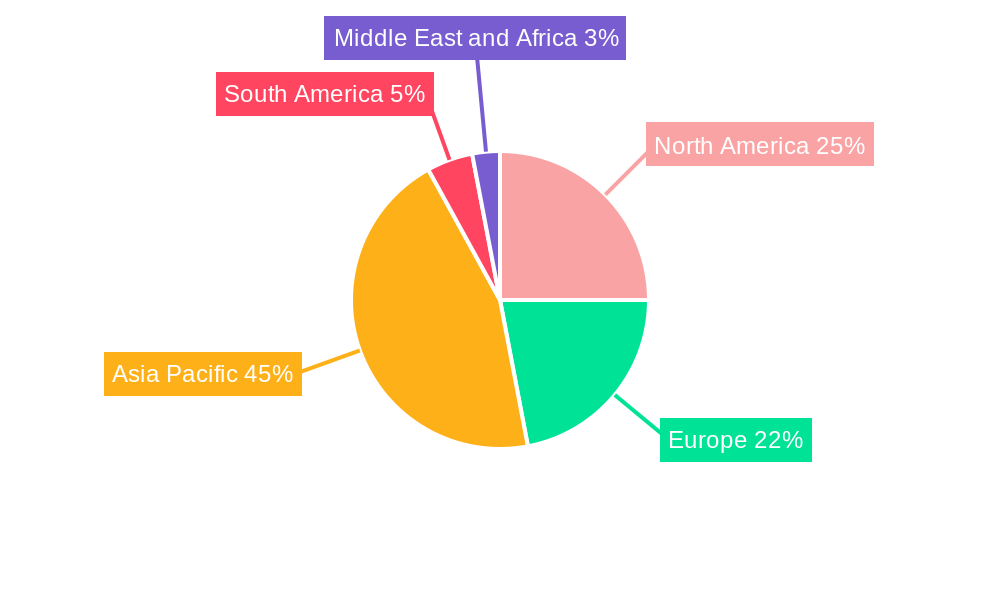
Automotive Glass Fiber Composites Market Regional Market Share
Geographic Coverage of Automotive Glass Fiber Composites Market
Automotive Glass Fiber Composites Market REPORT HIGHLIGHTS
| Aspects | Details |
|---|---|
| Study Period | 2020-2034 |
| Base Year | 2025 |
| Estimated Year | 2026 |
| Forecast Period | 2026-2034 |
| Historical Period | 2020-2025 |
| Growth Rate | CAGR of 14.5% from 2020-2034 |
| Segmentation |
|
Table of Contents
- 1. Introduction
- 1.1. Research Scope
- 1.2. Market Segmentation
- 1.3. Research Objective
- 1.4. Definitions and Assumptions
- 2. Executive Summary
- 2.1. Market Snapshot
- 3. Market Dynamics
- 3.1. Market Drivers
- 3.2. Market Restrains
- 3.3. Market Trends
- 3.4. Market Opportunities
- 4. Market Factor Analysis
- 4.1. Porters Five Forces
- 4.1.1. Bargaining Power of Suppliers
- 4.1.2. Bargaining Power of Buyers
- 4.1.3. Threat of New Entrants
- 4.1.4. Threat of Substitutes
- 4.1.5. Competitive Rivalry
- 4.2. PESTEL analysis
- 4.3. BCG Analysis
- 4.3.1. Stars (High Growth, High Market Share)
- 4.3.2. Cash Cows (Low Growth, High Market Share)
- 4.3.3. Question Mark (High Growth, Low Market Share)
- 4.3.4. Dogs (Low Growth, Low Market Share)
- 4.4. Ansoff Matrix Analysis
- 4.5. Supply Chain Analysis
- 4.6. Regulatory Landscape
- 4.7. Current Market Potential and Opportunity Assessment (TAM–SAM–SOM Framework)
- 4.8. VDR Analyst Note
- 4.1. Porters Five Forces
- 5. Market Analysis, Insights and Forecast 2021-2033
- 5.1. Market Analysis, Insights and Forecast - by Intermediate Type
- 5.1.1. Short Fiber Thermoplastic (SFT)
- 5.1.2. Long Fiber Thermoplastic (LFT)
- 5.1.3. Continuous Fiber Thermoplastic (CFT)
- 5.1.4. Other Intermediate Types
- 5.2. Market Analysis, Insights and Forecast - by Application
- 5.2.1. Interiors
- 5.2.2. Exteriors
- 5.2.3. Structural Assembly
- 5.2.4. Power-train Components
- 5.2.5. Others
- 5.3. Market Analysis, Insights and Forecast - by Region
- 5.3.1. North America
- 5.3.2. Europe
- 5.3.3. Asia Pacific
- 5.3.4. South America
- 5.3.5. Middle East and Africa
- 5.1. Market Analysis, Insights and Forecast - by Intermediate Type
- 6. Global Automotive Glass Fiber Composites Market Analysis, Insights and Forecast, 2021-2033
- 6.1. Market Analysis, Insights and Forecast - by Intermediate Type
- 6.1.1. Short Fiber Thermoplastic (SFT)
- 6.1.2. Long Fiber Thermoplastic (LFT)
- 6.1.3. Continuous Fiber Thermoplastic (CFT)
- 6.1.4. Other Intermediate Types
- 6.2. Market Analysis, Insights and Forecast - by Application
- 6.2.1. Interiors
- 6.2.2. Exteriors
- 6.2.3. Structural Assembly
- 6.2.4. Power-train Components
- 6.2.5. Others
- 6.1. Market Analysis, Insights and Forecast - by Intermediate Type
- 7. North America Automotive Glass Fiber Composites Market Analysis, Insights and Forecast, 2021-2033
- 7.1. Market Analysis, Insights and Forecast - by Intermediate Type
- 7.1.1. Short Fiber Thermoplastic (SFT)
- 7.1.2. Long Fiber Thermoplastic (LFT)
- 7.1.3. Continuous Fiber Thermoplastic (CFT)
- 7.1.4. Other Intermediate Types
- 7.2. Market Analysis, Insights and Forecast - by Application
- 7.2.1. Interiors
- 7.2.2. Exteriors
- 7.2.3. Structural Assembly
- 7.2.4. Power-train Components
- 7.2.5. Others
- 7.1. Market Analysis, Insights and Forecast - by Intermediate Type
- 8. Europe Automotive Glass Fiber Composites Market Analysis, Insights and Forecast, 2021-2033
- 8.1. Market Analysis, Insights and Forecast - by Intermediate Type
- 8.1.1. Short Fiber Thermoplastic (SFT)
- 8.1.2. Long Fiber Thermoplastic (LFT)
- 8.1.3. Continuous Fiber Thermoplastic (CFT)
- 8.1.4. Other Intermediate Types
- 8.2. Market Analysis, Insights and Forecast - by Application
- 8.2.1. Interiors
- 8.2.2. Exteriors
- 8.2.3. Structural Assembly
- 8.2.4. Power-train Components
- 8.2.5. Others
- 8.1. Market Analysis, Insights and Forecast - by Intermediate Type
- 9. Asia Pacific Automotive Glass Fiber Composites Market Analysis, Insights and Forecast, 2021-2033
- 9.1. Market Analysis, Insights and Forecast - by Intermediate Type
- 9.1.1. Short Fiber Thermoplastic (SFT)
- 9.1.2. Long Fiber Thermoplastic (LFT)
- 9.1.3. Continuous Fiber Thermoplastic (CFT)
- 9.1.4. Other Intermediate Types
- 9.2. Market Analysis, Insights and Forecast - by Application
- 9.2.1. Interiors
- 9.2.2. Exteriors
- 9.2.3. Structural Assembly
- 9.2.4. Power-train Components
- 9.2.5. Others
- 9.1. Market Analysis, Insights and Forecast - by Intermediate Type
- 10. South America Automotive Glass Fiber Composites Market Analysis, Insights and Forecast, 2021-2033
- 10.1. Market Analysis, Insights and Forecast - by Intermediate Type
- 10.1.1. Short Fiber Thermoplastic (SFT)
- 10.1.2. Long Fiber Thermoplastic (LFT)
- 10.1.3. Continuous Fiber Thermoplastic (CFT)
- 10.1.4. Other Intermediate Types
- 10.2. Market Analysis, Insights and Forecast - by Application
- 10.2.1. Interiors
- 10.2.2. Exteriors
- 10.2.3. Structural Assembly
- 10.2.4. Power-train Components
- 10.2.5. Others
- 10.1. Market Analysis, Insights and Forecast - by Intermediate Type
- 11. Middle East and Africa Automotive Glass Fiber Composites Market Analysis, Insights and Forecast, 2021-2033
- 11.1. Market Analysis, Insights and Forecast - by Intermediate Type
- 11.1.1. Short Fiber Thermoplastic (SFT)
- 11.1.2. Long Fiber Thermoplastic (LFT)
- 11.1.3. Continuous Fiber Thermoplastic (CFT)
- 11.1.4. Other Intermediate Types
- 11.2. Market Analysis, Insights and Forecast - by Application
- 11.2.1. Interiors
- 11.2.2. Exteriors
- 11.2.3. Structural Assembly
- 11.2.4. Power-train Components
- 11.2.5. Others
- 11.1. Market Analysis, Insights and Forecast - by Intermediate Type
- 12. Competitive Analysis
- 12.1. Company Profiles
- 12.1.1 Solvay Group
- 12.1.1.1. Company Overview
- 12.1.1.2. Products
- 12.1.1.3. Company Financials
- 12.1.1.4. SWOT Analysis
- 12.1.2 Jiangsu Changhai Composite Materials
- 12.1.2.1. Company Overview
- 12.1.2.2. Products
- 12.1.2.3. Company Financials
- 12.1.2.4. SWOT Analysis
- 12.1.3 ASAHI FIBER GLASS Co Ltd
- 12.1.3.1. Company Overview
- 12.1.3.2. Products
- 12.1.3.3. Company Financials
- 12.1.3.4. SWOT Analysis
- 12.1.4 Nippon Sheet Glass Company Limite
- 12.1.4.1. Company Overview
- 12.1.4.2. Products
- 12.1.4.3. Company Financials
- 12.1.4.4. SWOT Analysis
- 12.1.5 Owens Corning
- 12.1.5.1. Company Overview
- 12.1.5.2. Products
- 12.1.5.3. Company Financials
- 12.1.5.4. SWOT Analysis
- 12.1.6 3B (Braj Binani Group)
- 12.1.6.1. Company Overview
- 12.1.6.2. Products
- 12.1.6.3. Company Financials
- 12.1.6.4. SWOT Analysis
- 12.1.7 Veplas Group
- 12.1.7.1. Company Overview
- 12.1.7.2. Products
- 12.1.7.3. Company Financials
- 12.1.7.4. SWOT Analysis
- 12.1.8 SAERTEX GmbH & Co KG
- 12.1.8.1. Company Overview
- 12.1.8.2. Products
- 12.1.8.3. Company Financials
- 12.1.8.4. SWOT Analysis
- 12.1.1 Solvay Group
- 12.2. Market Entropy
- 12.2.1 Company's Key Areas Served
- 12.2.2 Recent Developments
- 12.3. Company Market Share Analysis 2025
- 12.3.1 Top 5 Companies Market Share Analysis
- 12.3.2 Top 3 Companies Market Share Analysis
- 12.4. List of Potential Customers
- 13. Research Methodology
List of Figures
- Figure 1: Global Automotive Glass Fiber Composites Market Revenue Breakdown (billion, %) by Region 2025 & 2033
- Figure 2: North America Automotive Glass Fiber Composites Market Revenue (billion), by Intermediate Type 2025 & 2033
- Figure 3: North America Automotive Glass Fiber Composites Market Revenue Share (%), by Intermediate Type 2025 & 2033
- Figure 4: North America Automotive Glass Fiber Composites Market Revenue (billion), by Application 2025 & 2033
- Figure 5: North America Automotive Glass Fiber Composites Market Revenue Share (%), by Application 2025 & 2033
- Figure 6: North America Automotive Glass Fiber Composites Market Revenue (billion), by Country 2025 & 2033
- Figure 7: North America Automotive Glass Fiber Composites Market Revenue Share (%), by Country 2025 & 2033
- Figure 8: Europe Automotive Glass Fiber Composites Market Revenue (billion), by Intermediate Type 2025 & 2033
- Figure 9: Europe Automotive Glass Fiber Composites Market Revenue Share (%), by Intermediate Type 2025 & 2033
- Figure 10: Europe Automotive Glass Fiber Composites Market Revenue (billion), by Application 2025 & 2033
- Figure 11: Europe Automotive Glass Fiber Composites Market Revenue Share (%), by Application 2025 & 2033
- Figure 12: Europe Automotive Glass Fiber Composites Market Revenue (billion), by Country 2025 & 2033
- Figure 13: Europe Automotive Glass Fiber Composites Market Revenue Share (%), by Country 2025 & 2033
- Figure 14: Asia Pacific Automotive Glass Fiber Composites Market Revenue (billion), by Intermediate Type 2025 & 2033
- Figure 15: Asia Pacific Automotive Glass Fiber Composites Market Revenue Share (%), by Intermediate Type 2025 & 2033
- Figure 16: Asia Pacific Automotive Glass Fiber Composites Market Revenue (billion), by Application 2025 & 2033
- Figure 17: Asia Pacific Automotive Glass Fiber Composites Market Revenue Share (%), by Application 2025 & 2033
- Figure 18: Asia Pacific Automotive Glass Fiber Composites Market Revenue (billion), by Country 2025 & 2033
- Figure 19: Asia Pacific Automotive Glass Fiber Composites Market Revenue Share (%), by Country 2025 & 2033
- Figure 20: South America Automotive Glass Fiber Composites Market Revenue (billion), by Intermediate Type 2025 & 2033
- Figure 21: South America Automotive Glass Fiber Composites Market Revenue Share (%), by Intermediate Type 2025 & 2033
- Figure 22: South America Automotive Glass Fiber Composites Market Revenue (billion), by Application 2025 & 2033
- Figure 23: South America Automotive Glass Fiber Composites Market Revenue Share (%), by Application 2025 & 2033
- Figure 24: South America Automotive Glass Fiber Composites Market Revenue (billion), by Country 2025 & 2033
- Figure 25: South America Automotive Glass Fiber Composites Market Revenue Share (%), by Country 2025 & 2033
- Figure 26: Middle East and Africa Automotive Glass Fiber Composites Market Revenue (billion), by Intermediate Type 2025 & 2033
- Figure 27: Middle East and Africa Automotive Glass Fiber Composites Market Revenue Share (%), by Intermediate Type 2025 & 2033
- Figure 28: Middle East and Africa Automotive Glass Fiber Composites Market Revenue (billion), by Application 2025 & 2033
- Figure 29: Middle East and Africa Automotive Glass Fiber Composites Market Revenue Share (%), by Application 2025 & 2033
- Figure 30: Middle East and Africa Automotive Glass Fiber Composites Market Revenue (billion), by Country 2025 & 2033
- Figure 31: Middle East and Africa Automotive Glass Fiber Composites Market Revenue Share (%), by Country 2025 & 2033
List of Tables
- Table 1: Global Automotive Glass Fiber Composites Market Revenue billion Forecast, by Intermediate Type 2020 & 2033
- Table 2: Global Automotive Glass Fiber Composites Market Revenue billion Forecast, by Application 2020 & 2033
- Table 3: Global Automotive Glass Fiber Composites Market Revenue billion Forecast, by Region 2020 & 2033
- Table 4: Global Automotive Glass Fiber Composites Market Revenue billion Forecast, by Intermediate Type 2020 & 2033
- Table 5: Global Automotive Glass Fiber Composites Market Revenue billion Forecast, by Application 2020 & 2033
- Table 6: Global Automotive Glass Fiber Composites Market Revenue billion Forecast, by Country 2020 & 2033
- Table 7: United States Automotive Glass Fiber Composites Market Revenue (billion) Forecast, by Application 2020 & 2033
- Table 8: Canada Automotive Glass Fiber Composites Market Revenue (billion) Forecast, by Application 2020 & 2033
- Table 9: Rest of North America Automotive Glass Fiber Composites Market Revenue (billion) Forecast, by Application 2020 & 2033
- Table 10: Global Automotive Glass Fiber Composites Market Revenue billion Forecast, by Intermediate Type 2020 & 2033
- Table 11: Global Automotive Glass Fiber Composites Market Revenue billion Forecast, by Application 2020 & 2033
- Table 12: Global Automotive Glass Fiber Composites Market Revenue billion Forecast, by Country 2020 & 2033
- Table 13: Germany Automotive Glass Fiber Composites Market Revenue (billion) Forecast, by Application 2020 & 2033
- Table 14: United Kingdom Automotive Glass Fiber Composites Market Revenue (billion) Forecast, by Application 2020 & 2033
- Table 15: France Automotive Glass Fiber Composites Market Revenue (billion) Forecast, by Application 2020 & 2033
- Table 16: Rest of Europe Automotive Glass Fiber Composites Market Revenue (billion) Forecast, by Application 2020 & 2033
- Table 17: Global Automotive Glass Fiber Composites Market Revenue billion Forecast, by Intermediate Type 2020 & 2033
- Table 18: Global Automotive Glass Fiber Composites Market Revenue billion Forecast, by Application 2020 & 2033
- Table 19: Global Automotive Glass Fiber Composites Market Revenue billion Forecast, by Country 2020 & 2033
- Table 20: China Automotive Glass Fiber Composites Market Revenue (billion) Forecast, by Application 2020 & 2033
- Table 21: Japan Automotive Glass Fiber Composites Market Revenue (billion) Forecast, by Application 2020 & 2033
- Table 22: India Automotive Glass Fiber Composites Market Revenue (billion) Forecast, by Application 2020 & 2033
- Table 23: Rest of Asia Pacific Automotive Glass Fiber Composites Market Revenue (billion) Forecast, by Application 2020 & 2033
- Table 24: Global Automotive Glass Fiber Composites Market Revenue billion Forecast, by Intermediate Type 2020 & 2033
- Table 25: Global Automotive Glass Fiber Composites Market Revenue billion Forecast, by Application 2020 & 2033
- Table 26: Global Automotive Glass Fiber Composites Market Revenue billion Forecast, by Country 2020 & 2033
- Table 27: Brazil Automotive Glass Fiber Composites Market Revenue (billion) Forecast, by Application 2020 & 2033
- Table 28: Rest of South America Automotive Glass Fiber Composites Market Revenue (billion) Forecast, by Application 2020 & 2033
- Table 29: Global Automotive Glass Fiber Composites Market Revenue billion Forecast, by Intermediate Type 2020 & 2033
- Table 30: Global Automotive Glass Fiber Composites Market Revenue billion Forecast, by Application 2020 & 2033
- Table 31: Global Automotive Glass Fiber Composites Market Revenue billion Forecast, by Country 2020 & 2033
- Table 32: United Arab Emirates Automotive Glass Fiber Composites Market Revenue (billion) Forecast, by Application 2020 & 2033
- Table 33: South Africa Automotive Glass Fiber Composites Market Revenue (billion) Forecast, by Application 2020 & 2033
- Table 34: Rest of Middle East and Africa Automotive Glass Fiber Composites Market Revenue (billion) Forecast, by Application 2020 & 2033
Frequently Asked Questions
1. What is the projected Compound Annual Growth Rate (CAGR) of the Automotive Glass Fiber Composites Market?
The projected CAGR is approximately 14.5%.
2. Which companies are prominent players in the Automotive Glass Fiber Composites Market?
Key companies in the market include Solvay Group, Jiangsu Changhai Composite Materials, ASAHI FIBER GLASS Co Ltd, Nippon Sheet Glass Company Limite, Owens Corning, 3B (Braj Binani Group), Veplas Group, SAERTEX GmbH & Co KG.
3. What are the main segments of the Automotive Glass Fiber Composites Market?
The market segments include Intermediate Type, Application .
4. Can you provide details about the market size?
The market size is estimated to be USD 11.1 billion as of 2022.
5. What are some drivers contributing to market growth?
Rise in Tourism Across Activities the Country.
6. What are the notable trends driving market growth?
Increasing Adoption of Glass Fiber Composites in Automobiles.
7. Are there any restraints impacting market growth?
Hike In Fuel Prices To Restrict The Market Growth.
8. Can you provide examples of recent developments in the market?
November 2022: Solvay and Orbia announced a framework agreement for a joint venture to produce battery materials creating the largest capacity in North America. The total investment is estimated to be around USD 850 million, partially funded by a USD 178 million grant from the US Department of Energy to Solvay to build a facility in Augusta, Georgia. Solvay and Orbia intend to use two production sites in the southeastern United States, one for raw materials and the other for finished goods. Both plants will be fully operational by 2026.
9. What pricing options are available for accessing the report?
Pricing options include single-user, multi-user, and enterprise licenses priced at USD 4750, USD 5250, and USD 8750 respectively.
10. Is the market size provided in terms of value or volume?
The market size is provided in terms of value, measured in billion.
11. Are there any specific market keywords associated with the report?
Yes, the market keyword associated with the report is "Automotive Glass Fiber Composites Market," which aids in identifying and referencing the specific market segment covered.
12. How do I determine which pricing option suits my needs best?
The pricing options vary based on user requirements and access needs. Individual users may opt for single-user licenses, while businesses requiring broader access may choose multi-user or enterprise licenses for cost-effective access to the report.
13. Are there any additional resources or data provided in the Automotive Glass Fiber Composites Market report?
While the report offers comprehensive insights, it's advisable to review the specific contents or supplementary materials provided to ascertain if additional resources or data are available.
14. How can I stay updated on further developments or reports in the Automotive Glass Fiber Composites Market?
To stay informed about further developments, trends, and reports in the Automotive Glass Fiber Composites Market, consider subscribing to industry newsletters, following relevant companies and organizations, or regularly checking reputable industry news sources and publications.
Methodology
Step 1 - Identification of Relevant Samples Size from Population Database


Step 2 - Approaches for Defining Global Market Size (Value, Volume* & Price*)

Note*: In applicable scenarios
Step 3 - Data Sources
Primary Research
- Web Analytics
- Survey Reports
- Research Institute
- Latest Research Reports
- Opinion Leaders
Secondary Research
- Annual Reports
- White Paper
- Latest Press Release
- Industry Association
- Paid Database
- Investor Presentations

Step 4 - Data Triangulation
Involves using different sources of information in order to increase the validity of a study
These sources are likely to be stakeholders in a program - participants, other researchers, program staff, other community members, and so on.
Then we put all data in single framework & apply various statistical tools to find out the dynamic on the market.
During the analysis stage, feedback from the stakeholder groups would be compared to determine areas of agreement as well as areas of divergence