

Key Insights
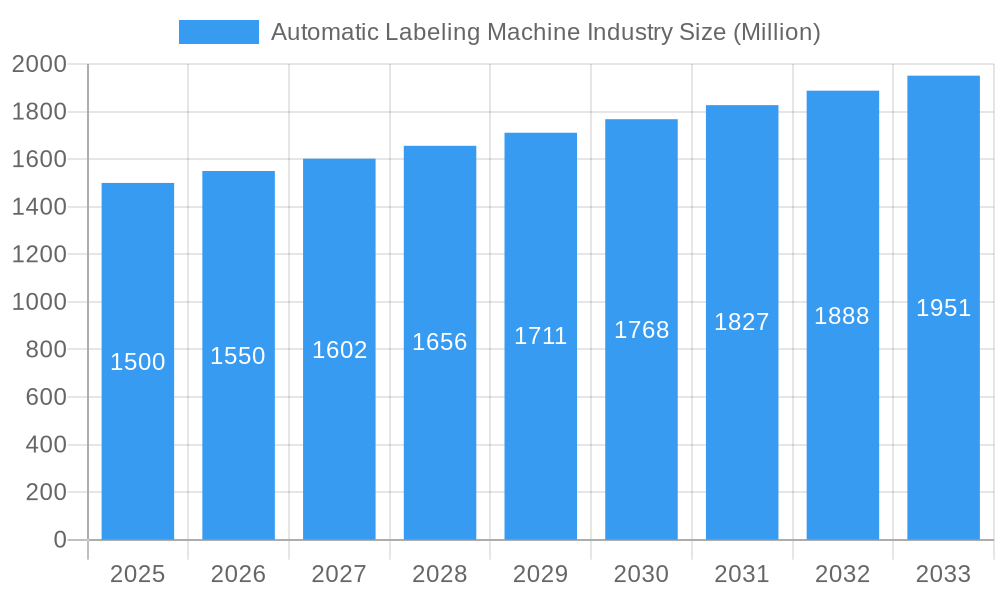
The global automatic labeling machine market is poised for robust expansion, driven by increasing industrial automation and the escalating need for precise and efficient labeling solutions. The market, estimated at 12.1 billion in 2025, is projected to grow at a compound annual growth rate (CAGR) of 3.3% from 2025 to 2033. Key growth drivers include the pharmaceutical, food & beverage, and personal care industries, which demand high-speed, accurate labeling for regulatory compliance and brand enhancement. The adoption of advanced labeling technologies, such as pressure-sensitive and sleeve labeling, further propels market growth by boosting efficiency and reducing labor costs. While high initial investment and the need for specialized expertise present challenges, particularly for smaller enterprises, the long-term advantages of increased productivity and minimized labeling errors justify the investment.
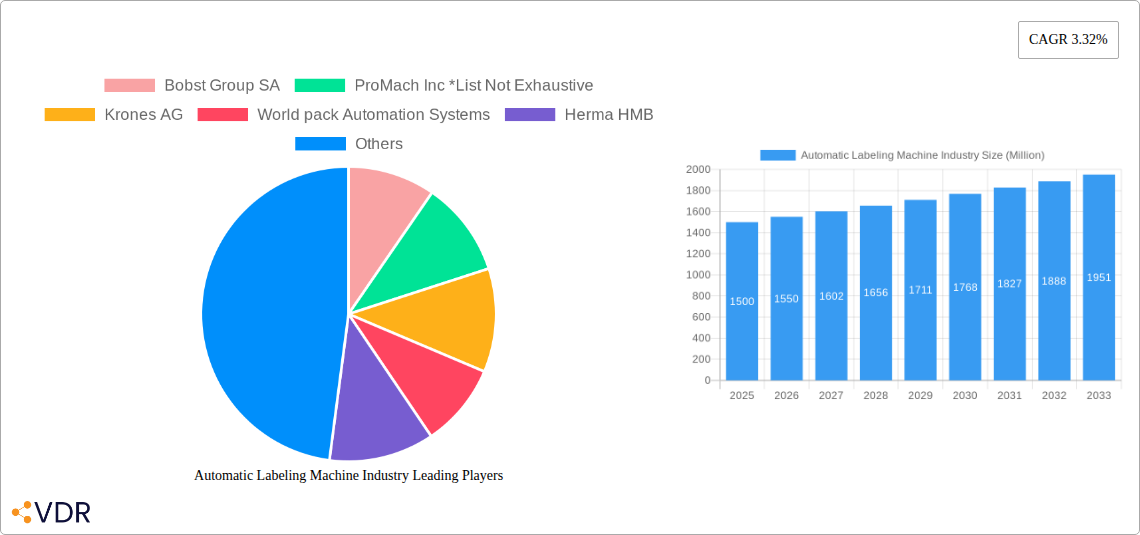
Automatic Labeling Machine Industry Market Size (In Billion)
Market segmentation indicates that pressure-sensitive/self-adhesive labelers currently lead due to their versatility across diverse products and packaging. The food and beverage sector commands a significant market share, owing to high volumes of packaged goods. Geographically, North America and Europe are dominant markets, supported by established manufacturing and a concentration of end-user industries. However, the Asia-Pacific region is anticipated to experience substantial growth, fueled by rapid industrialization and rising consumer demand. Intense competition among leading manufacturers, including Bobst Group SA, ProMach Inc., and Krones AG, fosters innovation and competitive pricing, enhancing accessibility for a broader business spectrum. This dynamic landscape, coupled with technological advancements and evolving regulatory standards, will shape the market's future trajectory.
Automatic Labeling Machine Industry Company Market Share
Automatic Labeling Machine Industry Market Report: 2019-2033
This comprehensive report provides an in-depth analysis of the Automatic Labeling Machine industry, encompassing market dynamics, growth trends, regional dominance, product landscape, key players, and future outlook. The study period covers 2019-2033, with 2025 as the base year and a forecast period of 2025-2033. This report is essential for industry professionals, investors, and strategic decision-makers seeking a clear understanding of this dynamic market.
Target Audience: Manufacturers, suppliers, distributors, investors, research firms, and government agencies involved in the packaging and labeling industry.
Automatic Labeling Machine Industry Market Dynamics & Structure
The automatic labeling machine market is characterized by a dynamic and evolving landscape, showcasing moderate concentration with established key players holding substantial market share. A primary catalyst for growth is relentless technological innovation, with a significant focus on advanced automation, high-resolution digital printing capabilities, and seamless integration into existing, sophisticated packaging lines. Furthermore, evolving regulatory frameworks, particularly those pertaining to stringent labeling standards for industries such as food safety and pharmaceuticals, exert a considerable influence on market dynamics and product development. While manual labeling methods serve as competitive substitutes, their inherent limitations in terms of speed, accuracy, and scalability invariably steer the market towards the continued adoption and advancement of automated solutions.
The diverse end-user demographics span a wide spectrum of industries, each presenting unique and often specialized labeling requirements. This necessitates continuous adaptation and innovation from machine manufacturers. Mergers and acquisitions (M&A) activity within the sector has remained a consistent feature, with larger enterprises strategically pursuing acquisitions to broaden their product portfolios, enhance their technological prowess, and expand their global market reach.
- Market Concentration: The market exhibits moderate concentration, with the top 5 players collectively estimated to hold approximately [Insert estimated market share % for 2025]% of the market share in 2025, indicating a competitive yet consolidated environment.
- Technological Innovation: The forefront of innovation is dedicated to achieving higher operational speeds, significantly improved labeling accuracy, and the development of machinery that offers seamless integration with other essential packaging equipment, creating end-to-end automated solutions.
- Regulatory Landscape: Increasingly stringent global regulations, especially concerning product traceability, safety, and compliance in the pharmaceutical and food & beverage sectors, are significant drivers for the demand for sophisticated and compliant labeling solutions.
- M&A Activity: The period between 2019 and 2024 has witnessed an average of [Insert average number of M&A deals] M&A deals per year, underscoring a trend of industry consolidation and strategic expansion.
- Innovation Barriers: The substantial initial investment costs associated with advanced labeling machinery and the inherent complexities of integration with existing infrastructure can present adoption challenges, particularly for smaller and medium-sized enterprises (SMEs).
Automatic Labeling Machine Industry Growth Trends & Insights
The global automatic labeling machine market is experiencing robust growth, driven by rising demand across diverse end-use sectors. The market size, estimated at xx million units in 2025, is projected to reach xx million units by 2033, exhibiting a CAGR of xx% during the forecast period. This growth is fueled by several factors including automation adoption in manufacturing, increasing focus on efficient packaging processes, and the growing demand for customized and high-quality labeling. Technological advancements, such as the integration of AI and machine learning for enhanced precision and speed, are further accelerating market expansion. The adoption rate is particularly high in developed regions like North America and Europe, with emerging economies showing substantial growth potential. Consumer behavior is shifting towards a preference for products with clear, informative, and attractive labels.
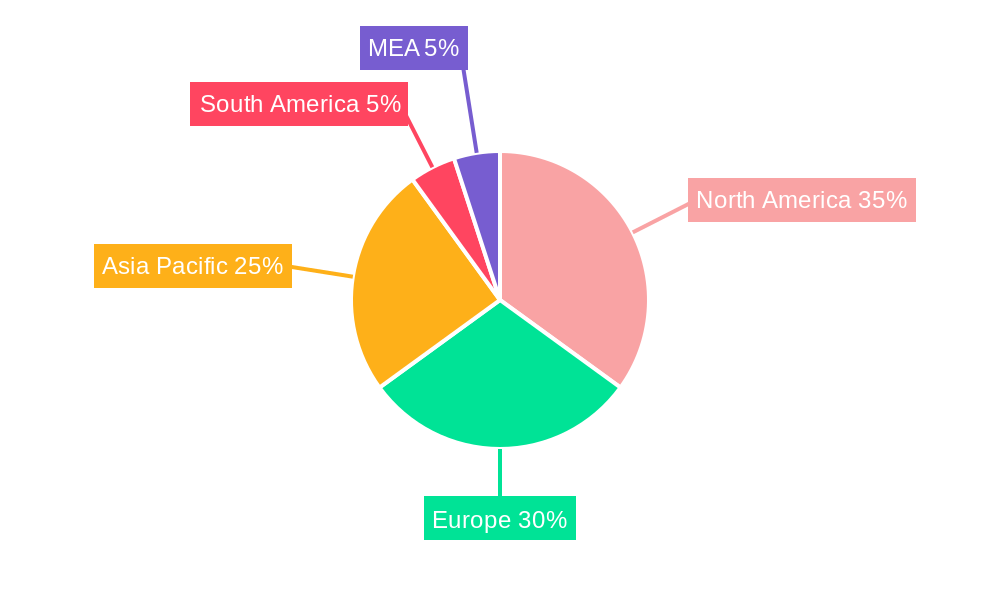
Dominant Regions, Countries, or Segments in Automatic Labeling Machine Industry
Currently, North America and Europe stand as the dominant forces in the automatic labeling machine market. This leadership is largely attributable to the high rates of automation adoption within their well-established industrial sectors and the presence of rigorous regulatory requirements that mandate precise and compliant labeling. Key contributors to market size within these regions include the United States, Germany, and the United Kingdom. However, a notable shift is underway as emerging economies in the Asia-Pacific and Latin American regions are demonstrating substantially faster growth trajectories, with the food and beverage sector being a particularly strong driver of this expansion.
By Type: Pressure-sensitive or self-adhesive labelers continue to command the largest market share, a position they maintain due to their inherent ease of use, versatility, and cost-effectiveness. Nevertheless, sleeve labelers are experiencing a period of rapid growth, largely propelled by the escalating demand for visually appealing, tamper-evident, and high-quality packaging solutions across various consumer goods.
By End User: The pharmaceutical and food & beverage industries remain the most significant end-users of automatic labeling machines. This dominance is a direct consequence of their high production volumes, the critical need for stringent quality control and product integrity, and the imperative for robust traceability throughout the supply chain.
- Key Drivers (North America & Europe): Advanced automation adoption rates, stringent regulatory compliance mandates, and a robust, established manufacturing base are the primary engines of growth in these mature markets.
- Key Drivers (Asia-Pacific & Latin America): Rising disposable incomes, a rapidly expanding manufacturing sector, and an increasing emphasis on brand enhancement and consumer appeal are fueling the adoption of automated labeling solutions in these dynamic regions.
- Market Share: In 2025, the projected market share distribution is: North America ([Insert estimated market share % for North America]%), Europe ([Insert estimated market share % for Europe]%), Asia-Pacific ([Insert estimated market share % for Asia-Pacific]%), and the Rest of the World ([Insert estimated market share % for RoW]%).
Automatic Labeling Machine Industry Product Landscape
The product landscape within the automatic labeling machine industry is characterized by its remarkable diversity and its capacity to address the highly specific needs of various industrial applications. Innovations are continuously pushing the boundaries, with a relentless focus on augmenting speed, enhancing precision, and integrating advanced functionalities. This includes the incorporation of sophisticated vision systems for unparalleled accuracy in label placement and seamless integration with other critical packaging machinery, creating highly efficient production lines. Key features that define these modern machines include intuitive user interfaces, automated label supply and management systems, and an enhanced versatility to adeptly handle a wide array of label types, sizes, and container geometries.
The unique selling propositions (USPs) of leading products often revolve around superior precision, exceptionally faster labeling speeds, and an increased emphasis on ease of maintenance, all of which contribute directly to significantly reduced downtime and a notable increase in overall production efficiency. Recent groundbreaking advancements are also introducing "smart labeling" systems, which are designed to seamlessly integrate data and enhance traceability, thereby bolstering supply chain management and providing greater transparency.
Key Drivers, Barriers & Challenges in Automatic Labeling Machine Industry
Key Drivers:
- Increasing demand for efficient and accurate labeling across various industries.
- Growing adoption of automation technologies to enhance productivity.
- Stringent regulatory requirements promoting automated and compliant labeling solutions.
- Rising consumer demand for attractive and informative product labels.
Challenges:
- High initial investment costs for advanced automatic labeling systems.
- Complex integration with existing packaging lines can present challenges.
- Supply chain disruptions affecting component availability and lead times. Estimated impact: xx% increase in production costs during peak disruption.
- Competition from manual labeling and less sophisticated automated systems.
Emerging Opportunities in Automatic Labeling Machine Industry
- Expansion into emerging markets with growing manufacturing sectors.
- Development of specialized labeling machines for niche industries.
- Integration of advanced technologies such as AI and machine learning for enhanced functionalities.
- Growing demand for sustainable and eco-friendly labeling solutions.
- Increased focus on customization and personalization of labels.
Growth Accelerators in the Automatic Labeling Machine Industry
Long-term growth in the automatic labeling machine market will be driven by continued technological innovation, strategic partnerships between machinery manufacturers and packaging material suppliers, and expansion into untapped markets. The increasing adoption of Industry 4.0 principles, enabling enhanced data analytics and process optimization, will further accelerate market growth. Furthermore, a growing focus on sustainability will drive demand for environmentally friendly labeling solutions and materials.
Key Players Shaping the Automatic Labeling Machine Market
- Bobst Group SA
- ProMach Inc
- Krones AG
- World pack Automation Systems
- Herma HMB
- SIDEL (Tetra Laval Group)
- Accutek Packaging Equipment Companies Inc
- Barry-Wehmiller Group Inc
- Sacmi Imola S C
- Nita Labeling Systems
- KHS GmbH
Notable Milestones in Automatic Labeling Machine Industry Sector
- August 2022: Schreiner MediPharm highlights Octapharma's adoption of a semi-automated labeling machine for small batch vial and infusion bottle labeling, emphasizing efficient and accurate small-quantity labeling.
- May 2022: GeostickGroup's purchase of a BOBST DIGITAL MASTER 340 label press demonstrates investment in fully automated digital label printing capabilities, signifying a shift towards advanced technology within the industry.
In-Depth Automatic Labeling Machine Industry Market Outlook
The future trajectory of the automatic labeling machine industry appears exceptionally promising, characterized by sustained and robust growth. This expansion will be propelled by ongoing technological advancements, the broadening application of labeling solutions across an increasingly diverse range of sectors, and a paramount focus on enhancing operational efficiency and environmental sustainability. Strategic collaborations and market consolidation through well-executed M&A activities, coupled with the integration of cutting-edge technologies such as Artificial Intelligence (AI) and machine learning, are poised to significantly shape the future market landscape. The potential for substantial growth is particularly pronounced in emerging economies, where the adoption of automation is accelerating at an impressive pace. Manufacturers that prioritize customization, deliver enhanced precision, and offer seamless integration with broader packaging solutions will undoubtedly secure a significant competitive advantage in this evolving market.
Automatic Labeling Machine Industry Segmentation
-
1. Type
- 1.1. Pressure-sensitive/Self-adhesive Labelers
- 1.2. Sleeve Labelers
- 1.3. Glue-based Labelers
- 1.4. Other Types
-
2. End User
- 2.1. Pharmaceutical
- 2.2. Food
- 2.3. Beverages
- 2.4. Personal Care
- 2.5. Chemicals
- 2.6. Other End Users
Automatic Labeling Machine Industry Segmentation By Geography
-
1. North America
- 1.1. United States
- 1.2. Canada
-
2. Europe
- 2.1. United Kingdom
- 2.2. Germany
- 2.3. France
- 2.4. Rest of Europe
-
3. Asia Pacific
- 3.1. India
- 3.2. China
- 3.3. Japan
- 3.4. Rest of Asia Pacific
-
4. Latin America
- 4.1. Mexico
- 4.2. Brazil
- 4.3. Rest of Latin America
- 5. Middle East
-
6. United Arab Emirates
- 6.1. Saudi Arabia
- 6.2. Rest of Middle East
Automatic Labeling Machine Industry Regional Market Share
Geographic Coverage of Automatic Labeling Machine Industry
Automatic Labeling Machine Industry REPORT HIGHLIGHTS
| Aspects | Details |
|---|---|
| Study Period | 2020-2034 |
| Base Year | 2025 |
| Estimated Year | 2026 |
| Forecast Period | 2026-2034 |
| Historical Period | 2020-2025 |
| Growth Rate | CAGR of 3.3% from 2020-2034 |
| Segmentation |
|
Table of Contents
- 1. Introduction
- 1.1. Research Scope
- 1.2. Market Segmentation
- 1.3. Research Objective
- 1.4. Definitions and Assumptions
- 2. Executive Summary
- 2.1. Market Snapshot
- 3. Market Dynamics
- 3.1. Market Drivers
- 3.2. Market Restrains
- 3.3. Market Trends
- 3.4. Market Opportunities
- 4. Market Factor Analysis
- 4.1. Porters Five Forces
- 4.1.1. Bargaining Power of Suppliers
- 4.1.2. Bargaining Power of Buyers
- 4.1.3. Threat of New Entrants
- 4.1.4. Threat of Substitutes
- 4.1.5. Competitive Rivalry
- 4.2. PESTEL analysis
- 4.3. BCG Analysis
- 4.3.1. Stars (High Growth, High Market Share)
- 4.3.2. Cash Cows (Low Growth, High Market Share)
- 4.3.3. Question Mark (High Growth, Low Market Share)
- 4.3.4. Dogs (Low Growth, Low Market Share)
- 4.4. Ansoff Matrix Analysis
- 4.5. Supply Chain Analysis
- 4.6. Regulatory Landscape
- 4.7. Current Market Potential and Opportunity Assessment (TAM–SAM–SOM Framework)
- 4.8. VDR Analyst Note
- 4.1. Porters Five Forces
- 5. Market Analysis, Insights and Forecast 2021-2033
- 5.1. Market Analysis, Insights and Forecast - by Type
- 5.1.1. Pressure-sensitive/Self-adhesive Labelers
- 5.1.2. Sleeve Labelers
- 5.1.3. Glue-based Labelers
- 5.1.4. Other Types
- 5.2. Market Analysis, Insights and Forecast - by End User
- 5.2.1. Pharmaceutical
- 5.2.2. Food
- 5.2.3. Beverages
- 5.2.4. Personal Care
- 5.2.5. Chemicals
- 5.2.6. Other End Users
- 5.3. Market Analysis, Insights and Forecast - by Region
- 5.3.1. North America
- 5.3.2. Europe
- 5.3.3. Asia Pacific
- 5.3.4. Latin America
- 5.3.5. Middle East
- 5.3.6. United Arab Emirates
- 5.1. Market Analysis, Insights and Forecast - by Type
- 6. Global Automatic Labeling Machine Industry Analysis, Insights and Forecast, 2021-2033
- 6.1. Market Analysis, Insights and Forecast - by Type
- 6.1.1. Pressure-sensitive/Self-adhesive Labelers
- 6.1.2. Sleeve Labelers
- 6.1.3. Glue-based Labelers
- 6.1.4. Other Types
- 6.2. Market Analysis, Insights and Forecast - by End User
- 6.2.1. Pharmaceutical
- 6.2.2. Food
- 6.2.3. Beverages
- 6.2.4. Personal Care
- 6.2.5. Chemicals
- 6.2.6. Other End Users
- 6.1. Market Analysis, Insights and Forecast - by Type
- 7. North America Automatic Labeling Machine Industry Analysis, Insights and Forecast, 2021-2033
- 7.1. Market Analysis, Insights and Forecast - by Type
- 7.1.1. Pressure-sensitive/Self-adhesive Labelers
- 7.1.2. Sleeve Labelers
- 7.1.3. Glue-based Labelers
- 7.1.4. Other Types
- 7.2. Market Analysis, Insights and Forecast - by End User
- 7.2.1. Pharmaceutical
- 7.2.2. Food
- 7.2.3. Beverages
- 7.2.4. Personal Care
- 7.2.5. Chemicals
- 7.2.6. Other End Users
- 7.1. Market Analysis, Insights and Forecast - by Type
- 8. Europe Automatic Labeling Machine Industry Analysis, Insights and Forecast, 2021-2033
- 8.1. Market Analysis, Insights and Forecast - by Type
- 8.1.1. Pressure-sensitive/Self-adhesive Labelers
- 8.1.2. Sleeve Labelers
- 8.1.3. Glue-based Labelers
- 8.1.4. Other Types
- 8.2. Market Analysis, Insights and Forecast - by End User
- 8.2.1. Pharmaceutical
- 8.2.2. Food
- 8.2.3. Beverages
- 8.2.4. Personal Care
- 8.2.5. Chemicals
- 8.2.6. Other End Users
- 8.1. Market Analysis, Insights and Forecast - by Type
- 9. Asia Pacific Automatic Labeling Machine Industry Analysis, Insights and Forecast, 2021-2033
- 9.1. Market Analysis, Insights and Forecast - by Type
- 9.1.1. Pressure-sensitive/Self-adhesive Labelers
- 9.1.2. Sleeve Labelers
- 9.1.3. Glue-based Labelers
- 9.1.4. Other Types
- 9.2. Market Analysis, Insights and Forecast - by End User
- 9.2.1. Pharmaceutical
- 9.2.2. Food
- 9.2.3. Beverages
- 9.2.4. Personal Care
- 9.2.5. Chemicals
- 9.2.6. Other End Users
- 9.1. Market Analysis, Insights and Forecast - by Type
- 10. Latin America Automatic Labeling Machine Industry Analysis, Insights and Forecast, 2021-2033
- 10.1. Market Analysis, Insights and Forecast - by Type
- 10.1.1. Pressure-sensitive/Self-adhesive Labelers
- 10.1.2. Sleeve Labelers
- 10.1.3. Glue-based Labelers
- 10.1.4. Other Types
- 10.2. Market Analysis, Insights and Forecast - by End User
- 10.2.1. Pharmaceutical
- 10.2.2. Food
- 10.2.3. Beverages
- 10.2.4. Personal Care
- 10.2.5. Chemicals
- 10.2.6. Other End Users
- 10.1. Market Analysis, Insights and Forecast - by Type
- 11. Middle East Automatic Labeling Machine Industry Analysis, Insights and Forecast, 2021-2033
- 11.1. Market Analysis, Insights and Forecast - by Type
- 11.1.1. Pressure-sensitive/Self-adhesive Labelers
- 11.1.2. Sleeve Labelers
- 11.1.3. Glue-based Labelers
- 11.1.4. Other Types
- 11.2. Market Analysis, Insights and Forecast - by End User
- 11.2.1. Pharmaceutical
- 11.2.2. Food
- 11.2.3. Beverages
- 11.2.4. Personal Care
- 11.2.5. Chemicals
- 11.2.6. Other End Users
- 11.1. Market Analysis, Insights and Forecast - by Type
- 12. United Arab Emirates Automatic Labeling Machine Industry Analysis, Insights and Forecast, 2021-2033
- 12.1. Market Analysis, Insights and Forecast - by Type
- 12.1.1. Pressure-sensitive/Self-adhesive Labelers
- 12.1.2. Sleeve Labelers
- 12.1.3. Glue-based Labelers
- 12.1.4. Other Types
- 12.2. Market Analysis, Insights and Forecast - by End User
- 12.2.1. Pharmaceutical
- 12.2.2. Food
- 12.2.3. Beverages
- 12.2.4. Personal Care
- 12.2.5. Chemicals
- 12.2.6. Other End Users
- 12.1. Market Analysis, Insights and Forecast - by Type
- 13. Competitive Analysis
- 13.1. Company Profiles
- 13.1.1 Bobst Group SA
- 13.1.1.1. Company Overview
- 13.1.1.2. Products
- 13.1.1.3. Company Financials
- 13.1.1.4. SWOT Analysis
- 13.1.2 ProMach Inc *List Not Exhaustive
- 13.1.2.1. Company Overview
- 13.1.2.2. Products
- 13.1.2.3. Company Financials
- 13.1.2.4. SWOT Analysis
- 13.1.3 Krones AG
- 13.1.3.1. Company Overview
- 13.1.3.2. Products
- 13.1.3.3. Company Financials
- 13.1.3.4. SWOT Analysis
- 13.1.4 World pack Automation Systems
- 13.1.4.1. Company Overview
- 13.1.4.2. Products
- 13.1.4.3. Company Financials
- 13.1.4.4. SWOT Analysis
- 13.1.5 Herma HMB
- 13.1.5.1. Company Overview
- 13.1.5.2. Products
- 13.1.5.3. Company Financials
- 13.1.5.4. SWOT Analysis
- 13.1.6 SIDEL (Tetra Laval Group)
- 13.1.6.1. Company Overview
- 13.1.6.2. Products
- 13.1.6.3. Company Financials
- 13.1.6.4. SWOT Analysis
- 13.1.7 Accutek Packaging Equipment Companies Inc
- 13.1.7.1. Company Overview
- 13.1.7.2. Products
- 13.1.7.3. Company Financials
- 13.1.7.4. SWOT Analysis
- 13.1.8 Barry-Wehmiller Group Inc
- 13.1.8.1. Company Overview
- 13.1.8.2. Products
- 13.1.8.3. Company Financials
- 13.1.8.4. SWOT Analysis
- 13.1.9 Sacmi Imola S C
- 13.1.9.1. Company Overview
- 13.1.9.2. Products
- 13.1.9.3. Company Financials
- 13.1.9.4. SWOT Analysis
- 13.1.10 Nita Labeling Systems
- 13.1.10.1. Company Overview
- 13.1.10.2. Products
- 13.1.10.3. Company Financials
- 13.1.10.4. SWOT Analysis
- 13.1.11 KHS GmbH
- 13.1.11.1. Company Overview
- 13.1.11.2. Products
- 13.1.11.3. Company Financials
- 13.1.11.4. SWOT Analysis
- 13.1.1 Bobst Group SA
- 13.2. Market Entropy
- 13.2.1 Company's Key Areas Served
- 13.2.2 Recent Developments
- 13.3. Company Market Share Analysis 2025
- 13.3.1 Top 5 Companies Market Share Analysis
- 13.3.2 Top 3 Companies Market Share Analysis
- 13.4. List of Potential Customers
- 14. Research Methodology
List of Figures
- Figure 1: Global Automatic Labeling Machine Industry Revenue Breakdown (billion, %) by Region 2025 & 2033
- Figure 2: North America Automatic Labeling Machine Industry Revenue (billion), by Type 2025 & 2033
- Figure 3: North America Automatic Labeling Machine Industry Revenue Share (%), by Type 2025 & 2033
- Figure 4: North America Automatic Labeling Machine Industry Revenue (billion), by End User 2025 & 2033
- Figure 5: North America Automatic Labeling Machine Industry Revenue Share (%), by End User 2025 & 2033
- Figure 6: North America Automatic Labeling Machine Industry Revenue (billion), by Country 2025 & 2033
- Figure 7: North America Automatic Labeling Machine Industry Revenue Share (%), by Country 2025 & 2033
- Figure 8: Europe Automatic Labeling Machine Industry Revenue (billion), by Type 2025 & 2033
- Figure 9: Europe Automatic Labeling Machine Industry Revenue Share (%), by Type 2025 & 2033
- Figure 10: Europe Automatic Labeling Machine Industry Revenue (billion), by End User 2025 & 2033
- Figure 11: Europe Automatic Labeling Machine Industry Revenue Share (%), by End User 2025 & 2033
- Figure 12: Europe Automatic Labeling Machine Industry Revenue (billion), by Country 2025 & 2033
- Figure 13: Europe Automatic Labeling Machine Industry Revenue Share (%), by Country 2025 & 2033
- Figure 14: Asia Pacific Automatic Labeling Machine Industry Revenue (billion), by Type 2025 & 2033
- Figure 15: Asia Pacific Automatic Labeling Machine Industry Revenue Share (%), by Type 2025 & 2033
- Figure 16: Asia Pacific Automatic Labeling Machine Industry Revenue (billion), by End User 2025 & 2033
- Figure 17: Asia Pacific Automatic Labeling Machine Industry Revenue Share (%), by End User 2025 & 2033
- Figure 18: Asia Pacific Automatic Labeling Machine Industry Revenue (billion), by Country 2025 & 2033
- Figure 19: Asia Pacific Automatic Labeling Machine Industry Revenue Share (%), by Country 2025 & 2033
- Figure 20: Latin America Automatic Labeling Machine Industry Revenue (billion), by Type 2025 & 2033
- Figure 21: Latin America Automatic Labeling Machine Industry Revenue Share (%), by Type 2025 & 2033
- Figure 22: Latin America Automatic Labeling Machine Industry Revenue (billion), by End User 2025 & 2033
- Figure 23: Latin America Automatic Labeling Machine Industry Revenue Share (%), by End User 2025 & 2033
- Figure 24: Latin America Automatic Labeling Machine Industry Revenue (billion), by Country 2025 & 2033
- Figure 25: Latin America Automatic Labeling Machine Industry Revenue Share (%), by Country 2025 & 2033
- Figure 26: Middle East Automatic Labeling Machine Industry Revenue (billion), by Type 2025 & 2033
- Figure 27: Middle East Automatic Labeling Machine Industry Revenue Share (%), by Type 2025 & 2033
- Figure 28: Middle East Automatic Labeling Machine Industry Revenue (billion), by End User 2025 & 2033
- Figure 29: Middle East Automatic Labeling Machine Industry Revenue Share (%), by End User 2025 & 2033
- Figure 30: Middle East Automatic Labeling Machine Industry Revenue (billion), by Country 2025 & 2033
- Figure 31: Middle East Automatic Labeling Machine Industry Revenue Share (%), by Country 2025 & 2033
- Figure 32: United Arab Emirates Automatic Labeling Machine Industry Revenue (billion), by Type 2025 & 2033
- Figure 33: United Arab Emirates Automatic Labeling Machine Industry Revenue Share (%), by Type 2025 & 2033
- Figure 34: United Arab Emirates Automatic Labeling Machine Industry Revenue (billion), by End User 2025 & 2033
- Figure 35: United Arab Emirates Automatic Labeling Machine Industry Revenue Share (%), by End User 2025 & 2033
- Figure 36: United Arab Emirates Automatic Labeling Machine Industry Revenue (billion), by Country 2025 & 2033
- Figure 37: United Arab Emirates Automatic Labeling Machine Industry Revenue Share (%), by Country 2025 & 2033
List of Tables
- Table 1: Global Automatic Labeling Machine Industry Revenue billion Forecast, by Type 2020 & 2033
- Table 2: Global Automatic Labeling Machine Industry Revenue billion Forecast, by End User 2020 & 2033
- Table 3: Global Automatic Labeling Machine Industry Revenue billion Forecast, by Region 2020 & 2033
- Table 4: Global Automatic Labeling Machine Industry Revenue billion Forecast, by Type 2020 & 2033
- Table 5: Global Automatic Labeling Machine Industry Revenue billion Forecast, by End User 2020 & 2033
- Table 6: Global Automatic Labeling Machine Industry Revenue billion Forecast, by Country 2020 & 2033
- Table 7: United States Automatic Labeling Machine Industry Revenue (billion) Forecast, by Application 2020 & 2033
- Table 8: Canada Automatic Labeling Machine Industry Revenue (billion) Forecast, by Application 2020 & 2033
- Table 9: Global Automatic Labeling Machine Industry Revenue billion Forecast, by Type 2020 & 2033
- Table 10: Global Automatic Labeling Machine Industry Revenue billion Forecast, by End User 2020 & 2033
- Table 11: Global Automatic Labeling Machine Industry Revenue billion Forecast, by Country 2020 & 2033
- Table 12: United Kingdom Automatic Labeling Machine Industry Revenue (billion) Forecast, by Application 2020 & 2033
- Table 13: Germany Automatic Labeling Machine Industry Revenue (billion) Forecast, by Application 2020 & 2033
- Table 14: France Automatic Labeling Machine Industry Revenue (billion) Forecast, by Application 2020 & 2033
- Table 15: Rest of Europe Automatic Labeling Machine Industry Revenue (billion) Forecast, by Application 2020 & 2033
- Table 16: Global Automatic Labeling Machine Industry Revenue billion Forecast, by Type 2020 & 2033
- Table 17: Global Automatic Labeling Machine Industry Revenue billion Forecast, by End User 2020 & 2033
- Table 18: Global Automatic Labeling Machine Industry Revenue billion Forecast, by Country 2020 & 2033
- Table 19: India Automatic Labeling Machine Industry Revenue (billion) Forecast, by Application 2020 & 2033
- Table 20: China Automatic Labeling Machine Industry Revenue (billion) Forecast, by Application 2020 & 2033
- Table 21: Japan Automatic Labeling Machine Industry Revenue (billion) Forecast, by Application 2020 & 2033
- Table 22: Rest of Asia Pacific Automatic Labeling Machine Industry Revenue (billion) Forecast, by Application 2020 & 2033
- Table 23: Global Automatic Labeling Machine Industry Revenue billion Forecast, by Type 2020 & 2033
- Table 24: Global Automatic Labeling Machine Industry Revenue billion Forecast, by End User 2020 & 2033
- Table 25: Global Automatic Labeling Machine Industry Revenue billion Forecast, by Country 2020 & 2033
- Table 26: Mexico Automatic Labeling Machine Industry Revenue (billion) Forecast, by Application 2020 & 2033
- Table 27: Brazil Automatic Labeling Machine Industry Revenue (billion) Forecast, by Application 2020 & 2033
- Table 28: Rest of Latin America Automatic Labeling Machine Industry Revenue (billion) Forecast, by Application 2020 & 2033
- Table 29: Global Automatic Labeling Machine Industry Revenue billion Forecast, by Type 2020 & 2033
- Table 30: Global Automatic Labeling Machine Industry Revenue billion Forecast, by End User 2020 & 2033
- Table 31: Global Automatic Labeling Machine Industry Revenue billion Forecast, by Country 2020 & 2033
- Table 32: Global Automatic Labeling Machine Industry Revenue billion Forecast, by Type 2020 & 2033
- Table 33: Global Automatic Labeling Machine Industry Revenue billion Forecast, by End User 2020 & 2033
- Table 34: Global Automatic Labeling Machine Industry Revenue billion Forecast, by Country 2020 & 2033
- Table 35: Saudi Arabia Automatic Labeling Machine Industry Revenue (billion) Forecast, by Application 2020 & 2033
- Table 36: Rest of Middle East Automatic Labeling Machine Industry Revenue (billion) Forecast, by Application 2020 & 2033
Frequently Asked Questions
1. What is the projected Compound Annual Growth Rate (CAGR) of the Automatic Labeling Machine Industry?
The projected CAGR is approximately 3.3%.
2. Which companies are prominent players in the Automatic Labeling Machine Industry?
Key companies in the market include Bobst Group SA, ProMach Inc *List Not Exhaustive, Krones AG, World pack Automation Systems, Herma HMB, SIDEL (Tetra Laval Group), Accutek Packaging Equipment Companies Inc, Barry-Wehmiller Group Inc, Sacmi Imola S C, Nita Labeling Systems, KHS GmbH.
3. What are the main segments of the Automatic Labeling Machine Industry?
The market segments include Type, End User.
4. Can you provide details about the market size?
The market size is estimated to be USD 12.1 billion as of 2022.
5. What are some drivers contributing to market growth?
Increasing Demand for Automation in Food and Beverage Packaging; Growing Adoption of Automatic Labeling Machine.
6. What are the notable trends driving market growth?
Increasing Demand for Automation in Food and Beverage Packaging to Witness Growth.
7. Are there any restraints impacting market growth?
High Cost Associated with Labeling Machines and Coping with Trends.
8. Can you provide examples of recent developments in the market?
August 2022 - Schreiner MediPharm disclosed that healthcare provider Octapharma uses a new, semi-automated machine to label small batches of its vials and infusion bottles. The semi-automatic dispensing system satisfies Octapharma's need for an efficient method of quick and accurate labeling of small quantities of a variety of containers.
9. What pricing options are available for accessing the report?
Pricing options include single-user, multi-user, and enterprise licenses priced at USD 4750, USD 5250, and USD 8750 respectively.
10. Is the market size provided in terms of value or volume?
The market size is provided in terms of value, measured in billion.
11. Are there any specific market keywords associated with the report?
Yes, the market keyword associated with the report is "Automatic Labeling Machine Industry," which aids in identifying and referencing the specific market segment covered.
12. How do I determine which pricing option suits my needs best?
The pricing options vary based on user requirements and access needs. Individual users may opt for single-user licenses, while businesses requiring broader access may choose multi-user or enterprise licenses for cost-effective access to the report.
13. Are there any additional resources or data provided in the Automatic Labeling Machine Industry report?
While the report offers comprehensive insights, it's advisable to review the specific contents or supplementary materials provided to ascertain if additional resources or data are available.
14. How can I stay updated on further developments or reports in the Automatic Labeling Machine Industry?
To stay informed about further developments, trends, and reports in the Automatic Labeling Machine Industry, consider subscribing to industry newsletters, following relevant companies and organizations, or regularly checking reputable industry news sources and publications.
Methodology
Step 1 - Identification of Relevant Samples Size from Population Database


Step 2 - Approaches for Defining Global Market Size (Value, Volume* & Price*)

Note*: In applicable scenarios
Step 3 - Data Sources
Primary Research
- Web Analytics
- Survey Reports
- Research Institute
- Latest Research Reports
- Opinion Leaders
Secondary Research
- Annual Reports
- White Paper
- Latest Press Release
- Industry Association
- Paid Database
- Investor Presentations

Step 4 - Data Triangulation
Involves using different sources of information in order to increase the validity of a study
These sources are likely to be stakeholders in a program - participants, other researchers, program staff, other community members, and so on.
Then we put all data in single framework & apply various statistical tools to find out the dynamic on the market.
During the analysis stage, feedback from the stakeholder groups would be compared to determine areas of agreement as well as areas of divergence