
Key Insights
The global autologous stem cell and non-stem cell-based therapies market is experiencing robust growth, projected to reach a substantial size driven by the increasing prevalence of chronic diseases like cancer, neurodegenerative disorders, and cardiovascular diseases. The market's Compound Annual Growth Rate (CAGR) of 14.26% from 2019 to 2024 suggests a significant expansion, and this trajectory is expected to continue throughout the forecast period (2025-2033). Key drivers include advancements in cell processing technologies, increasing research and development activities focusing on cell therapy applications, and the rising adoption of personalized medicine approaches. The segmental analysis reveals a strong demand across various applications, with cancer therapies currently dominating, followed by neurodegenerative disorders and cardiovascular diseases. Hospitals and ambulatory surgical centers represent significant end-user segments, reflecting the clinical nature of these therapies. The autologous nature of these therapies, using a patient's own cells, minimizes the risk of rejection and immune responses, further fueling market growth. However, challenges remain, including high treatment costs, stringent regulatory approvals, and the complexities associated with cell manufacturing and storage. Despite these restraints, the market's potential is immense, particularly considering ongoing research into new therapeutic applications and improved manufacturing processes.
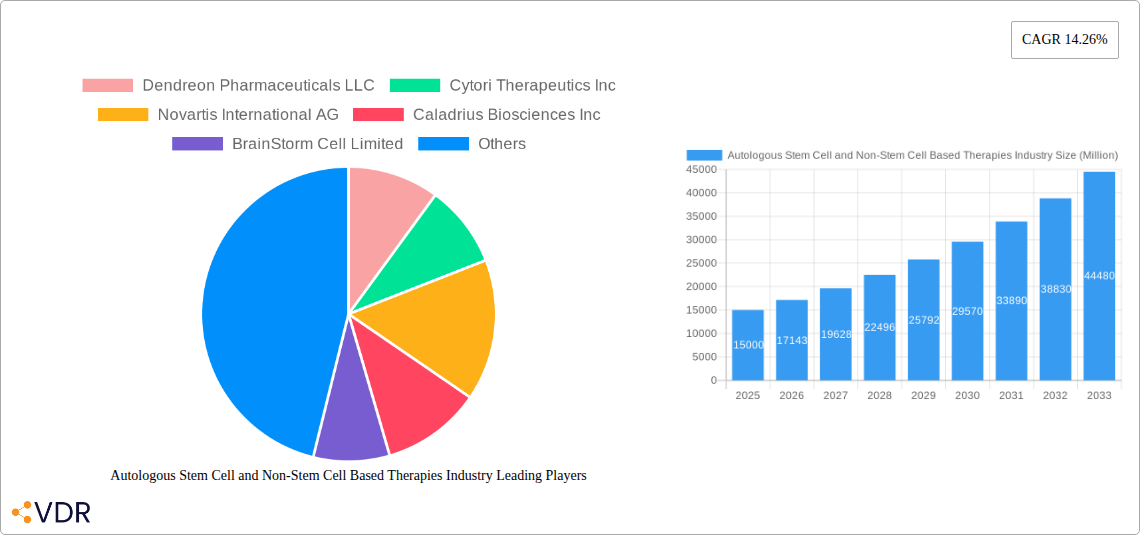
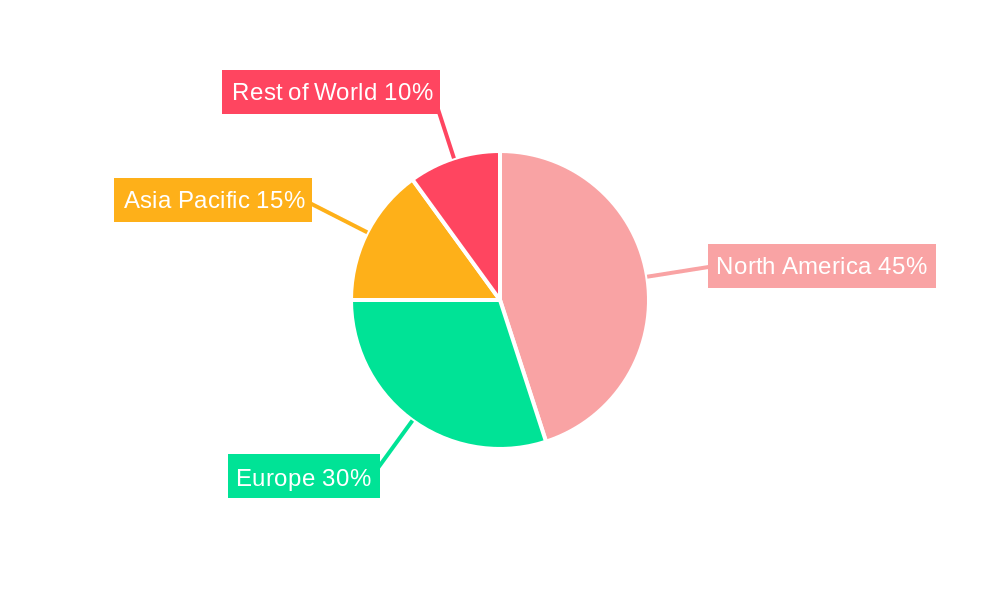
The geographical distribution of the market shows a significant presence in North America and Europe, driven by established healthcare infrastructure and higher healthcare expenditure. Asia Pacific is also emerging as a promising region, with increasing investments in research and development and expanding healthcare facilities. Companies like Dendreon Pharmaceuticals LLC, Cytori Therapeutics Inc., and Novartis International AG are leading the market with their innovative therapies and expanding product pipelines. The ongoing focus on developing safer, more effective, and cost-effective autologous cell therapies is expected to significantly shape the market landscape in the coming years. The continuous advancements in technology and the growing understanding of stem cell biology are expected to unlock new therapeutic possibilities and accelerate the market's growth further. Future growth will depend on overcoming the regulatory hurdles and making these therapies more accessible to a wider patient population.
Autologous Stem Cell and Non-Stem Cell Based Therapies Industry: Market Report 2019-2033
This comprehensive report provides an in-depth analysis of the Autologous Stem Cell and Non-Stem Cell Based Therapies market, offering invaluable insights for industry professionals, investors, and strategic decision-makers. Covering the period 2019-2033, with a base year of 2025, this report dissects market dynamics, growth trends, leading players, and future opportunities within this rapidly evolving sector. The study encompasses various segments including By Application (Cancer, Neurodegenerative Disorders, Cardiovascular Disease, Orthopedic Diseases, Other Applications), By End User (Hospitals, Ambulatory Surgical Centers, Research Facilities), and By Type (Autologous Stem Cells, Autologous Non-Stem Cells). The market is projected to reach xx Million units by 2033.
Autologous Stem Cell and Non-Stem Cell Based Therapies Industry Market Dynamics & Structure
This section analyzes the competitive landscape, technological advancements, regulatory influences, and market consolidation within the autologous stem cell and non-stem cell based therapies industry. The market is characterized by a moderate level of concentration, with key players like Dendreon Pharmaceuticals LLC, Cytori Therapeutics Inc, and Novartis International AG holding significant market share. However, the emergence of smaller, innovative companies is fostering increased competition.
- Market Concentration: The market exhibits a moderately concentrated structure with a Herfindahl-Hirschman Index (HHI) of xx. The top 5 players account for approximately xx% of the total market revenue in 2025.
- Technological Innovation: Ongoing advancements in cell processing, gene editing, and delivery systems are driving market growth. Innovation in areas like CAR T-cell therapy is particularly impactful.
- Regulatory Landscape: Stringent regulatory approvals and clinical trial requirements influence market entry and product development timelines. Variations in regulatory frameworks across different geographies create challenges for global expansion.
- Competitive Substitutes: Traditional therapies, such as chemotherapy and surgery, pose competitive challenges to stem cell-based therapies. The efficacy and cost-effectiveness of stem cell therapies will dictate their competitive positioning.
- Mergers & Acquisitions (M&A): The industry witnessed significant M&A activity, with xx deals recorded in the historical period (2019-2024). These transactions aim to expand product pipelines, enhance technological capabilities, and accelerate market penetration.
Autologous Stem Cell and Non-Stem Cell Based Therapies Industry Growth Trends & Insights
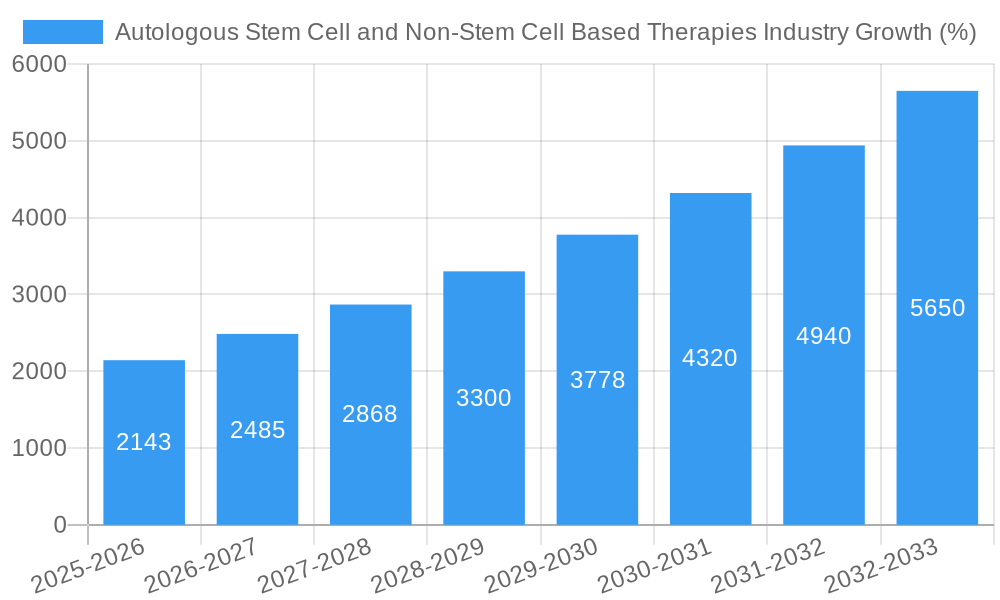
The global autologous stem cell and non-stem cell based therapies market has experienced substantial growth in recent years, driven by increasing prevalence of target diseases, technological advancements, and rising investments in research and development. The market size was valued at xx Million units in 2024 and is projected to grow at a Compound Annual Growth Rate (CAGR) of xx% during the forecast period (2025-2033), reaching xx Million units by 2033. Increased adoption rates across various therapeutic areas, particularly in oncology and cardiovascular diseases, are key growth drivers. Technological disruptions, such as the development of advanced cell processing technologies and improved delivery methods, are further accelerating market expansion. Shifts in consumer behavior towards personalized medicine and increased awareness of stem cell therapies are also contributing to market growth.
Dominant Regions, Countries, or Segments in Autologous Stem Cell and Non-Stem Cell Based Therapies Industry
North America currently dominates the autologous stem cell and non-stem cell based therapies market, driven by robust healthcare infrastructure, high research and development spending, and early adoption of innovative therapies. Europe and Asia-Pacific are also witnessing significant growth, fueled by rising healthcare expenditure and increasing prevalence of target diseases.
- By Application: Cancer therapies constitute the largest segment, representing xx% of the market in 2025, driven by the success of CAR T-cell therapies and other immunotherapies.
- By End User: Hospitals remain the dominant end-user segment, holding approximately xx% of the market share due to their advanced infrastructure and expertise in handling complex treatments.
- By Type: Autologous stem cell therapies hold a larger market share than autologous non-stem cell therapies, reflecting the significant advancements in this area.
Autologous Stem Cell and Non-Stem Cell Based Therapies Industry Product Landscape
The product landscape is characterized by a diverse range of autologous stem cell and non-stem cell based therapies, each tailored to specific diseases and patient populations. Innovative products are emerging, showcasing improvements in cell processing, efficacy, and safety. Unique selling propositions include improved patient outcomes, reduced side effects, and personalized treatment approaches. Technological advancements are focused on enhancing cell viability, improving delivery mechanisms, and developing novel cell sources.
Key Drivers, Barriers & Challenges in Autologous Stem Cell and Non-Stem Cell Based Therapies Industry
Key Drivers:
- Rising prevalence of chronic diseases like cancer and cardiovascular disorders.
- Increasing demand for personalized medicine and advanced therapeutic options.
- Significant investments in R&D and clinical trials leading to product innovation.
Challenges & Restraints:
- High cost of treatment and limited insurance coverage.
- Stringent regulatory approval processes delaying market entry.
- Potential for adverse effects and safety concerns related to stem cell therapies.
- Competition from traditional therapies and the need to demonstrate superior efficacy.
Emerging Opportunities in Autologous Stem Cell and Non-Stem Cell Based Therapies Industry
Untapped markets in emerging economies represent a significant opportunity. Innovative applications in areas such as regenerative medicine and tissue engineering are expected to drive growth. Evolving consumer preferences toward personalized and targeted therapies will further expand the market.
Growth Accelerators in the Autologous Stem Cell and Non-Stem Cell Based Therapies Industry Industry
Technological breakthroughs, particularly in gene editing and cell manipulation, will significantly propel market growth. Strategic collaborations and partnerships between pharmaceutical companies and research institutions are fostering innovation and accelerating product development. Expanding into new geographic markets and broadening therapeutic applications will provide further growth opportunities.
Key Players Shaping the Autologous Stem Cell and Non-Stem Cell Based Therapies Industry Market
- Dendreon Pharmaceuticals LLC
- Cytori Therapeutics Inc
- Novartis International AG
- Caladrius Biosciences Inc
- BrainStorm Cell Limited
- Vericel Corp
- Gilead Sciences Inc
- Castle Creek Biosciences Inc
- US Stem Cell Inc
- Holostem Terapie Avanzate Srl
Notable Milestones in Autologous Stem Cell and Non-Stem Cell Based Therapies Industry Sector
- April 2022: Metcela acquired Japan Regenerative Medicine Co. Ltd, expanding its pipeline and clinical development infrastructure for regenerative medicine products.
- February 2022: US FDA approved CARVYKTI (ciltacabtagene autoleucel) for multiple myeloma treatment, showcasing significant advancements in autologous T-cell immunotherapy.
In-Depth Autologous Stem Cell and Non-Stem Cell Based Therapies Industry Market Outlook
The future of the autologous stem cell and non-stem cell based therapies market is promising, driven by continuous technological advancements, expanding therapeutic applications, and growing awareness among healthcare professionals and patients. Strategic partnerships, focused R&D efforts, and effective regulatory strategies will be crucial in unlocking the full market potential and addressing the challenges associated with this innovative sector. The market presents significant opportunities for both established players and emerging companies to capitalize on the increasing demand for personalized and effective therapeutic solutions.
Autologous Stem Cell and Non-Stem Cell Based Therapies Industry Segmentation
-
1. Type
- 1.1. Autologous Stem Cells
- 1.2. Autologous Non-Stem cells
-
2. Application
- 2.1. Cancer
- 2.2. Neurodegenerative Disorders
- 2.3. Cardiovascular Disease
- 2.4. Orthopedic Diseases
- 2.5. Other Applications
-
3. End User
- 3.1. Hospitals
- 3.2. Ambulatory Surgical Centers
- 3.3. Research Facilities
Autologous Stem Cell and Non-Stem Cell Based Therapies Industry Segmentation By Geography
-
1. North America
- 1.1. United States
- 1.2. Canada
- 1.3. Mexico
-
2. Europe
- 2.1. Germany
- 2.2. United Kingdom
- 2.3. France
- 2.4. Italy
- 2.5. Spain
- 2.6. Rest of Europe
-
3. Asia Pacific
- 3.1. China
- 3.2. Japan
- 3.3. India
- 3.4. Australia
- 3.5. South Korea
- 3.6. Rest of Asia Pacific
-
4. Middle East and Africa
- 4.1. GCC
- 4.2. South Africa
- 4.3. Rest of Middle East and Africa
-
5. South America
- 5.1. Brazil
- 5.2. Argentina
- 5.3. Rest of South America
Autologous Stem Cell and Non-Stem Cell Based Therapies Industry REPORT HIGHLIGHTS
| Aspects | Details |
|---|---|
| Study Period | 2019-2033 |
| Base Year | 2024 |
| Estimated Year | 2025 |
| Forecast Period | 2025-2033 |
| Historical Period | 2019-2024 |
| Growth Rate | CAGR of 14.26% from 2019-2033 |
| Segmentation |
|
Table of Contents
- 1. Introduction
- 1.1. Research Scope
- 1.2. Market Segmentation
- 1.3. Research Methodology
- 1.4. Definitions and Assumptions
- 2. Executive Summary
- 2.1. Introduction
- 3. Market Dynamics
- 3.1. Introduction
- 3.2. Market Drivers
- 3.2.1. Rising Prevalence of Targeted Diseases; Introduction of Novel Autologous Stem Cell Based Therapies in Regenerative Medicine; Increasing Geriatric Population
- 3.3. Market Restrains
- 3.3.1. High Cost of Autologous Cellular Therapies; Lack of Skilled Professionals
- 3.4. Market Trends
- 3.4.1. Cancer Segment Holds Significant Share in the Autologous Stem Cell and Non-Stem Cell Based Therapies Market
- 4. Market Factor Analysis
- 4.1. Porters Five Forces
- 4.2. Supply/Value Chain
- 4.3. PESTEL analysis
- 4.4. Market Entropy
- 4.5. Patent/Trademark Analysis
- 5. Global Autologous Stem Cell and Non-Stem Cell Based Therapies Industry Analysis, Insights and Forecast, 2019-2031
- 5.1. Market Analysis, Insights and Forecast - by Type
- 5.1.1. Autologous Stem Cells
- 5.1.2. Autologous Non-Stem cells
- 5.2. Market Analysis, Insights and Forecast - by Application
- 5.2.1. Cancer
- 5.2.2. Neurodegenerative Disorders
- 5.2.3. Cardiovascular Disease
- 5.2.4. Orthopedic Diseases
- 5.2.5. Other Applications
- 5.3. Market Analysis, Insights and Forecast - by End User
- 5.3.1. Hospitals
- 5.3.2. Ambulatory Surgical Centers
- 5.3.3. Research Facilities
- 5.4. Market Analysis, Insights and Forecast - by Region
- 5.4.1. North America
- 5.4.2. Europe
- 5.4.3. Asia Pacific
- 5.4.4. Middle East and Africa
- 5.4.5. South America
- 5.1. Market Analysis, Insights and Forecast - by Type
- 6. North America Autologous Stem Cell and Non-Stem Cell Based Therapies Industry Analysis, Insights and Forecast, 2019-2031
- 6.1. Market Analysis, Insights and Forecast - by Type
- 6.1.1. Autologous Stem Cells
- 6.1.2. Autologous Non-Stem cells
- 6.2. Market Analysis, Insights and Forecast - by Application
- 6.2.1. Cancer
- 6.2.2. Neurodegenerative Disorders
- 6.2.3. Cardiovascular Disease
- 6.2.4. Orthopedic Diseases
- 6.2.5. Other Applications
- 6.3. Market Analysis, Insights and Forecast - by End User
- 6.3.1. Hospitals
- 6.3.2. Ambulatory Surgical Centers
- 6.3.3. Research Facilities
- 6.1. Market Analysis, Insights and Forecast - by Type
- 7. Europe Autologous Stem Cell and Non-Stem Cell Based Therapies Industry Analysis, Insights and Forecast, 2019-2031
- 7.1. Market Analysis, Insights and Forecast - by Type
- 7.1.1. Autologous Stem Cells
- 7.1.2. Autologous Non-Stem cells
- 7.2. Market Analysis, Insights and Forecast - by Application
- 7.2.1. Cancer
- 7.2.2. Neurodegenerative Disorders
- 7.2.3. Cardiovascular Disease
- 7.2.4. Orthopedic Diseases
- 7.2.5. Other Applications
- 7.3. Market Analysis, Insights and Forecast - by End User
- 7.3.1. Hospitals
- 7.3.2. Ambulatory Surgical Centers
- 7.3.3. Research Facilities
- 7.1. Market Analysis, Insights and Forecast - by Type
- 8. Asia Pacific Autologous Stem Cell and Non-Stem Cell Based Therapies Industry Analysis, Insights and Forecast, 2019-2031
- 8.1. Market Analysis, Insights and Forecast - by Type
- 8.1.1. Autologous Stem Cells
- 8.1.2. Autologous Non-Stem cells
- 8.2. Market Analysis, Insights and Forecast - by Application
- 8.2.1. Cancer
- 8.2.2. Neurodegenerative Disorders
- 8.2.3. Cardiovascular Disease
- 8.2.4. Orthopedic Diseases
- 8.2.5. Other Applications
- 8.3. Market Analysis, Insights and Forecast - by End User
- 8.3.1. Hospitals
- 8.3.2. Ambulatory Surgical Centers
- 8.3.3. Research Facilities
- 8.1. Market Analysis, Insights and Forecast - by Type
- 9. Middle East and Africa Autologous Stem Cell and Non-Stem Cell Based Therapies Industry Analysis, Insights and Forecast, 2019-2031
- 9.1. Market Analysis, Insights and Forecast - by Type
- 9.1.1. Autologous Stem Cells
- 9.1.2. Autologous Non-Stem cells
- 9.2. Market Analysis, Insights and Forecast - by Application
- 9.2.1. Cancer
- 9.2.2. Neurodegenerative Disorders
- 9.2.3. Cardiovascular Disease
- 9.2.4. Orthopedic Diseases
- 9.2.5. Other Applications
- 9.3. Market Analysis, Insights and Forecast - by End User
- 9.3.1. Hospitals
- 9.3.2. Ambulatory Surgical Centers
- 9.3.3. Research Facilities
- 9.1. Market Analysis, Insights and Forecast - by Type
- 10. South America Autologous Stem Cell and Non-Stem Cell Based Therapies Industry Analysis, Insights and Forecast, 2019-2031
- 10.1. Market Analysis, Insights and Forecast - by Type
- 10.1.1. Autologous Stem Cells
- 10.1.2. Autologous Non-Stem cells
- 10.2. Market Analysis, Insights and Forecast - by Application
- 10.2.1. Cancer
- 10.2.2. Neurodegenerative Disorders
- 10.2.3. Cardiovascular Disease
- 10.2.4. Orthopedic Diseases
- 10.2.5. Other Applications
- 10.3. Market Analysis, Insights and Forecast - by End User
- 10.3.1. Hospitals
- 10.3.2. Ambulatory Surgical Centers
- 10.3.3. Research Facilities
- 10.1. Market Analysis, Insights and Forecast - by Type
- 11. North America Autologous Stem Cell and Non-Stem Cell Based Therapies Industry Analysis, Insights and Forecast, 2019-2031
- 11.1. Market Analysis, Insights and Forecast - By Country/Sub-region
- 11.1.1 United States
- 11.1.2 Canada
- 11.1.3 Mexico
- 12. Europe Autologous Stem Cell and Non-Stem Cell Based Therapies Industry Analysis, Insights and Forecast, 2019-2031
- 12.1. Market Analysis, Insights and Forecast - By Country/Sub-region
- 12.1.1 Germany
- 12.1.2 United Kingdom
- 12.1.3 France
- 12.1.4 Italy
- 12.1.5 Spain
- 12.1.6 Rest of Europe
- 13. Asia Pacific Autologous Stem Cell and Non-Stem Cell Based Therapies Industry Analysis, Insights and Forecast, 2019-2031
- 13.1. Market Analysis, Insights and Forecast - By Country/Sub-region
- 13.1.1 China
- 13.1.2 Japan
- 13.1.3 India
- 13.1.4 Australia
- 13.1.5 South Korea
- 13.1.6 Rest of Asia Pacific
- 14. Middle East and Africa Autologous Stem Cell and Non-Stem Cell Based Therapies Industry Analysis, Insights and Forecast, 2019-2031
- 14.1. Market Analysis, Insights and Forecast - By Country/Sub-region
- 14.1.1 GCC
- 14.1.2 South Africa
- 14.1.3 Rest of Middle East and Africa
- 15. South America Autologous Stem Cell and Non-Stem Cell Based Therapies Industry Analysis, Insights and Forecast, 2019-2031
- 15.1. Market Analysis, Insights and Forecast - By Country/Sub-region
- 15.1.1 Brazil
- 15.1.2 Argentina
- 15.1.3 Rest of South America
- 16. Competitive Analysis
- 16.1. Global Market Share Analysis 2024
- 16.2. Company Profiles
- 16.2.1 Dendreon Pharmaceuticals LLC
- 16.2.1.1. Overview
- 16.2.1.2. Products
- 16.2.1.3. SWOT Analysis
- 16.2.1.4. Recent Developments
- 16.2.1.5. Financials (Based on Availability)
- 16.2.2 Cytori Therapeutics Inc
- 16.2.2.1. Overview
- 16.2.2.2. Products
- 16.2.2.3. SWOT Analysis
- 16.2.2.4. Recent Developments
- 16.2.2.5. Financials (Based on Availability)
- 16.2.3 Novartis International AG
- 16.2.3.1. Overview
- 16.2.3.2. Products
- 16.2.3.3. SWOT Analysis
- 16.2.3.4. Recent Developments
- 16.2.3.5. Financials (Based on Availability)
- 16.2.4 Caladrius Biosciences Inc
- 16.2.4.1. Overview
- 16.2.4.2. Products
- 16.2.4.3. SWOT Analysis
- 16.2.4.4. Recent Developments
- 16.2.4.5. Financials (Based on Availability)
- 16.2.5 BrainStorm Cell Limited
- 16.2.5.1. Overview
- 16.2.5.2. Products
- 16.2.5.3. SWOT Analysis
- 16.2.5.4. Recent Developments
- 16.2.5.5. Financials (Based on Availability)
- 16.2.6 Vericel Corp
- 16.2.6.1. Overview
- 16.2.6.2. Products
- 16.2.6.3. SWOT Analysis
- 16.2.6.4. Recent Developments
- 16.2.6.5. Financials (Based on Availability)
- 16.2.7 Gilead Sciences Inc
- 16.2.7.1. Overview
- 16.2.7.2. Products
- 16.2.7.3. SWOT Analysis
- 16.2.7.4. Recent Developments
- 16.2.7.5. Financials (Based on Availability)
- 16.2.8 Castle Creek Biosciences Inc
- 16.2.8.1. Overview
- 16.2.8.2. Products
- 16.2.8.3. SWOT Analysis
- 16.2.8.4. Recent Developments
- 16.2.8.5. Financials (Based on Availability)
- 16.2.9 US Stem Cell Inc
- 16.2.9.1. Overview
- 16.2.9.2. Products
- 16.2.9.3. SWOT Analysis
- 16.2.9.4. Recent Developments
- 16.2.9.5. Financials (Based on Availability)
- 16.2.10 Holostem Terapie Avanzate Srl
- 16.2.10.1. Overview
- 16.2.10.2. Products
- 16.2.10.3. SWOT Analysis
- 16.2.10.4. Recent Developments
- 16.2.10.5. Financials (Based on Availability)
- 16.2.1 Dendreon Pharmaceuticals LLC
List of Figures
- Figure 1: Global Autologous Stem Cell and Non-Stem Cell Based Therapies Industry Revenue Breakdown (Million, %) by Region 2024 & 2032
- Figure 2: Global Autologous Stem Cell and Non-Stem Cell Based Therapies Industry Volume Breakdown (K Unit, %) by Region 2024 & 2032
- Figure 3: North America Autologous Stem Cell and Non-Stem Cell Based Therapies Industry Revenue (Million), by Country 2024 & 2032
- Figure 4: North America Autologous Stem Cell and Non-Stem Cell Based Therapies Industry Volume (K Unit), by Country 2024 & 2032
- Figure 5: North America Autologous Stem Cell and Non-Stem Cell Based Therapies Industry Revenue Share (%), by Country 2024 & 2032
- Figure 6: North America Autologous Stem Cell and Non-Stem Cell Based Therapies Industry Volume Share (%), by Country 2024 & 2032
- Figure 7: Europe Autologous Stem Cell and Non-Stem Cell Based Therapies Industry Revenue (Million), by Country 2024 & 2032
- Figure 8: Europe Autologous Stem Cell and Non-Stem Cell Based Therapies Industry Volume (K Unit), by Country 2024 & 2032
- Figure 9: Europe Autologous Stem Cell and Non-Stem Cell Based Therapies Industry Revenue Share (%), by Country 2024 & 2032
- Figure 10: Europe Autologous Stem Cell and Non-Stem Cell Based Therapies Industry Volume Share (%), by Country 2024 & 2032
- Figure 11: Asia Pacific Autologous Stem Cell and Non-Stem Cell Based Therapies Industry Revenue (Million), by Country 2024 & 2032
- Figure 12: Asia Pacific Autologous Stem Cell and Non-Stem Cell Based Therapies Industry Volume (K Unit), by Country 2024 & 2032
- Figure 13: Asia Pacific Autologous Stem Cell and Non-Stem Cell Based Therapies Industry Revenue Share (%), by Country 2024 & 2032
- Figure 14: Asia Pacific Autologous Stem Cell and Non-Stem Cell Based Therapies Industry Volume Share (%), by Country 2024 & 2032
- Figure 15: Middle East and Africa Autologous Stem Cell and Non-Stem Cell Based Therapies Industry Revenue (Million), by Country 2024 & 2032
- Figure 16: Middle East and Africa Autologous Stem Cell and Non-Stem Cell Based Therapies Industry Volume (K Unit), by Country 2024 & 2032
- Figure 17: Middle East and Africa Autologous Stem Cell and Non-Stem Cell Based Therapies Industry Revenue Share (%), by Country 2024 & 2032
- Figure 18: Middle East and Africa Autologous Stem Cell and Non-Stem Cell Based Therapies Industry Volume Share (%), by Country 2024 & 2032
- Figure 19: South America Autologous Stem Cell and Non-Stem Cell Based Therapies Industry Revenue (Million), by Country 2024 & 2032
- Figure 20: South America Autologous Stem Cell and Non-Stem Cell Based Therapies Industry Volume (K Unit), by Country 2024 & 2032
- Figure 21: South America Autologous Stem Cell and Non-Stem Cell Based Therapies Industry Revenue Share (%), by Country 2024 & 2032
- Figure 22: South America Autologous Stem Cell and Non-Stem Cell Based Therapies Industry Volume Share (%), by Country 2024 & 2032
- Figure 23: North America Autologous Stem Cell and Non-Stem Cell Based Therapies Industry Revenue (Million), by Type 2024 & 2032
- Figure 24: North America Autologous Stem Cell and Non-Stem Cell Based Therapies Industry Volume (K Unit), by Type 2024 & 2032
- Figure 25: North America Autologous Stem Cell and Non-Stem Cell Based Therapies Industry Revenue Share (%), by Type 2024 & 2032
- Figure 26: North America Autologous Stem Cell and Non-Stem Cell Based Therapies Industry Volume Share (%), by Type 2024 & 2032
- Figure 27: North America Autologous Stem Cell and Non-Stem Cell Based Therapies Industry Revenue (Million), by Application 2024 & 2032
- Figure 28: North America Autologous Stem Cell and Non-Stem Cell Based Therapies Industry Volume (K Unit), by Application 2024 & 2032
- Figure 29: North America Autologous Stem Cell and Non-Stem Cell Based Therapies Industry Revenue Share (%), by Application 2024 & 2032
- Figure 30: North America Autologous Stem Cell and Non-Stem Cell Based Therapies Industry Volume Share (%), by Application 2024 & 2032
- Figure 31: North America Autologous Stem Cell and Non-Stem Cell Based Therapies Industry Revenue (Million), by End User 2024 & 2032
- Figure 32: North America Autologous Stem Cell and Non-Stem Cell Based Therapies Industry Volume (K Unit), by End User 2024 & 2032
- Figure 33: North America Autologous Stem Cell and Non-Stem Cell Based Therapies Industry Revenue Share (%), by End User 2024 & 2032
- Figure 34: North America Autologous Stem Cell and Non-Stem Cell Based Therapies Industry Volume Share (%), by End User 2024 & 2032
- Figure 35: North America Autologous Stem Cell and Non-Stem Cell Based Therapies Industry Revenue (Million), by Country 2024 & 2032
- Figure 36: North America Autologous Stem Cell and Non-Stem Cell Based Therapies Industry Volume (K Unit), by Country 2024 & 2032
- Figure 37: North America Autologous Stem Cell and Non-Stem Cell Based Therapies Industry Revenue Share (%), by Country 2024 & 2032
- Figure 38: North America Autologous Stem Cell and Non-Stem Cell Based Therapies Industry Volume Share (%), by Country 2024 & 2032
- Figure 39: Europe Autologous Stem Cell and Non-Stem Cell Based Therapies Industry Revenue (Million), by Type 2024 & 2032
- Figure 40: Europe Autologous Stem Cell and Non-Stem Cell Based Therapies Industry Volume (K Unit), by Type 2024 & 2032
- Figure 41: Europe Autologous Stem Cell and Non-Stem Cell Based Therapies Industry Revenue Share (%), by Type 2024 & 2032
- Figure 42: Europe Autologous Stem Cell and Non-Stem Cell Based Therapies Industry Volume Share (%), by Type 2024 & 2032
- Figure 43: Europe Autologous Stem Cell and Non-Stem Cell Based Therapies Industry Revenue (Million), by Application 2024 & 2032
- Figure 44: Europe Autologous Stem Cell and Non-Stem Cell Based Therapies Industry Volume (K Unit), by Application 2024 & 2032
- Figure 45: Europe Autologous Stem Cell and Non-Stem Cell Based Therapies Industry Revenue Share (%), by Application 2024 & 2032
- Figure 46: Europe Autologous Stem Cell and Non-Stem Cell Based Therapies Industry Volume Share (%), by Application 2024 & 2032
- Figure 47: Europe Autologous Stem Cell and Non-Stem Cell Based Therapies Industry Revenue (Million), by End User 2024 & 2032
- Figure 48: Europe Autologous Stem Cell and Non-Stem Cell Based Therapies Industry Volume (K Unit), by End User 2024 & 2032
- Figure 49: Europe Autologous Stem Cell and Non-Stem Cell Based Therapies Industry Revenue Share (%), by End User 2024 & 2032
- Figure 50: Europe Autologous Stem Cell and Non-Stem Cell Based Therapies Industry Volume Share (%), by End User 2024 & 2032
- Figure 51: Europe Autologous Stem Cell and Non-Stem Cell Based Therapies Industry Revenue (Million), by Country 2024 & 2032
- Figure 52: Europe Autologous Stem Cell and Non-Stem Cell Based Therapies Industry Volume (K Unit), by Country 2024 & 2032
- Figure 53: Europe Autologous Stem Cell and Non-Stem Cell Based Therapies Industry Revenue Share (%), by Country 2024 & 2032
- Figure 54: Europe Autologous Stem Cell and Non-Stem Cell Based Therapies Industry Volume Share (%), by Country 2024 & 2032
- Figure 55: Asia Pacific Autologous Stem Cell and Non-Stem Cell Based Therapies Industry Revenue (Million), by Type 2024 & 2032
- Figure 56: Asia Pacific Autologous Stem Cell and Non-Stem Cell Based Therapies Industry Volume (K Unit), by Type 2024 & 2032
- Figure 57: Asia Pacific Autologous Stem Cell and Non-Stem Cell Based Therapies Industry Revenue Share (%), by Type 2024 & 2032
- Figure 58: Asia Pacific Autologous Stem Cell and Non-Stem Cell Based Therapies Industry Volume Share (%), by Type 2024 & 2032
- Figure 59: Asia Pacific Autologous Stem Cell and Non-Stem Cell Based Therapies Industry Revenue (Million), by Application 2024 & 2032
- Figure 60: Asia Pacific Autologous Stem Cell and Non-Stem Cell Based Therapies Industry Volume (K Unit), by Application 2024 & 2032
- Figure 61: Asia Pacific Autologous Stem Cell and Non-Stem Cell Based Therapies Industry Revenue Share (%), by Application 2024 & 2032
- Figure 62: Asia Pacific Autologous Stem Cell and Non-Stem Cell Based Therapies Industry Volume Share (%), by Application 2024 & 2032
- Figure 63: Asia Pacific Autologous Stem Cell and Non-Stem Cell Based Therapies Industry Revenue (Million), by End User 2024 & 2032
- Figure 64: Asia Pacific Autologous Stem Cell and Non-Stem Cell Based Therapies Industry Volume (K Unit), by End User 2024 & 2032
- Figure 65: Asia Pacific Autologous Stem Cell and Non-Stem Cell Based Therapies Industry Revenue Share (%), by End User 2024 & 2032
- Figure 66: Asia Pacific Autologous Stem Cell and Non-Stem Cell Based Therapies Industry Volume Share (%), by End User 2024 & 2032
- Figure 67: Asia Pacific Autologous Stem Cell and Non-Stem Cell Based Therapies Industry Revenue (Million), by Country 2024 & 2032
- Figure 68: Asia Pacific Autologous Stem Cell and Non-Stem Cell Based Therapies Industry Volume (K Unit), by Country 2024 & 2032
- Figure 69: Asia Pacific Autologous Stem Cell and Non-Stem Cell Based Therapies Industry Revenue Share (%), by Country 2024 & 2032
- Figure 70: Asia Pacific Autologous Stem Cell and Non-Stem Cell Based Therapies Industry Volume Share (%), by Country 2024 & 2032
- Figure 71: Middle East and Africa Autologous Stem Cell and Non-Stem Cell Based Therapies Industry Revenue (Million), by Type 2024 & 2032
- Figure 72: Middle East and Africa Autologous Stem Cell and Non-Stem Cell Based Therapies Industry Volume (K Unit), by Type 2024 & 2032
- Figure 73: Middle East and Africa Autologous Stem Cell and Non-Stem Cell Based Therapies Industry Revenue Share (%), by Type 2024 & 2032
- Figure 74: Middle East and Africa Autologous Stem Cell and Non-Stem Cell Based Therapies Industry Volume Share (%), by Type 2024 & 2032
- Figure 75: Middle East and Africa Autologous Stem Cell and Non-Stem Cell Based Therapies Industry Revenue (Million), by Application 2024 & 2032
- Figure 76: Middle East and Africa Autologous Stem Cell and Non-Stem Cell Based Therapies Industry Volume (K Unit), by Application 2024 & 2032
- Figure 77: Middle East and Africa Autologous Stem Cell and Non-Stem Cell Based Therapies Industry Revenue Share (%), by Application 2024 & 2032
- Figure 78: Middle East and Africa Autologous Stem Cell and Non-Stem Cell Based Therapies Industry Volume Share (%), by Application 2024 & 2032
- Figure 79: Middle East and Africa Autologous Stem Cell and Non-Stem Cell Based Therapies Industry Revenue (Million), by End User 2024 & 2032
- Figure 80: Middle East and Africa Autologous Stem Cell and Non-Stem Cell Based Therapies Industry Volume (K Unit), by End User 2024 & 2032
- Figure 81: Middle East and Africa Autologous Stem Cell and Non-Stem Cell Based Therapies Industry Revenue Share (%), by End User 2024 & 2032
- Figure 82: Middle East and Africa Autologous Stem Cell and Non-Stem Cell Based Therapies Industry Volume Share (%), by End User 2024 & 2032
- Figure 83: Middle East and Africa Autologous Stem Cell and Non-Stem Cell Based Therapies Industry Revenue (Million), by Country 2024 & 2032
- Figure 84: Middle East and Africa Autologous Stem Cell and Non-Stem Cell Based Therapies Industry Volume (K Unit), by Country 2024 & 2032
- Figure 85: Middle East and Africa Autologous Stem Cell and Non-Stem Cell Based Therapies Industry Revenue Share (%), by Country 2024 & 2032
- Figure 86: Middle East and Africa Autologous Stem Cell and Non-Stem Cell Based Therapies Industry Volume Share (%), by Country 2024 & 2032
- Figure 87: South America Autologous Stem Cell and Non-Stem Cell Based Therapies Industry Revenue (Million), by Type 2024 & 2032
- Figure 88: South America Autologous Stem Cell and Non-Stem Cell Based Therapies Industry Volume (K Unit), by Type 2024 & 2032
- Figure 89: South America Autologous Stem Cell and Non-Stem Cell Based Therapies Industry Revenue Share (%), by Type 2024 & 2032
- Figure 90: South America Autologous Stem Cell and Non-Stem Cell Based Therapies Industry Volume Share (%), by Type 2024 & 2032
- Figure 91: South America Autologous Stem Cell and Non-Stem Cell Based Therapies Industry Revenue (Million), by Application 2024 & 2032
- Figure 92: South America Autologous Stem Cell and Non-Stem Cell Based Therapies Industry Volume (K Unit), by Application 2024 & 2032
- Figure 93: South America Autologous Stem Cell and Non-Stem Cell Based Therapies Industry Revenue Share (%), by Application 2024 & 2032
- Figure 94: South America Autologous Stem Cell and Non-Stem Cell Based Therapies Industry Volume Share (%), by Application 2024 & 2032
- Figure 95: South America Autologous Stem Cell and Non-Stem Cell Based Therapies Industry Revenue (Million), by End User 2024 & 2032
- Figure 96: South America Autologous Stem Cell and Non-Stem Cell Based Therapies Industry Volume (K Unit), by End User 2024 & 2032
- Figure 97: South America Autologous Stem Cell and Non-Stem Cell Based Therapies Industry Revenue Share (%), by End User 2024 & 2032
- Figure 98: South America Autologous Stem Cell and Non-Stem Cell Based Therapies Industry Volume Share (%), by End User 2024 & 2032
- Figure 99: South America Autologous Stem Cell and Non-Stem Cell Based Therapies Industry Revenue (Million), by Country 2024 & 2032
- Figure 100: South America Autologous Stem Cell and Non-Stem Cell Based Therapies Industry Volume (K Unit), by Country 2024 & 2032
- Figure 101: South America Autologous Stem Cell and Non-Stem Cell Based Therapies Industry Revenue Share (%), by Country 2024 & 2032
- Figure 102: South America Autologous Stem Cell and Non-Stem Cell Based Therapies Industry Volume Share (%), by Country 2024 & 2032
List of Tables
- Table 1: Global Autologous Stem Cell and Non-Stem Cell Based Therapies Industry Revenue Million Forecast, by Region 2019 & 2032
- Table 2: Global Autologous Stem Cell and Non-Stem Cell Based Therapies Industry Volume K Unit Forecast, by Region 2019 & 2032
- Table 3: Global Autologous Stem Cell and Non-Stem Cell Based Therapies Industry Revenue Million Forecast, by Type 2019 & 2032
- Table 4: Global Autologous Stem Cell and Non-Stem Cell Based Therapies Industry Volume K Unit Forecast, by Type 2019 & 2032
- Table 5: Global Autologous Stem Cell and Non-Stem Cell Based Therapies Industry Revenue Million Forecast, by Application 2019 & 2032
- Table 6: Global Autologous Stem Cell and Non-Stem Cell Based Therapies Industry Volume K Unit Forecast, by Application 2019 & 2032
- Table 7: Global Autologous Stem Cell and Non-Stem Cell Based Therapies Industry Revenue Million Forecast, by End User 2019 & 2032
- Table 8: Global Autologous Stem Cell and Non-Stem Cell Based Therapies Industry Volume K Unit Forecast, by End User 2019 & 2032
- Table 9: Global Autologous Stem Cell and Non-Stem Cell Based Therapies Industry Revenue Million Forecast, by Region 2019 & 2032
- Table 10: Global Autologous Stem Cell and Non-Stem Cell Based Therapies Industry Volume K Unit Forecast, by Region 2019 & 2032
- Table 11: Global Autologous Stem Cell and Non-Stem Cell Based Therapies Industry Revenue Million Forecast, by Country 2019 & 2032
- Table 12: Global Autologous Stem Cell and Non-Stem Cell Based Therapies Industry Volume K Unit Forecast, by Country 2019 & 2032
- Table 13: United States Autologous Stem Cell and Non-Stem Cell Based Therapies Industry Revenue (Million) Forecast, by Application 2019 & 2032
- Table 14: United States Autologous Stem Cell and Non-Stem Cell Based Therapies Industry Volume (K Unit) Forecast, by Application 2019 & 2032
- Table 15: Canada Autologous Stem Cell and Non-Stem Cell Based Therapies Industry Revenue (Million) Forecast, by Application 2019 & 2032
- Table 16: Canada Autologous Stem Cell and Non-Stem Cell Based Therapies Industry Volume (K Unit) Forecast, by Application 2019 & 2032
- Table 17: Mexico Autologous Stem Cell and Non-Stem Cell Based Therapies Industry Revenue (Million) Forecast, by Application 2019 & 2032
- Table 18: Mexico Autologous Stem Cell and Non-Stem Cell Based Therapies Industry Volume (K Unit) Forecast, by Application 2019 & 2032
- Table 19: Global Autologous Stem Cell and Non-Stem Cell Based Therapies Industry Revenue Million Forecast, by Country 2019 & 2032
- Table 20: Global Autologous Stem Cell and Non-Stem Cell Based Therapies Industry Volume K Unit Forecast, by Country 2019 & 2032
- Table 21: Germany Autologous Stem Cell and Non-Stem Cell Based Therapies Industry Revenue (Million) Forecast, by Application 2019 & 2032
- Table 22: Germany Autologous Stem Cell and Non-Stem Cell Based Therapies Industry Volume (K Unit) Forecast, by Application 2019 & 2032
- Table 23: United Kingdom Autologous Stem Cell and Non-Stem Cell Based Therapies Industry Revenue (Million) Forecast, by Application 2019 & 2032
- Table 24: United Kingdom Autologous Stem Cell and Non-Stem Cell Based Therapies Industry Volume (K Unit) Forecast, by Application 2019 & 2032
- Table 25: France Autologous Stem Cell and Non-Stem Cell Based Therapies Industry Revenue (Million) Forecast, by Application 2019 & 2032
- Table 26: France Autologous Stem Cell and Non-Stem Cell Based Therapies Industry Volume (K Unit) Forecast, by Application 2019 & 2032
- Table 27: Italy Autologous Stem Cell and Non-Stem Cell Based Therapies Industry Revenue (Million) Forecast, by Application 2019 & 2032
- Table 28: Italy Autologous Stem Cell and Non-Stem Cell Based Therapies Industry Volume (K Unit) Forecast, by Application 2019 & 2032
- Table 29: Spain Autologous Stem Cell and Non-Stem Cell Based Therapies Industry Revenue (Million) Forecast, by Application 2019 & 2032
- Table 30: Spain Autologous Stem Cell and Non-Stem Cell Based Therapies Industry Volume (K Unit) Forecast, by Application 2019 & 2032
- Table 31: Rest of Europe Autologous Stem Cell and Non-Stem Cell Based Therapies Industry Revenue (Million) Forecast, by Application 2019 & 2032
- Table 32: Rest of Europe Autologous Stem Cell and Non-Stem Cell Based Therapies Industry Volume (K Unit) Forecast, by Application 2019 & 2032
- Table 33: Global Autologous Stem Cell and Non-Stem Cell Based Therapies Industry Revenue Million Forecast, by Country 2019 & 2032
- Table 34: Global Autologous Stem Cell and Non-Stem Cell Based Therapies Industry Volume K Unit Forecast, by Country 2019 & 2032
- Table 35: China Autologous Stem Cell and Non-Stem Cell Based Therapies Industry Revenue (Million) Forecast, by Application 2019 & 2032
- Table 36: China Autologous Stem Cell and Non-Stem Cell Based Therapies Industry Volume (K Unit) Forecast, by Application 2019 & 2032
- Table 37: Japan Autologous Stem Cell and Non-Stem Cell Based Therapies Industry Revenue (Million) Forecast, by Application 2019 & 2032
- Table 38: Japan Autologous Stem Cell and Non-Stem Cell Based Therapies Industry Volume (K Unit) Forecast, by Application 2019 & 2032
- Table 39: India Autologous Stem Cell and Non-Stem Cell Based Therapies Industry Revenue (Million) Forecast, by Application 2019 & 2032
- Table 40: India Autologous Stem Cell and Non-Stem Cell Based Therapies Industry Volume (K Unit) Forecast, by Application 2019 & 2032
- Table 41: Australia Autologous Stem Cell and Non-Stem Cell Based Therapies Industry Revenue (Million) Forecast, by Application 2019 & 2032
- Table 42: Australia Autologous Stem Cell and Non-Stem Cell Based Therapies Industry Volume (K Unit) Forecast, by Application 2019 & 2032
- Table 43: South Korea Autologous Stem Cell and Non-Stem Cell Based Therapies Industry Revenue (Million) Forecast, by Application 2019 & 2032
- Table 44: South Korea Autologous Stem Cell and Non-Stem Cell Based Therapies Industry Volume (K Unit) Forecast, by Application 2019 & 2032
- Table 45: Rest of Asia Pacific Autologous Stem Cell and Non-Stem Cell Based Therapies Industry Revenue (Million) Forecast, by Application 2019 & 2032
- Table 46: Rest of Asia Pacific Autologous Stem Cell and Non-Stem Cell Based Therapies Industry Volume (K Unit) Forecast, by Application 2019 & 2032
- Table 47: Global Autologous Stem Cell and Non-Stem Cell Based Therapies Industry Revenue Million Forecast, by Country 2019 & 2032
- Table 48: Global Autologous Stem Cell and Non-Stem Cell Based Therapies Industry Volume K Unit Forecast, by Country 2019 & 2032
- Table 49: GCC Autologous Stem Cell and Non-Stem Cell Based Therapies Industry Revenue (Million) Forecast, by Application 2019 & 2032
- Table 50: GCC Autologous Stem Cell and Non-Stem Cell Based Therapies Industry Volume (K Unit) Forecast, by Application 2019 & 2032
- Table 51: South Africa Autologous Stem Cell and Non-Stem Cell Based Therapies Industry Revenue (Million) Forecast, by Application 2019 & 2032
- Table 52: South Africa Autologous Stem Cell and Non-Stem Cell Based Therapies Industry Volume (K Unit) Forecast, by Application 2019 & 2032
- Table 53: Rest of Middle East and Africa Autologous Stem Cell and Non-Stem Cell Based Therapies Industry Revenue (Million) Forecast, by Application 2019 & 2032
- Table 54: Rest of Middle East and Africa Autologous Stem Cell and Non-Stem Cell Based Therapies Industry Volume (K Unit) Forecast, by Application 2019 & 2032
- Table 55: Global Autologous Stem Cell and Non-Stem Cell Based Therapies Industry Revenue Million Forecast, by Country 2019 & 2032
- Table 56: Global Autologous Stem Cell and Non-Stem Cell Based Therapies Industry Volume K Unit Forecast, by Country 2019 & 2032
- Table 57: Brazil Autologous Stem Cell and Non-Stem Cell Based Therapies Industry Revenue (Million) Forecast, by Application 2019 & 2032
- Table 58: Brazil Autologous Stem Cell and Non-Stem Cell Based Therapies Industry Volume (K Unit) Forecast, by Application 2019 & 2032
- Table 59: Argentina Autologous Stem Cell and Non-Stem Cell Based Therapies Industry Revenue (Million) Forecast, by Application 2019 & 2032
- Table 60: Argentina Autologous Stem Cell and Non-Stem Cell Based Therapies Industry Volume (K Unit) Forecast, by Application 2019 & 2032
- Table 61: Rest of South America Autologous Stem Cell and Non-Stem Cell Based Therapies Industry Revenue (Million) Forecast, by Application 2019 & 2032
- Table 62: Rest of South America Autologous Stem Cell and Non-Stem Cell Based Therapies Industry Volume (K Unit) Forecast, by Application 2019 & 2032
- Table 63: Global Autologous Stem Cell and Non-Stem Cell Based Therapies Industry Revenue Million Forecast, by Type 2019 & 2032
- Table 64: Global Autologous Stem Cell and Non-Stem Cell Based Therapies Industry Volume K Unit Forecast, by Type 2019 & 2032
- Table 65: Global Autologous Stem Cell and Non-Stem Cell Based Therapies Industry Revenue Million Forecast, by Application 2019 & 2032
- Table 66: Global Autologous Stem Cell and Non-Stem Cell Based Therapies Industry Volume K Unit Forecast, by Application 2019 & 2032
- Table 67: Global Autologous Stem Cell and Non-Stem Cell Based Therapies Industry Revenue Million Forecast, by End User 2019 & 2032
- Table 68: Global Autologous Stem Cell and Non-Stem Cell Based Therapies Industry Volume K Unit Forecast, by End User 2019 & 2032
- Table 69: Global Autologous Stem Cell and Non-Stem Cell Based Therapies Industry Revenue Million Forecast, by Country 2019 & 2032
- Table 70: Global Autologous Stem Cell and Non-Stem Cell Based Therapies Industry Volume K Unit Forecast, by Country 2019 & 2032
- Table 71: United States Autologous Stem Cell and Non-Stem Cell Based Therapies Industry Revenue (Million) Forecast, by Application 2019 & 2032
- Table 72: United States Autologous Stem Cell and Non-Stem Cell Based Therapies Industry Volume (K Unit) Forecast, by Application 2019 & 2032
- Table 73: Canada Autologous Stem Cell and Non-Stem Cell Based Therapies Industry Revenue (Million) Forecast, by Application 2019 & 2032
- Table 74: Canada Autologous Stem Cell and Non-Stem Cell Based Therapies Industry Volume (K Unit) Forecast, by Application 2019 & 2032
- Table 75: Mexico Autologous Stem Cell and Non-Stem Cell Based Therapies Industry Revenue (Million) Forecast, by Application 2019 & 2032
- Table 76: Mexico Autologous Stem Cell and Non-Stem Cell Based Therapies Industry Volume (K Unit) Forecast, by Application 2019 & 2032
- Table 77: Global Autologous Stem Cell and Non-Stem Cell Based Therapies Industry Revenue Million Forecast, by Type 2019 & 2032
- Table 78: Global Autologous Stem Cell and Non-Stem Cell Based Therapies Industry Volume K Unit Forecast, by Type 2019 & 2032
- Table 79: Global Autologous Stem Cell and Non-Stem Cell Based Therapies Industry Revenue Million Forecast, by Application 2019 & 2032
- Table 80: Global Autologous Stem Cell and Non-Stem Cell Based Therapies Industry Volume K Unit Forecast, by Application 2019 & 2032
- Table 81: Global Autologous Stem Cell and Non-Stem Cell Based Therapies Industry Revenue Million Forecast, by End User 2019 & 2032
- Table 82: Global Autologous Stem Cell and Non-Stem Cell Based Therapies Industry Volume K Unit Forecast, by End User 2019 & 2032
- Table 83: Global Autologous Stem Cell and Non-Stem Cell Based Therapies Industry Revenue Million Forecast, by Country 2019 & 2032
- Table 84: Global Autologous Stem Cell and Non-Stem Cell Based Therapies Industry Volume K Unit Forecast, by Country 2019 & 2032
- Table 85: Germany Autologous Stem Cell and Non-Stem Cell Based Therapies Industry Revenue (Million) Forecast, by Application 2019 & 2032
- Table 86: Germany Autologous Stem Cell and Non-Stem Cell Based Therapies Industry Volume (K Unit) Forecast, by Application 2019 & 2032
- Table 87: United Kingdom Autologous Stem Cell and Non-Stem Cell Based Therapies Industry Revenue (Million) Forecast, by Application 2019 & 2032
- Table 88: United Kingdom Autologous Stem Cell and Non-Stem Cell Based Therapies Industry Volume (K Unit) Forecast, by Application 2019 & 2032
- Table 89: France Autologous Stem Cell and Non-Stem Cell Based Therapies Industry Revenue (Million) Forecast, by Application 2019 & 2032
- Table 90: France Autologous Stem Cell and Non-Stem Cell Based Therapies Industry Volume (K Unit) Forecast, by Application 2019 & 2032
- Table 91: Italy Autologous Stem Cell and Non-Stem Cell Based Therapies Industry Revenue (Million) Forecast, by Application 2019 & 2032
- Table 92: Italy Autologous Stem Cell and Non-Stem Cell Based Therapies Industry Volume (K Unit) Forecast, by Application 2019 & 2032
- Table 93: Spain Autologous Stem Cell and Non-Stem Cell Based Therapies Industry Revenue (Million) Forecast, by Application 2019 & 2032
- Table 94: Spain Autologous Stem Cell and Non-Stem Cell Based Therapies Industry Volume (K Unit) Forecast, by Application 2019 & 2032
- Table 95: Rest of Europe Autologous Stem Cell and Non-Stem Cell Based Therapies Industry Revenue (Million) Forecast, by Application 2019 & 2032
- Table 96: Rest of Europe Autologous Stem Cell and Non-Stem Cell Based Therapies Industry Volume (K Unit) Forecast, by Application 2019 & 2032
- Table 97: Global Autologous Stem Cell and Non-Stem Cell Based Therapies Industry Revenue Million Forecast, by Type 2019 & 2032
- Table 98: Global Autologous Stem Cell and Non-Stem Cell Based Therapies Industry Volume K Unit Forecast, by Type 2019 & 2032
- Table 99: Global Autologous Stem Cell and Non-Stem Cell Based Therapies Industry Revenue Million Forecast, by Application 2019 & 2032
- Table 100: Global Autologous Stem Cell and Non-Stem Cell Based Therapies Industry Volume K Unit Forecast, by Application 2019 & 2032
- Table 101: Global Autologous Stem Cell and Non-Stem Cell Based Therapies Industry Revenue Million Forecast, by End User 2019 & 2032
- Table 102: Global Autologous Stem Cell and Non-Stem Cell Based Therapies Industry Volume K Unit Forecast, by End User 2019 & 2032
- Table 103: Global Autologous Stem Cell and Non-Stem Cell Based Therapies Industry Revenue Million Forecast, by Country 2019 & 2032
- Table 104: Global Autologous Stem Cell and Non-Stem Cell Based Therapies Industry Volume K Unit Forecast, by Country 2019 & 2032
- Table 105: China Autologous Stem Cell and Non-Stem Cell Based Therapies Industry Revenue (Million) Forecast, by Application 2019 & 2032
- Table 106: China Autologous Stem Cell and Non-Stem Cell Based Therapies Industry Volume (K Unit) Forecast, by Application 2019 & 2032
- Table 107: Japan Autologous Stem Cell and Non-Stem Cell Based Therapies Industry Revenue (Million) Forecast, by Application 2019 & 2032
- Table 108: Japan Autologous Stem Cell and Non-Stem Cell Based Therapies Industry Volume (K Unit) Forecast, by Application 2019 & 2032
- Table 109: India Autologous Stem Cell and Non-Stem Cell Based Therapies Industry Revenue (Million) Forecast, by Application 2019 & 2032
- Table 110: India Autologous Stem Cell and Non-Stem Cell Based Therapies Industry Volume (K Unit) Forecast, by Application 2019 & 2032
- Table 111: Australia Autologous Stem Cell and Non-Stem Cell Based Therapies Industry Revenue (Million) Forecast, by Application 2019 & 2032
- Table 112: Australia Autologous Stem Cell and Non-Stem Cell Based Therapies Industry Volume (K Unit) Forecast, by Application 2019 & 2032
- Table 113: South Korea Autologous Stem Cell and Non-Stem Cell Based Therapies Industry Revenue (Million) Forecast, by Application 2019 & 2032
- Table 114: South Korea Autologous Stem Cell and Non-Stem Cell Based Therapies Industry Volume (K Unit) Forecast, by Application 2019 & 2032
- Table 115: Rest of Asia Pacific Autologous Stem Cell and Non-Stem Cell Based Therapies Industry Revenue (Million) Forecast, by Application 2019 & 2032
- Table 116: Rest of Asia Pacific Autologous Stem Cell and Non-Stem Cell Based Therapies Industry Volume (K Unit) Forecast, by Application 2019 & 2032
- Table 117: Global Autologous Stem Cell and Non-Stem Cell Based Therapies Industry Revenue Million Forecast, by Type 2019 & 2032
- Table 118: Global Autologous Stem Cell and Non-Stem Cell Based Therapies Industry Volume K Unit Forecast, by Type 2019 & 2032
- Table 119: Global Autologous Stem Cell and Non-Stem Cell Based Therapies Industry Revenue Million Forecast, by Application 2019 & 2032
- Table 120: Global Autologous Stem Cell and Non-Stem Cell Based Therapies Industry Volume K Unit Forecast, by Application 2019 & 2032
- Table 121: Global Autologous Stem Cell and Non-Stem Cell Based Therapies Industry Revenue Million Forecast, by End User 2019 & 2032
- Table 122: Global Autologous Stem Cell and Non-Stem Cell Based Therapies Industry Volume K Unit Forecast, by End User 2019 & 2032
- Table 123: Global Autologous Stem Cell and Non-Stem Cell Based Therapies Industry Revenue Million Forecast, by Country 2019 & 2032
- Table 124: Global Autologous Stem Cell and Non-Stem Cell Based Therapies Industry Volume K Unit Forecast, by Country 2019 & 2032
- Table 125: GCC Autologous Stem Cell and Non-Stem Cell Based Therapies Industry Revenue (Million) Forecast, by Application 2019 & 2032
- Table 126: GCC Autologous Stem Cell and Non-Stem Cell Based Therapies Industry Volume (K Unit) Forecast, by Application 2019 & 2032
- Table 127: South Africa Autologous Stem Cell and Non-Stem Cell Based Therapies Industry Revenue (Million) Forecast, by Application 2019 & 2032
- Table 128: South Africa Autologous Stem Cell and Non-Stem Cell Based Therapies Industry Volume (K Unit) Forecast, by Application 2019 & 2032
- Table 129: Rest of Middle East and Africa Autologous Stem Cell and Non-Stem Cell Based Therapies Industry Revenue (Million) Forecast, by Application 2019 & 2032
- Table 130: Rest of Middle East and Africa Autologous Stem Cell and Non-Stem Cell Based Therapies Industry Volume (K Unit) Forecast, by Application 2019 & 2032
- Table 131: Global Autologous Stem Cell and Non-Stem Cell Based Therapies Industry Revenue Million Forecast, by Type 2019 & 2032
- Table 132: Global Autologous Stem Cell and Non-Stem Cell Based Therapies Industry Volume K Unit Forecast, by Type 2019 & 2032
- Table 133: Global Autologous Stem Cell and Non-Stem Cell Based Therapies Industry Revenue Million Forecast, by Application 2019 & 2032
- Table 134: Global Autologous Stem Cell and Non-Stem Cell Based Therapies Industry Volume K Unit Forecast, by Application 2019 & 2032
- Table 135: Global Autologous Stem Cell and Non-Stem Cell Based Therapies Industry Revenue Million Forecast, by End User 2019 & 2032
- Table 136: Global Autologous Stem Cell and Non-Stem Cell Based Therapies Industry Volume K Unit Forecast, by End User 2019 & 2032
- Table 137: Global Autologous Stem Cell and Non-Stem Cell Based Therapies Industry Revenue Million Forecast, by Country 2019 & 2032
- Table 138: Global Autologous Stem Cell and Non-Stem Cell Based Therapies Industry Volume K Unit Forecast, by Country 2019 & 2032
- Table 139: Brazil Autologous Stem Cell and Non-Stem Cell Based Therapies Industry Revenue (Million) Forecast, by Application 2019 & 2032
- Table 140: Brazil Autologous Stem Cell and Non-Stem Cell Based Therapies Industry Volume (K Unit) Forecast, by Application 2019 & 2032
- Table 141: Argentina Autologous Stem Cell and Non-Stem Cell Based Therapies Industry Revenue (Million) Forecast, by Application 2019 & 2032
- Table 142: Argentina Autologous Stem Cell and Non-Stem Cell Based Therapies Industry Volume (K Unit) Forecast, by Application 2019 & 2032
- Table 143: Rest of South America Autologous Stem Cell and Non-Stem Cell Based Therapies Industry Revenue (Million) Forecast, by Application 2019 & 2032
- Table 144: Rest of South America Autologous Stem Cell and Non-Stem Cell Based Therapies Industry Volume (K Unit) Forecast, by Application 2019 & 2032
Frequently Asked Questions
1. What is the projected Compound Annual Growth Rate (CAGR) of the Autologous Stem Cell and Non-Stem Cell Based Therapies Industry?
The projected CAGR is approximately 14.26%.
2. Which companies are prominent players in the Autologous Stem Cell and Non-Stem Cell Based Therapies Industry?
Key companies in the market include Dendreon Pharmaceuticals LLC, Cytori Therapeutics Inc, Novartis International AG, Caladrius Biosciences Inc, BrainStorm Cell Limited, Vericel Corp, Gilead Sciences Inc , Castle Creek Biosciences Inc, US Stem Cell Inc, Holostem Terapie Avanzate Srl.
3. What are the main segments of the Autologous Stem Cell and Non-Stem Cell Based Therapies Industry?
The market segments include Type, Application, End User.
4. Can you provide details about the market size?
The market size is estimated to be USD XX Million as of 2022.
5. What are some drivers contributing to market growth?
Rising Prevalence of Targeted Diseases; Introduction of Novel Autologous Stem Cell Based Therapies in Regenerative Medicine; Increasing Geriatric Population.
6. What are the notable trends driving market growth?
Cancer Segment Holds Significant Share in the Autologous Stem Cell and Non-Stem Cell Based Therapies Market.
7. Are there any restraints impacting market growth?
High Cost of Autologous Cellular Therapies; Lack of Skilled Professionals.
8. Can you provide examples of recent developments in the market?
In April 2022, Metcela acquired Japan Regenerative Medicine Co. Ltd to develop cardiac stem cell-based therapy. Through the acquisition, Metcela will add an autologous cell product for pediatric congenital heart disease to its pipeline and significantly strengthen its clinical development infrastructure for regenerative medicine products.
9. What pricing options are available for accessing the report?
Pricing options include single-user, multi-user, and enterprise licenses priced at USD 4750, USD 5250, and USD 8750 respectively.
10. Is the market size provided in terms of value or volume?
The market size is provided in terms of value, measured in Million and volume, measured in K Unit.
11. Are there any specific market keywords associated with the report?
Yes, the market keyword associated with the report is "Autologous Stem Cell and Non-Stem Cell Based Therapies Industry," which aids in identifying and referencing the specific market segment covered.
12. How do I determine which pricing option suits my needs best?
The pricing options vary based on user requirements and access needs. Individual users may opt for single-user licenses, while businesses requiring broader access may choose multi-user or enterprise licenses for cost-effective access to the report.
13. Are there any additional resources or data provided in the Autologous Stem Cell and Non-Stem Cell Based Therapies Industry report?
While the report offers comprehensive insights, it's advisable to review the specific contents or supplementary materials provided to ascertain if additional resources or data are available.
14. How can I stay updated on further developments or reports in the Autologous Stem Cell and Non-Stem Cell Based Therapies Industry?
To stay informed about further developments, trends, and reports in the Autologous Stem Cell and Non-Stem Cell Based Therapies Industry, consider subscribing to industry newsletters, following relevant companies and organizations, or regularly checking reputable industry news sources and publications.
Methodology
Step 1 - Identification of Relevant Samples Size from Population Database


Step 2 - Approaches for Defining Global Market Size (Value, Volume* & Price*)

Note*: In applicable scenarios
Step 3 - Data Sources
Primary Research
- Web Analytics
- Survey Reports
- Research Institute
- Latest Research Reports
- Opinion Leaders
Secondary Research
- Annual Reports
- White Paper
- Latest Press Release
- Industry Association
- Paid Database
- Investor Presentations

Step 4 - Data Triangulation
Involves using different sources of information in order to increase the validity of a study
These sources are likely to be stakeholders in a program - participants, other researchers, program staff, other community members, and so on.
Then we put all data in single framework & apply various statistical tools to find out the dynamic on the market.
During the analysis stage, feedback from the stakeholder groups would be compared to determine areas of agreement as well as areas of divergence


