

Key Insights
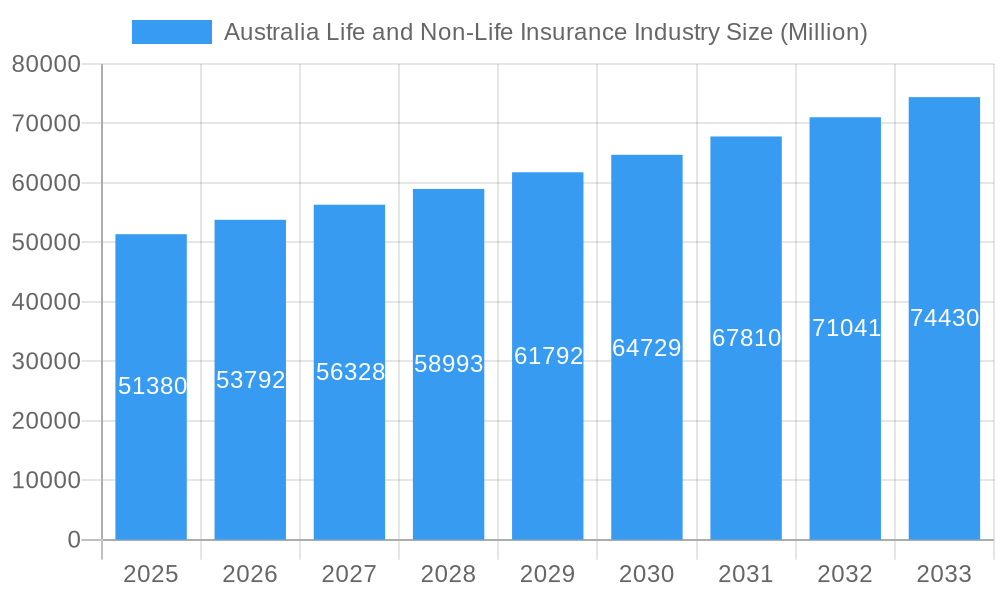
The Australian life and non-life insurance market, valued at $51.38 billion in 2025, is projected to experience steady growth, with a compound annual growth rate (CAGR) of 4.56% from 2025 to 2033. This growth is driven by several key factors. Increasing awareness of the need for financial protection against unforeseen events like health crises, natural disasters, and economic downturns is fueling demand for both life and non-life insurance products. Furthermore, the aging population in Australia contributes significantly to the market's expansion, particularly within the life insurance segment. Government regulations promoting financial literacy and encouraging insurance coverage also play a crucial role. The market is segmented by product type (life insurance, health insurance, general insurance, etc.), distribution channels (online, agents, brokers), and customer demographics. Competition is intense, with major players like Insurance Australia Group, Suncorp Group, AIA Group, and Medibank Private dominating the market. These companies are investing heavily in digital platforms, technological advancements, and personalized offerings to enhance customer experience and gain market share.
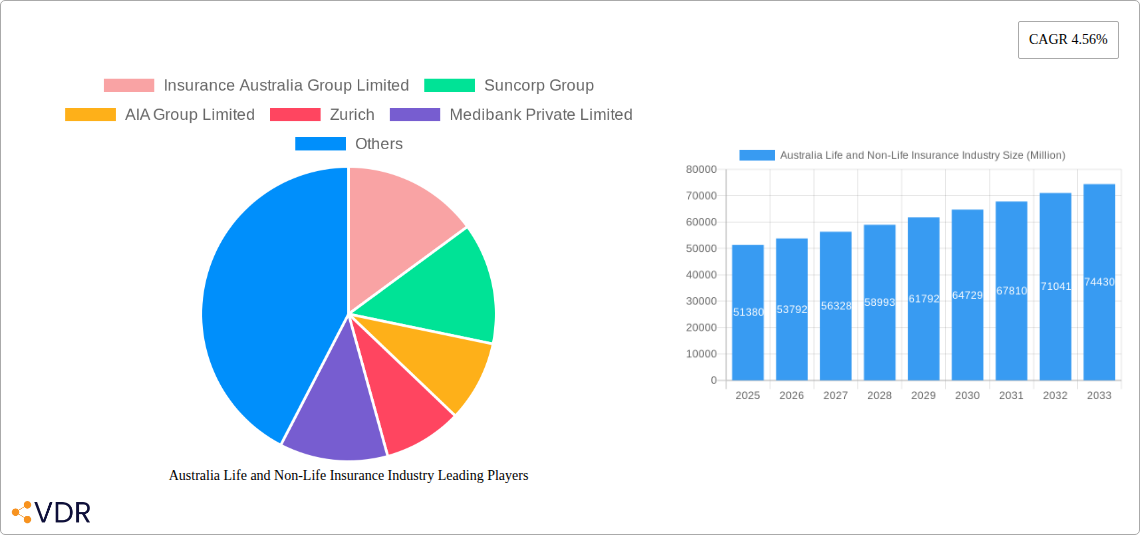
Australia Life and Non-Life Insurance Industry Market Size (In Billion)
However, challenges remain. Economic fluctuations and changing consumer preferences can impact purchasing decisions. Rising healthcare costs and increasing frequency of extreme weather events pose significant risks to profitability. Regulatory changes and increasing scrutiny of insurance practices also create uncertainty for market participants. Despite these challenges, the Australian insurance market is expected to maintain its trajectory of moderate growth, driven by long-term demographic trends and the increasing importance of financial security in an uncertain world. The consistent demand for diverse insurance products, including those specifically catering to emerging needs like cyber security and climate change risk, indicates sustained, albeit competitive, growth in the years to come.
Australia Life and Non-Life Insurance Industry Company Market Share
Australia Life and Non-Life Insurance Industry: Market Report 2019-2033
This comprehensive report provides an in-depth analysis of the Australian life and non-life insurance industry, covering market dynamics, growth trends, key players, and future outlook. With a focus on the period 2019-2033 (Base Year: 2025, Forecast Period: 2025-2033), this report is essential for industry professionals, investors, and strategic planners seeking to understand and capitalize on opportunities within this dynamic sector. The report analyzes both parent markets (Insurance) and child markets (Life Insurance, Non-life Insurance, Health Insurance, etc.) to provide a granular view of market segmentation. All values are presented in millions of Australian Dollars (AUD).
Australia Life and Non-Life Insurance Industry Market Dynamics & Structure
This section analyzes the competitive landscape, regulatory environment, and technological advancements shaping the Australian life and non-life insurance market. The analysis covers market concentration, technological innovation drivers, regulatory frameworks, competitive product substitutes, end-user demographics, and M&A trends.
- Market Concentration: The Australian insurance market is moderately concentrated, with a few dominant players holding significant market share. IAG and Suncorp are prominent examples. The exact market share percentages for 2024 are currently under analysis, but preliminary data suggests that IAG holds approximately xx% market share and Suncorp holds approximately xx%.
- Technological Innovation: Insurtech is rapidly transforming the industry, driving automation, personalized services, and enhanced risk management. However, significant barriers remain, including data security concerns, legacy systems, and the need for substantial investment in new technologies.
- Regulatory Framework: The Australian Prudential Regulation Authority (APRA) plays a crucial role in regulating the insurance sector. Regulatory changes impact pricing, product offerings, and compliance standards, influencing industry dynamics.
- Competitive Substitutes: Alternative risk management strategies and financial products compete with traditional insurance offerings, putting pressure on pricing and market share.
- End-User Demographics: Aging population and evolving consumer preferences (e.g., increased demand for digital services) significantly impact demand for various insurance products.
- M&A Trends: The insurance sector has witnessed a moderate level of M&A activity in recent years. The exact number of deals in 2024 is xx, reflecting a xx% change from the previous year. Factors driving these activities include market consolidation, expansion into new segments, and technological integration.
Australia Life and Non-Life Insurance Industry Growth Trends & Insights
This section delivers a comprehensive analysis of market size evolution, adoption rates, technological disruptions, and consumer behavior shifts, leveraging proprietary data and market research.
The Australian life and non-life insurance market has demonstrated consistent growth over the historical period (2019-2024). The market size expanded from approximately xx million in 2019 to an estimated xx million in 2024, exhibiting a CAGR of xx%. This growth is attributed to factors such as increasing awareness of insurance products, rising disposable incomes, and favorable government policies. Technological advancements, including the use of AI and big data for improved risk assessment and customer service, are further driving industry growth. However, economic fluctuations and regulatory changes could influence future growth trajectories. Consumer behavior is shifting towards more digital and personalized solutions, creating both opportunities and challenges for insurers. The market penetration for key products is currently under analysis and will be updated in the complete report.
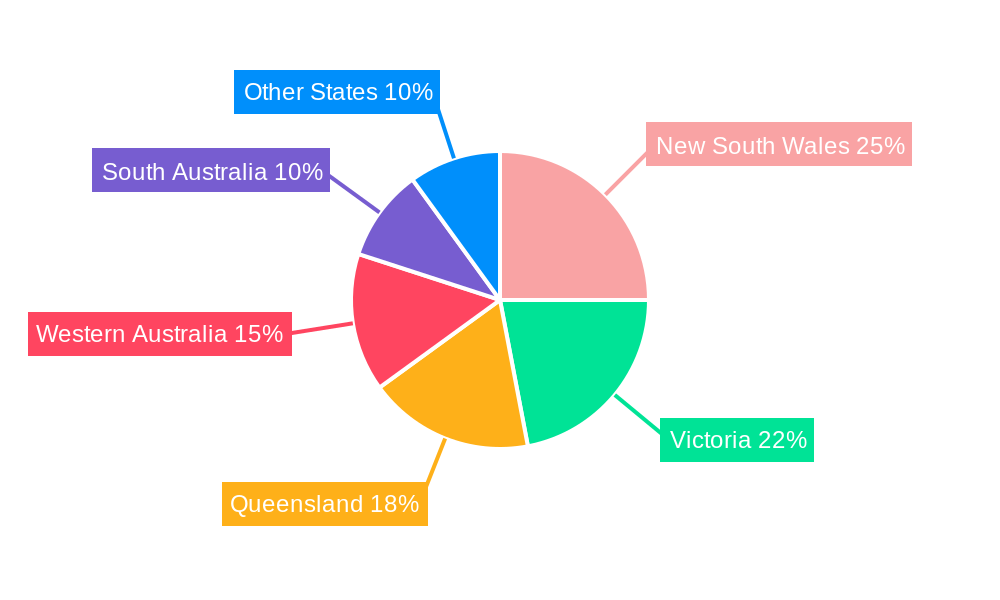
Dominant Regions, Countries, or Segments in Australia Life and Non-Life Insurance Industry
This section identifies the leading regions, countries, or segments driving market growth, considering factors such as economic policies and infrastructure development.
The Australian insurance market is geographically diverse, with growth concentrated in major metropolitan areas and high-population density regions. However, regional variations in economic activity and insurance penetration exist. Factors like economic growth, infrastructural development, and government initiatives to promote financial inclusion significantly influence regional market performance. The largest segment is currently the general insurance market, but the specific market share percentage and growth potential are to be detailed in the full report.
- Key Drivers:
- Strong economic growth in major cities.
- Government initiatives promoting financial inclusion.
- Increasing awareness of the importance of insurance.
- Dominance Factors:
- High population density in urban areas.
- Better access to financial services.
- Higher disposable income.
Australia Life and Non-Life Insurance Industry Product Landscape
The Australian insurance market offers a diverse range of products, including life insurance, health insurance, general insurance (home, auto, travel), and specialized insurance products like cyber insurance. Recent innovations include personalized insurance packages based on individual risk profiles, bundled products, and digital-first service delivery models. Insurers are leveraging technological advancements such as AI and telematics to enhance product features and improve customer experience. These innovative products often boast improved risk management features, competitive pricing strategies, and convenient access via online platforms or mobile apps.
Key Drivers, Barriers & Challenges in Australia Life and Non-Life Insurance Industry
Key Drivers:
The growth of the Australian life and non-life insurance market is primarily driven by factors like increasing affluence, a growing awareness of the need for financial protection, and technological advancements leading to better services and customized products. Government regulations and policies aimed at boosting insurance penetration also play a significant role.
Key Barriers and Challenges:
Challenges faced by the industry include increasing competition, stricter regulatory requirements, and the need to adapt to changing consumer expectations. Economic downturns, natural disasters, and cyber threats also significantly impact the sector's profitability and stability. For example, the impact of climate change on natural disaster claims is causing significant strain on insurers. The precise quantifiable impact is currently being analyzed for inclusion in the full report.
Emerging Opportunities in Australia Life and Non-Life Insurance Industry
Untapped markets in regional areas, the rise of Insurtech, and the growing demand for specialized insurance products (e.g., cyber insurance, parametric insurance) present significant opportunities. The adoption of digital technologies and the development of personalized insurance solutions catering to specific customer segments will continue to shape the industry's future.
Growth Accelerators in the Australia Life and Non-Life Insurance Industry Industry
Long-term growth will be fueled by the expanding adoption of digital technologies, strategic alliances and partnerships, and expansion into under-served markets. Technological breakthroughs, such as the use of IoT and AI for improved risk assessment and fraud detection, will also contribute to growth. Furthermore, strategic mergers and acquisitions and expansion into new product lines will play a crucial role in accelerating the growth of the Australian life and non-life insurance industry.
Key Players Shaping the Australia Life and Non-Life Insurance Industry Market
- Insurance Australia Group Limited
- Suncorp Group
- AIA Group Limited
- Zurich
- Medibank Private Limited
- Genworth Mortgage Insurance Australia Limited
- ClearView Wealth Limited
- Cover-More Limited
- AMP Limited
- NIB Holdings Limited
- List Not Exhaustive
Notable Milestones in Australia Life and Non-Life Insurance Industry Sector
- February 2023: Insurance Australia Group Limited (IAG) invested in Myriota, exploring IoT applications for risk management. This signifies a strategic move towards leveraging technological advancements for enhanced customer service and risk mitigation.
- September 2022: Launch of io. Insure, the world's first online M&A insurance marketplace for SMEs. This development demonstrates the industry's shift towards digitalization and the creation of specialized insurance solutions for niche markets.
In-Depth Australia Life and Non-Life Insurance Industry Market Outlook
The future of the Australian life and non-life insurance market looks promising, driven by technological advancements, strategic partnerships, and expansion into emerging segments. Continued adoption of digital technologies, personalized insurance solutions, and strategic acquisitions will propel market growth. The growing need for specialized insurance products and the expanding reach of insurance coverage in underserved areas will further contribute to the industry's positive outlook. The specific quantitative projections for future market size and growth rates will be detailed in the complete report.
Australia Life and Non-Life Insurance Industry Segmentation
-
1. Insurance Type
-
1.1. Life insurance
- 1.1.1. Individual
- 1.1.2. Group
-
1.2. Non-Life Insurance
- 1.2.1. Fire
- 1.2.2. Motor
- 1.2.3. Marine
- 1.2.4. Health
- 1.2.5. Other Non-Life Insurance
-
1.1. Life insurance
-
2. Distribution Channel
- 2.1. Direct
- 2.2. Brokers
- 2.3. Banks
- 2.4. Other Distribution Channels
Australia Life and Non-Life Insurance Industry Segmentation By Geography
- 1. Australia
Australia Life and Non-Life Insurance Industry Regional Market Share
Geographic Coverage of Australia Life and Non-Life Insurance Industry
Australia Life and Non-Life Insurance Industry REPORT HIGHLIGHTS
| Aspects | Details |
|---|---|
| Study Period | 2020-2034 |
| Base Year | 2025 |
| Estimated Year | 2026 |
| Forecast Period | 2026-2034 |
| Historical Period | 2020-2025 |
| Growth Rate | CAGR of 4.56% from 2020-2034 |
| Segmentation |
|
Table of Contents
- 1. Introduction
- 1.1. Research Scope
- 1.2. Market Segmentation
- 1.3. Research Objective
- 1.4. Definitions and Assumptions
- 2. Executive Summary
- 2.1. Market Snapshot
- 3. Market Dynamics
- 3.1. Market Drivers
- 3.2. Market Restrains
- 3.3. Market Trends
- 3.4. Market Opportunities
- 4. Market Factor Analysis
- 4.1. Porters Five Forces
- 4.1.1. Bargaining Power of Suppliers
- 4.1.2. Bargaining Power of Buyers
- 4.1.3. Threat of New Entrants
- 4.1.4. Threat of Substitutes
- 4.1.5. Competitive Rivalry
- 4.2. PESTEL analysis
- 4.3. BCG Analysis
- 4.3.1. Stars (High Growth, High Market Share)
- 4.3.2. Cash Cows (Low Growth, High Market Share)
- 4.3.3. Question Mark (High Growth, Low Market Share)
- 4.3.4. Dogs (Low Growth, Low Market Share)
- 4.4. Ansoff Matrix Analysis
- 4.5. Supply Chain Analysis
- 4.6. Regulatory Landscape
- 4.7. Current Market Potential and Opportunity Assessment (TAM–SAM–SOM Framework)
- 4.8. VDR Analyst Note
- 4.1. Porters Five Forces
- 5. Market Analysis, Insights and Forecast 2021-2033
- 5.1. Market Analysis, Insights and Forecast - by Insurance Type
- 5.1.1. Life insurance
- 5.1.1.1. Individual
- 5.1.1.2. Group
- 5.1.2. Non-Life Insurance
- 5.1.2.1. Fire
- 5.1.2.2. Motor
- 5.1.2.3. Marine
- 5.1.2.4. Health
- 5.1.2.5. Other Non-Life Insurance
- 5.1.1. Life insurance
- 5.2. Market Analysis, Insights and Forecast - by Distribution Channel
- 5.2.1. Direct
- 5.2.2. Brokers
- 5.2.3. Banks
- 5.2.4. Other Distribution Channels
- 5.3. Market Analysis, Insights and Forecast - by Region
- 5.3.1. Australia
- 5.1. Market Analysis, Insights and Forecast - by Insurance Type
- 6. Australia Life and Non-Life Insurance Industry Analysis, Insights and Forecast, 2021-2033
- 6.1. Market Analysis, Insights and Forecast - by Insurance Type
- 6.1.1. Life insurance
- 6.1.1.1. Individual
- 6.1.1.2. Group
- 6.1.2. Non-Life Insurance
- 6.1.2.1. Fire
- 6.1.2.2. Motor
- 6.1.2.3. Marine
- 6.1.2.4. Health
- 6.1.2.5. Other Non-Life Insurance
- 6.1.1. Life insurance
- 6.2. Market Analysis, Insights and Forecast - by Distribution Channel
- 6.2.1. Direct
- 6.2.2. Brokers
- 6.2.3. Banks
- 6.2.4. Other Distribution Channels
- 6.1. Market Analysis, Insights and Forecast - by Insurance Type
- 7. Competitive Analysis
- 7.1. Company Profiles
- 7.1.1 Insurance Australia Group Limited
- 7.1.1.1. Company Overview
- 7.1.1.2. Products
- 7.1.1.3. Company Financials
- 7.1.1.4. SWOT Analysis
- 7.1.2 Suncorp Group
- 7.1.2.1. Company Overview
- 7.1.2.2. Products
- 7.1.2.3. Company Financials
- 7.1.2.4. SWOT Analysis
- 7.1.3 AIA Group Limited
- 7.1.3.1. Company Overview
- 7.1.3.2. Products
- 7.1.3.3. Company Financials
- 7.1.3.4. SWOT Analysis
- 7.1.4 Zurich
- 7.1.4.1. Company Overview
- 7.1.4.2. Products
- 7.1.4.3. Company Financials
- 7.1.4.4. SWOT Analysis
- 7.1.5 Medibank Private Limited
- 7.1.5.1. Company Overview
- 7.1.5.2. Products
- 7.1.5.3. Company Financials
- 7.1.5.4. SWOT Analysis
- 7.1.6 Genworth Mortgage Insurance Australia Limited
- 7.1.6.1. Company Overview
- 7.1.6.2. Products
- 7.1.6.3. Company Financials
- 7.1.6.4. SWOT Analysis
- 7.1.7 ClearView Wealth Limited
- 7.1.7.1. Company Overview
- 7.1.7.2. Products
- 7.1.7.3. Company Financials
- 7.1.7.4. SWOT Analysis
- 7.1.8 Cover-More Limited
- 7.1.8.1. Company Overview
- 7.1.8.2. Products
- 7.1.8.3. Company Financials
- 7.1.8.4. SWOT Analysis
- 7.1.9 AMP Limited
- 7.1.9.1. Company Overview
- 7.1.9.2. Products
- 7.1.9.3. Company Financials
- 7.1.9.4. SWOT Analysis
- 7.1.10 NIB Holdings Limited**List Not Exhaustive
- 7.1.10.1. Company Overview
- 7.1.10.2. Products
- 7.1.10.3. Company Financials
- 7.1.10.4. SWOT Analysis
- 7.1.1 Insurance Australia Group Limited
- 7.2. Market Entropy
- 7.2.1 Company's Key Areas Served
- 7.2.2 Recent Developments
- 7.3. Company Market Share Analysis 2025
- 7.3.1 Top 5 Companies Market Share Analysis
- 7.3.2 Top 3 Companies Market Share Analysis
- 7.4. List of Potential Customers
- 8. Research Methodology
List of Figures
- Figure 1: Australia Life and Non-Life Insurance Industry Revenue Breakdown (Million, %) by Product 2025 & 2033
- Figure 2: Australia Life and Non-Life Insurance Industry Share (%) by Company 2025
List of Tables
- Table 1: Australia Life and Non-Life Insurance Industry Revenue Million Forecast, by Insurance Type 2020 & 2033
- Table 2: Australia Life and Non-Life Insurance Industry Volume Billion Forecast, by Insurance Type 2020 & 2033
- Table 3: Australia Life and Non-Life Insurance Industry Revenue Million Forecast, by Distribution Channel 2020 & 2033
- Table 4: Australia Life and Non-Life Insurance Industry Volume Billion Forecast, by Distribution Channel 2020 & 2033
- Table 5: Australia Life and Non-Life Insurance Industry Revenue Million Forecast, by Region 2020 & 2033
- Table 6: Australia Life and Non-Life Insurance Industry Volume Billion Forecast, by Region 2020 & 2033
- Table 7: Australia Life and Non-Life Insurance Industry Revenue Million Forecast, by Insurance Type 2020 & 2033
- Table 8: Australia Life and Non-Life Insurance Industry Volume Billion Forecast, by Insurance Type 2020 & 2033
- Table 9: Australia Life and Non-Life Insurance Industry Revenue Million Forecast, by Distribution Channel 2020 & 2033
- Table 10: Australia Life and Non-Life Insurance Industry Volume Billion Forecast, by Distribution Channel 2020 & 2033
- Table 11: Australia Life and Non-Life Insurance Industry Revenue Million Forecast, by Country 2020 & 2033
- Table 12: Australia Life and Non-Life Insurance Industry Volume Billion Forecast, by Country 2020 & 2033
Frequently Asked Questions
1. What is the projected Compound Annual Growth Rate (CAGR) of the Australia Life and Non-Life Insurance Industry?
The projected CAGR is approximately 4.56%.
2. Which companies are prominent players in the Australia Life and Non-Life Insurance Industry?
Key companies in the market include Insurance Australia Group Limited, Suncorp Group, AIA Group Limited, Zurich, Medibank Private Limited, Genworth Mortgage Insurance Australia Limited, ClearView Wealth Limited, Cover-More Limited, AMP Limited, NIB Holdings Limited**List Not Exhaustive.
3. What are the main segments of the Australia Life and Non-Life Insurance Industry?
The market segments include Insurance Type, Distribution Channel.
4. Can you provide details about the market size?
The market size is estimated to be USD 51.38 Million as of 2022.
5. What are some drivers contributing to market growth?
Guaranteed Protection Drives The Market.
6. What are the notable trends driving market growth?
Motor Vehicle and Household Insurance has the Largest Shares.
7. Are there any restraints impacting market growth?
Guaranteed Protection Drives The Market.
8. Can you provide examples of recent developments in the market?
February 2023: Insurance Australia Group Limited (IAG), Australia's largest general insurer, invested in Myriota, a global pioneer in low-cost and low-power satellite connectivity for the Internet of Things (IoT). This aim was to explore how IoT devices can help insurance customers manage risk and safeguard their assets.
9. What pricing options are available for accessing the report?
Pricing options include single-user, multi-user, and enterprise licenses priced at USD 3800, USD 4500, and USD 5800 respectively.
10. Is the market size provided in terms of value or volume?
The market size is provided in terms of value, measured in Million and volume, measured in Billion.
11. Are there any specific market keywords associated with the report?
Yes, the market keyword associated with the report is "Australia Life and Non-Life Insurance Industry," which aids in identifying and referencing the specific market segment covered.
12. How do I determine which pricing option suits my needs best?
The pricing options vary based on user requirements and access needs. Individual users may opt for single-user licenses, while businesses requiring broader access may choose multi-user or enterprise licenses for cost-effective access to the report.
13. Are there any additional resources or data provided in the Australia Life and Non-Life Insurance Industry report?
While the report offers comprehensive insights, it's advisable to review the specific contents or supplementary materials provided to ascertain if additional resources or data are available.
14. How can I stay updated on further developments or reports in the Australia Life and Non-Life Insurance Industry?
To stay informed about further developments, trends, and reports in the Australia Life and Non-Life Insurance Industry, consider subscribing to industry newsletters, following relevant companies and organizations, or regularly checking reputable industry news sources and publications.
Methodology
Step 1 - Identification of Relevant Samples Size from Population Database


Step 2 - Approaches for Defining Global Market Size (Value, Volume* & Price*)

Note*: In applicable scenarios
Step 3 - Data Sources
Primary Research
- Web Analytics
- Survey Reports
- Research Institute
- Latest Research Reports
- Opinion Leaders
Secondary Research
- Annual Reports
- White Paper
- Latest Press Release
- Industry Association
- Paid Database
- Investor Presentations

Step 4 - Data Triangulation
Involves using different sources of information in order to increase the validity of a study
These sources are likely to be stakeholders in a program - participants, other researchers, program staff, other community members, and so on.
Then we put all data in single framework & apply various statistical tools to find out the dynamic on the market.
During the analysis stage, feedback from the stakeholder groups would be compared to determine areas of agreement as well as areas of divergence