

Key Insights
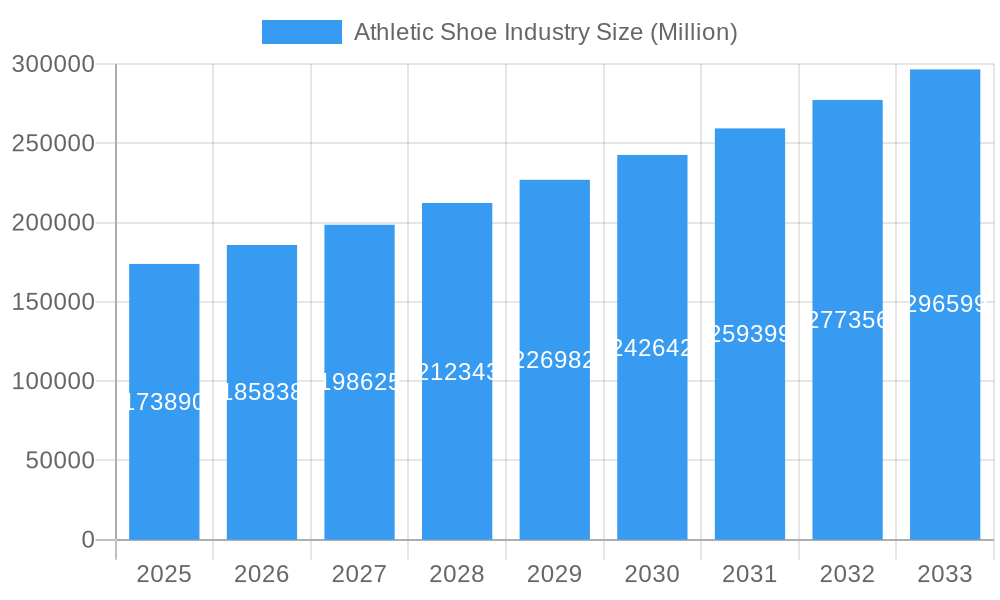
The global athletic shoe market, valued at $173.89 billion in 2025, is projected to experience robust growth, driven by several key factors. The increasing prevalence of fitness and wellness trends, coupled with rising disposable incomes in developing economies, fuels significant demand for athletic footwear across various segments. The market is segmented by product type (running, sports, trekking/hiking, and others), end-user (men, women, and children), and distribution channels (specialty stores, supermarkets, online retail, and others). Growth is particularly strong in the online retail segment, reflecting the broader shift towards e-commerce. Technological advancements in shoe design, incorporating improved cushioning, breathability, and performance features, further stimulate market expansion. Brand loyalty remains a significant factor, with established players like Nike, Adidas, and Under Armour maintaining strong market positions. However, the competitive landscape is dynamic, with emerging brands and innovative designs constantly challenging the established order. While supply chain disruptions and material cost increases pose potential restraints, the overall market outlook remains positive, with a projected Compound Annual Growth Rate (CAGR) of 6.86% from 2025 to 2033.
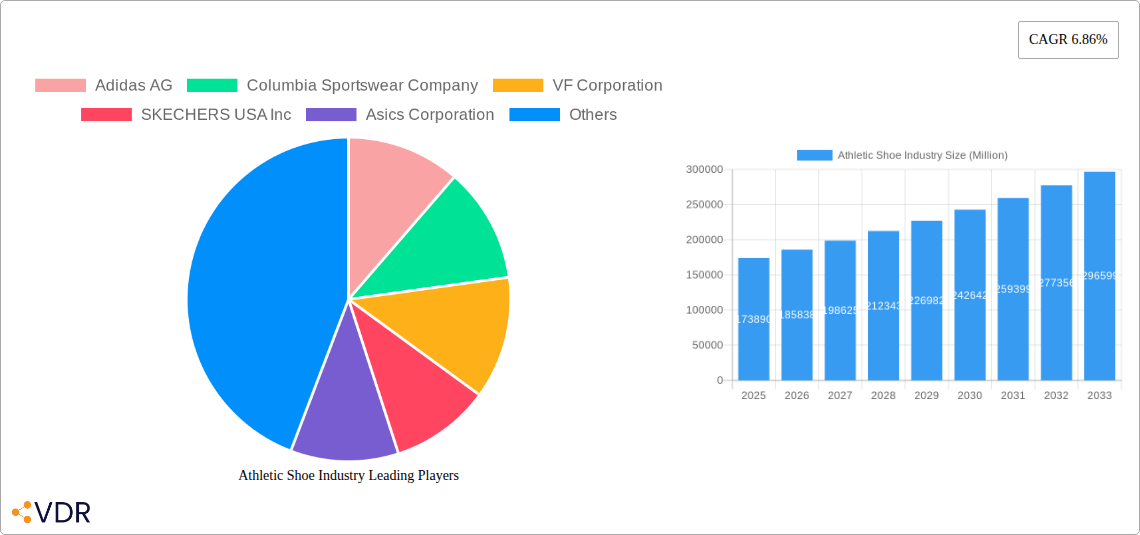
Athletic Shoe Industry Market Size (In Billion)
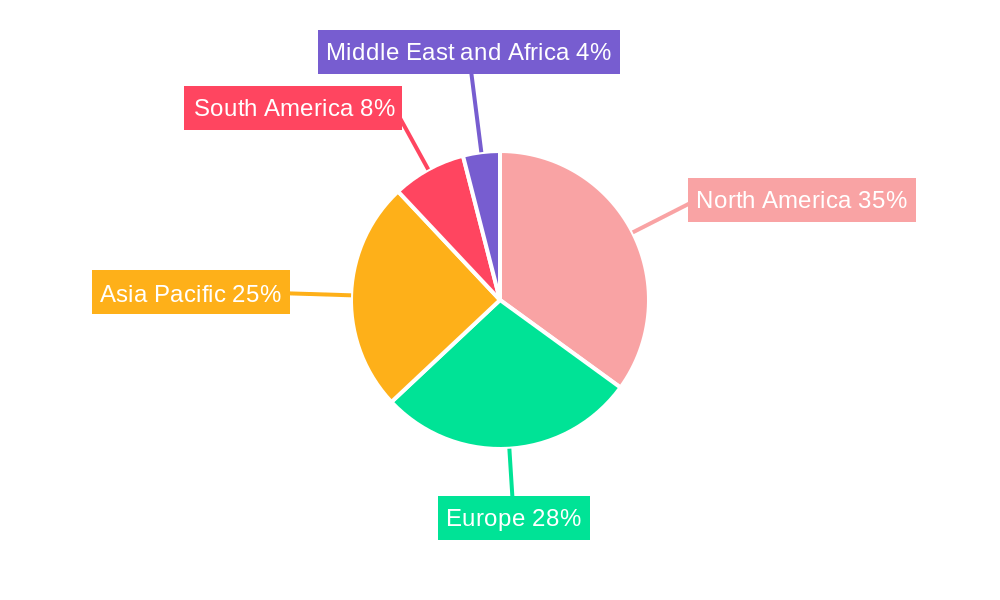
The regional distribution of the athletic shoe market reveals significant variations. North America and Europe currently hold substantial market share, driven by high per capita consumption and established athletic cultures. However, the Asia-Pacific region is expected to witness the most significant growth over the forecast period, propelled by rapidly expanding middle classes and rising participation in sports and fitness activities. Competition within each region varies, with local brands often holding a stronger presence in specific markets. The market is expected to witness further consolidation, with larger players continuing to acquire smaller brands and expand their product portfolios to cater to diverse consumer needs and preferences. This dynamic interplay between technological advancement, evolving consumer preferences, and regional market dynamics shapes the future trajectory of the athletic shoe industry.
Athletic Shoe Industry Company Market Share
Athletic Shoe Industry Market Report: 2019-2033
This comprehensive report provides a detailed analysis of the global athletic shoe market, encompassing historical data (2019-2024), current estimates (2025), and future projections (2025-2033). It delves into market dynamics, growth trends, key players, and emerging opportunities, offering valuable insights for industry professionals, investors, and stakeholders. The report segments the market by product type (running shoes, sports shoes, trekking/hiking shoes, other product types), end-user (men, women, kids/children), and distribution channel (sports and athletic goods stores, supermarkets/hypermarkets, online retail stores, other distribution channels).
Athletic Shoe Industry Market Dynamics & Structure
The global athletic shoe market is characterized by a moderately concentrated structure, with key players like Nike, Adidas, and Puma holding significant market share. Technological innovation, particularly in materials science and manufacturing processes, is a crucial driver. Stringent regulatory frameworks concerning material safety and labor practices influence market dynamics. Competition from substitute products, such as casual footwear, presents a challenge. End-user demographics, with a growing focus on health and fitness, particularly among younger generations, are shaping market demand. The market has witnessed a moderate level of M&A activity in recent years, primarily focusing on strengthening distribution networks and expanding product portfolios.
- Market Concentration: Nike and Adidas together hold approximately xx% of the global market share in 2025 (estimated).
- Technological Innovation: Advancements in cushioning technologies, recycled materials, and personalized fit are key innovation drivers.
- Regulatory Frameworks: Compliance with safety and environmental regulations impacts production costs and market access.
- Competitive Substitutes: The rise of athleisure fashion and comfortable casual footwear poses a competitive threat.
- M&A Activity: The volume of M&A deals in the athletic shoe industry between 2019 and 2024 averaged approximately xx deals annually.
Athletic Shoe Industry Growth Trends & Insights
The global athletic shoe market has demonstrated robust growth, propelled by a confluence of factors. An amplified focus on personal health and well-being worldwide, coupled with rising discretionary spending in burgeoning economies, has significantly boosted demand. The persistent popularity of fitness regimes and sports activities further underpins this expansion. Looking ahead, the market is poised for continued, albeit potentially more measured, growth from 2025 to 2033. A significant trend shaping the landscape is the integration of cutting-edge technology, including smart features that enhance functionality and user experience, leading to a dynamic evolution in product offerings. Simultaneously, evolving consumer values, such as a heightened awareness of environmental sustainability and a desire for personalized products, are profoundly influencing how athletic footwear is designed, manufactured, and marketed. The compound annual growth rate (CAGR) for the global athletic shoe market from 2025 to 2033 is projected to be around XX%. While developed regions currently exhibit the highest market penetration, substantial untapped potential exists within emerging economies, presenting exciting avenues for future development.
Dominant Regions, Countries, or Segments in Athletic Shoe Industry
North America and Europe currently hold the largest market shares, driven by high consumer spending and established athletic footwear culture. However, Asia-Pacific is projected to witness the fastest growth during the forecast period due to increasing disposable incomes, a burgeoning middle class, and rising participation in sports and fitness activities. Within product types, running shoes continue to dominate, followed by sports shoes and trekking/hiking shoes. The men's segment holds the largest market share across regions, although the women's and children's segments are exhibiting faster growth rates. Online retail stores are gaining significant traction as a distribution channel, although sports and athletic goods stores still retain a considerable market share.
- Key Drivers:
- North America & Europe: High per capita income, strong athletic culture, and established retail infrastructure.
- Asia-Pacific: Rapid economic growth, increasing urbanization, and rising health consciousness.
- Dominant Segments:
- Product Type: Running shoes maintain the largest market share in 2025 at xx million units.
- End User: The men’s segment commands the largest share in 2025 at xx million units.
- Distribution Channel: Sports and athletic goods stores continue to hold the biggest share in 2025 at xx million units.
Athletic Shoe Industry Product Landscape
The athletic shoe sector is characterized by an extensive and innovative product portfolio designed to cater to a wide spectrum of athletic pursuits and lifestyle needs. Key advancements revolve around the development of superior cushioning technologies, the utilization of ultralight materials for enhanced performance, and the incorporation of advanced ventilation systems for optimal comfort. A prominent and growing trend is the commitment to sustainability, with numerous brands actively employing recycled materials and embracing eco-conscious manufacturing processes. Core performance attributes such as exceptional impact absorption, superior energy return, and unparalleled comfort are consistently highlighted as critical selling propositions. Furthermore, the integration of sophisticated smart technology, including embedded sensors for performance tracking and GPS capabilities, is increasingly becoming a distinguishing feature in premium and specialized athletic footwear.
Key Drivers, Barriers & Challenges in Athletic Shoe Industry
Key Drivers: The market's trajectory is significantly influenced by a growing global emphasis on health and fitness, a rise in disposable incomes across various regions, and continuous technological innovation, including advancements in personalized fit technology and the development of smart athletic footwear. Strategic endorsements by prominent professional athletes also play a crucial role in driving consumer interest and market expansion.
Key Challenges: The athletic shoe industry faces formidable challenges, including intense competition from both established global brands and agile new entrants. Fluctuations in the cost of raw materials can impact profit margins, and the vulnerability of global supply chains to disruptions poses a significant hurdle. Moreover, there is escalating pressure from consumers and regulatory bodies to adopt more sustainable and environmentally responsible manufacturing practices. For instance, the imposition of increased tariffs on imported raw materials could potentially elevate production costs by approximately XX%.
Emerging Opportunities in Athletic Shoe Industry
The athletic shoe market is ripe with emerging opportunities. Significant growth potential lies within untapped markets in developing economies, where increasing purchasing power and a rising interest in sports are creating new demand. The burgeoning demand for ethically sourced and environmentally sustainable products presents a strong avenue for brands committed to these principles. The integration of advanced technologies, such as AI-driven personalized footwear design and sophisticated performance monitoring systems, offers avenues for differentiation and value creation. Furthermore, the expansion into niche sports and specialized athletic activities, which often require highly specific footwear solutions, represents a promising segment for innovation and market penetration.
Growth Accelerators in the Athletic Shoe Industry
Technological breakthroughs in materials science and manufacturing are set to drive efficiency and sustainability. Strategic partnerships with fitness technology companies and expansion into new markets, especially in rapidly developing economies, will unlock new growth avenues.
Key Players Shaping the Athletic Shoe Industry Market
Notable Milestones in Athletic Shoe Industry Sector
- June 2024: Nike launched the Converse Run Star Trainer, impacting the retro-inspired athletic shoe segment.
- June 2024: PUMA's HYROX partnership boosted brand visibility and expanded into the fitness racing market.
- June 2024: PUMA's Deviate NITRO 3 launch showcased advancements in cushioning technology.
In-Depth Athletic Shoe Industry Market Outlook
The athletic shoe market is poised for sustained growth, driven by technological innovation, expanding consumer bases, and increasing health consciousness. Strategic partnerships, expansion into untapped markets, and a focus on sustainability will be crucial for capturing future market share. The potential for growth in personalized footwear, smart shoe technology, and sustainable materials represents significant opportunities for industry players.
Athletic Shoe Industry Segmentation
-
1. Product Type
- 1.1. Running Shoes
- 1.2. Sports Shoes
- 1.3. Trekking/Hiking Shoes
- 1.4. Other Product Types
-
2. End User
- 2.1. Men
- 2.2. Women
- 2.3. Kids/Children
-
3. Distribution Channel
- 3.1. Sports and Atheletic Goods Stores
- 3.2. Supermarkets/Hypermarkets
- 3.3. Online Retail Stores
- 3.4. Other Distribution Channels
Athletic Shoe Industry Segmentation By Geography
-
1. North America
- 1.1. United States
- 1.2. Canada
- 1.3. Mexico
- 1.4. Rest of North America
-
2. Europe
- 2.1. United Kingdom
- 2.2. Germany
- 2.3. Spain
- 2.4. France
- 2.5. Italy
- 2.6. Netherlands
- 2.7. Rest of Europe
-
3. Asia Pacific
- 3.1. China
- 3.2. Japan
- 3.3. India
- 3.4. Australia
- 3.5. Rest of Asia Pacific
-
4. South America
- 4.1. Brazil
- 4.2. Argentina
- 4.3. Rest of South America
-
5. Middle East and Africa
- 5.1. Saudi Arabia
- 5.2. South Africa
- 5.3. Rest of Middle East and Africa
Athletic Shoe Industry Regional Market Share
Geographic Coverage of Athletic Shoe Industry
Athletic Shoe Industry REPORT HIGHLIGHTS
| Aspects | Details |
|---|---|
| Study Period | 2020-2034 |
| Base Year | 2025 |
| Estimated Year | 2026 |
| Forecast Period | 2026-2034 |
| Historical Period | 2020-2025 |
| Growth Rate | CAGR of 6.86% from 2020-2034 |
| Segmentation |
|
Table of Contents
- 1. Introduction
- 1.1. Research Scope
- 1.2. Market Segmentation
- 1.3. Research Objective
- 1.4. Definitions and Assumptions
- 2. Executive Summary
- 2.1. Market Snapshot
- 3. Market Dynamics
- 3.1. Market Drivers
- 3.2. Market Restrains
- 3.3. Market Trends
- 3.4. Market Opportunities
- 4. Market Factor Analysis
- 4.1. Porters Five Forces
- 4.1.1. Bargaining Power of Suppliers
- 4.1.2. Bargaining Power of Buyers
- 4.1.3. Threat of New Entrants
- 4.1.4. Threat of Substitutes
- 4.1.5. Competitive Rivalry
- 4.2. PESTEL analysis
- 4.3. BCG Analysis
- 4.3.1. Stars (High Growth, High Market Share)
- 4.3.2. Cash Cows (Low Growth, High Market Share)
- 4.3.3. Question Mark (High Growth, Low Market Share)
- 4.3.4. Dogs (Low Growth, Low Market Share)
- 4.4. Ansoff Matrix Analysis
- 4.5. Supply Chain Analysis
- 4.6. Regulatory Landscape
- 4.7. Current Market Potential and Opportunity Assessment (TAM–SAM–SOM Framework)
- 4.8. VDR Analyst Note
- 4.1. Porters Five Forces
- 5. Market Analysis, Insights and Forecast 2021-2033
- 5.1. Market Analysis, Insights and Forecast - by Product Type
- 5.1.1. Running Shoes
- 5.1.2. Sports Shoes
- 5.1.3. Trekking/Hiking Shoes
- 5.1.4. Other Product Types
- 5.2. Market Analysis, Insights and Forecast - by End User
- 5.2.1. Men
- 5.2.2. Women
- 5.2.3. Kids/Children
- 5.3. Market Analysis, Insights and Forecast - by Distribution Channel
- 5.3.1. Sports and Atheletic Goods Stores
- 5.3.2. Supermarkets/Hypermarkets
- 5.3.3. Online Retail Stores
- 5.3.4. Other Distribution Channels
- 5.4. Market Analysis, Insights and Forecast - by Region
- 5.4.1. North America
- 5.4.2. Europe
- 5.4.3. Asia Pacific
- 5.4.4. South America
- 5.4.5. Middle East and Africa
- 5.1. Market Analysis, Insights and Forecast - by Product Type
- 6. Global Athletic Shoe Industry Analysis, Insights and Forecast, 2021-2033
- 6.1. Market Analysis, Insights and Forecast - by Product Type
- 6.1.1. Running Shoes
- 6.1.2. Sports Shoes
- 6.1.3. Trekking/Hiking Shoes
- 6.1.4. Other Product Types
- 6.2. Market Analysis, Insights and Forecast - by End User
- 6.2.1. Men
- 6.2.2. Women
- 6.2.3. Kids/Children
- 6.3. Market Analysis, Insights and Forecast - by Distribution Channel
- 6.3.1. Sports and Atheletic Goods Stores
- 6.3.2. Supermarkets/Hypermarkets
- 6.3.3. Online Retail Stores
- 6.3.4. Other Distribution Channels
- 6.1. Market Analysis, Insights and Forecast - by Product Type
- 7. North America Athletic Shoe Industry Analysis, Insights and Forecast, 2021-2033
- 7.1. Market Analysis, Insights and Forecast - by Product Type
- 7.1.1. Running Shoes
- 7.1.2. Sports Shoes
- 7.1.3. Trekking/Hiking Shoes
- 7.1.4. Other Product Types
- 7.2. Market Analysis, Insights and Forecast - by End User
- 7.2.1. Men
- 7.2.2. Women
- 7.2.3. Kids/Children
- 7.3. Market Analysis, Insights and Forecast - by Distribution Channel
- 7.3.1. Sports and Atheletic Goods Stores
- 7.3.2. Supermarkets/Hypermarkets
- 7.3.3. Online Retail Stores
- 7.3.4. Other Distribution Channels
- 7.1. Market Analysis, Insights and Forecast - by Product Type
- 8. Europe Athletic Shoe Industry Analysis, Insights and Forecast, 2021-2033
- 8.1. Market Analysis, Insights and Forecast - by Product Type
- 8.1.1. Running Shoes
- 8.1.2. Sports Shoes
- 8.1.3. Trekking/Hiking Shoes
- 8.1.4. Other Product Types
- 8.2. Market Analysis, Insights and Forecast - by End User
- 8.2.1. Men
- 8.2.2. Women
- 8.2.3. Kids/Children
- 8.3. Market Analysis, Insights and Forecast - by Distribution Channel
- 8.3.1. Sports and Atheletic Goods Stores
- 8.3.2. Supermarkets/Hypermarkets
- 8.3.3. Online Retail Stores
- 8.3.4. Other Distribution Channels
- 8.1. Market Analysis, Insights and Forecast - by Product Type
- 9. Asia Pacific Athletic Shoe Industry Analysis, Insights and Forecast, 2021-2033
- 9.1. Market Analysis, Insights and Forecast - by Product Type
- 9.1.1. Running Shoes
- 9.1.2. Sports Shoes
- 9.1.3. Trekking/Hiking Shoes
- 9.1.4. Other Product Types
- 9.2. Market Analysis, Insights and Forecast - by End User
- 9.2.1. Men
- 9.2.2. Women
- 9.2.3. Kids/Children
- 9.3. Market Analysis, Insights and Forecast - by Distribution Channel
- 9.3.1. Sports and Atheletic Goods Stores
- 9.3.2. Supermarkets/Hypermarkets
- 9.3.3. Online Retail Stores
- 9.3.4. Other Distribution Channels
- 9.1. Market Analysis, Insights and Forecast - by Product Type
- 10. South America Athletic Shoe Industry Analysis, Insights and Forecast, 2021-2033
- 10.1. Market Analysis, Insights and Forecast - by Product Type
- 10.1.1. Running Shoes
- 10.1.2. Sports Shoes
- 10.1.3. Trekking/Hiking Shoes
- 10.1.4. Other Product Types
- 10.2. Market Analysis, Insights and Forecast - by End User
- 10.2.1. Men
- 10.2.2. Women
- 10.2.3. Kids/Children
- 10.3. Market Analysis, Insights and Forecast - by Distribution Channel
- 10.3.1. Sports and Atheletic Goods Stores
- 10.3.2. Supermarkets/Hypermarkets
- 10.3.3. Online Retail Stores
- 10.3.4. Other Distribution Channels
- 10.1. Market Analysis, Insights and Forecast - by Product Type
- 11. Middle East and Africa Athletic Shoe Industry Analysis, Insights and Forecast, 2021-2033
- 11.1. Market Analysis, Insights and Forecast - by Product Type
- 11.1.1. Running Shoes
- 11.1.2. Sports Shoes
- 11.1.3. Trekking/Hiking Shoes
- 11.1.4. Other Product Types
- 11.2. Market Analysis, Insights and Forecast - by End User
- 11.2.1. Men
- 11.2.2. Women
- 11.2.3. Kids/Children
- 11.3. Market Analysis, Insights and Forecast - by Distribution Channel
- 11.3.1. Sports and Atheletic Goods Stores
- 11.3.2. Supermarkets/Hypermarkets
- 11.3.3. Online Retail Stores
- 11.3.4. Other Distribution Channels
- 11.1. Market Analysis, Insights and Forecast - by Product Type
- 12. Competitive Analysis
- 12.1. Company Profiles
- 12.1.1 Adidas AG
- 12.1.1.1. Company Overview
- 12.1.1.2. Products
- 12.1.1.3. Company Financials
- 12.1.1.4. SWOT Analysis
- 12.1.2 Columbia Sportswear Company
- 12.1.2.1. Company Overview
- 12.1.2.2. Products
- 12.1.2.3. Company Financials
- 12.1.2.4. SWOT Analysis
- 12.1.3 VF Corporation
- 12.1.3.1. Company Overview
- 12.1.3.2. Products
- 12.1.3.3. Company Financials
- 12.1.3.4. SWOT Analysis
- 12.1.4 SKECHERS USA Inc
- 12.1.4.1. Company Overview
- 12.1.4.2. Products
- 12.1.4.3. Company Financials
- 12.1.4.4. SWOT Analysis
- 12.1.5 Asics Corporation
- 12.1.5.1. Company Overview
- 12.1.5.2. Products
- 12.1.5.3. Company Financials
- 12.1.5.4. SWOT Analysis
- 12.1.6 Puma SE
- 12.1.6.1. Company Overview
- 12.1.6.2. Products
- 12.1.6.3. Company Financials
- 12.1.6.4. SWOT Analysis
- 12.1.7 Under Armour Inc
- 12.1.7.1. Company Overview
- 12.1.7.2. Products
- 12.1.7.3. Company Financials
- 12.1.7.4. SWOT Analysis
- 12.1.8 Nike Inc
- 12.1.8.1. Company Overview
- 12.1.8.2. Products
- 12.1.8.3. Company Financials
- 12.1.8.4. SWOT Analysis
- 12.1.9 New Balance Athletics Inc
- 12.1.9.1. Company Overview
- 12.1.9.2. Products
- 12.1.9.3. Company Financials
- 12.1.9.4. SWOT Analysis
- 12.1.10 Fila
- 12.1.10.1. Company Overview
- 12.1.10.2. Products
- 12.1.10.3. Company Financials
- 12.1.10.4. SWOT Analysis
- 12.1.1 Adidas AG
- 12.2. Market Entropy
- 12.2.1 Company's Key Areas Served
- 12.2.2 Recent Developments
- 12.3. Company Market Share Analysis 2025
- 12.3.1 Top 5 Companies Market Share Analysis
- 12.3.2 Top 3 Companies Market Share Analysis
- 12.4. List of Potential Customers
- 13. Research Methodology
List of Figures
- Figure 1: Global Athletic Shoe Industry Revenue Breakdown (Million, %) by Region 2025 & 2033
- Figure 2: Global Athletic Shoe Industry Volume Breakdown (K Units, %) by Region 2025 & 2033
- Figure 3: North America Athletic Shoe Industry Revenue (Million), by Product Type 2025 & 2033
- Figure 4: North America Athletic Shoe Industry Volume (K Units), by Product Type 2025 & 2033
- Figure 5: North America Athletic Shoe Industry Revenue Share (%), by Product Type 2025 & 2033
- Figure 6: North America Athletic Shoe Industry Volume Share (%), by Product Type 2025 & 2033
- Figure 7: North America Athletic Shoe Industry Revenue (Million), by End User 2025 & 2033
- Figure 8: North America Athletic Shoe Industry Volume (K Units), by End User 2025 & 2033
- Figure 9: North America Athletic Shoe Industry Revenue Share (%), by End User 2025 & 2033
- Figure 10: North America Athletic Shoe Industry Volume Share (%), by End User 2025 & 2033
- Figure 11: North America Athletic Shoe Industry Revenue (Million), by Distribution Channel 2025 & 2033
- Figure 12: North America Athletic Shoe Industry Volume (K Units), by Distribution Channel 2025 & 2033
- Figure 13: North America Athletic Shoe Industry Revenue Share (%), by Distribution Channel 2025 & 2033
- Figure 14: North America Athletic Shoe Industry Volume Share (%), by Distribution Channel 2025 & 2033
- Figure 15: North America Athletic Shoe Industry Revenue (Million), by Country 2025 & 2033
- Figure 16: North America Athletic Shoe Industry Volume (K Units), by Country 2025 & 2033
- Figure 17: North America Athletic Shoe Industry Revenue Share (%), by Country 2025 & 2033
- Figure 18: North America Athletic Shoe Industry Volume Share (%), by Country 2025 & 2033
- Figure 19: Europe Athletic Shoe Industry Revenue (Million), by Product Type 2025 & 2033
- Figure 20: Europe Athletic Shoe Industry Volume (K Units), by Product Type 2025 & 2033
- Figure 21: Europe Athletic Shoe Industry Revenue Share (%), by Product Type 2025 & 2033
- Figure 22: Europe Athletic Shoe Industry Volume Share (%), by Product Type 2025 & 2033
- Figure 23: Europe Athletic Shoe Industry Revenue (Million), by End User 2025 & 2033
- Figure 24: Europe Athletic Shoe Industry Volume (K Units), by End User 2025 & 2033
- Figure 25: Europe Athletic Shoe Industry Revenue Share (%), by End User 2025 & 2033
- Figure 26: Europe Athletic Shoe Industry Volume Share (%), by End User 2025 & 2033
- Figure 27: Europe Athletic Shoe Industry Revenue (Million), by Distribution Channel 2025 & 2033
- Figure 28: Europe Athletic Shoe Industry Volume (K Units), by Distribution Channel 2025 & 2033
- Figure 29: Europe Athletic Shoe Industry Revenue Share (%), by Distribution Channel 2025 & 2033
- Figure 30: Europe Athletic Shoe Industry Volume Share (%), by Distribution Channel 2025 & 2033
- Figure 31: Europe Athletic Shoe Industry Revenue (Million), by Country 2025 & 2033
- Figure 32: Europe Athletic Shoe Industry Volume (K Units), by Country 2025 & 2033
- Figure 33: Europe Athletic Shoe Industry Revenue Share (%), by Country 2025 & 2033
- Figure 34: Europe Athletic Shoe Industry Volume Share (%), by Country 2025 & 2033
- Figure 35: Asia Pacific Athletic Shoe Industry Revenue (Million), by Product Type 2025 & 2033
- Figure 36: Asia Pacific Athletic Shoe Industry Volume (K Units), by Product Type 2025 & 2033
- Figure 37: Asia Pacific Athletic Shoe Industry Revenue Share (%), by Product Type 2025 & 2033
- Figure 38: Asia Pacific Athletic Shoe Industry Volume Share (%), by Product Type 2025 & 2033
- Figure 39: Asia Pacific Athletic Shoe Industry Revenue (Million), by End User 2025 & 2033
- Figure 40: Asia Pacific Athletic Shoe Industry Volume (K Units), by End User 2025 & 2033
- Figure 41: Asia Pacific Athletic Shoe Industry Revenue Share (%), by End User 2025 & 2033
- Figure 42: Asia Pacific Athletic Shoe Industry Volume Share (%), by End User 2025 & 2033
- Figure 43: Asia Pacific Athletic Shoe Industry Revenue (Million), by Distribution Channel 2025 & 2033
- Figure 44: Asia Pacific Athletic Shoe Industry Volume (K Units), by Distribution Channel 2025 & 2033
- Figure 45: Asia Pacific Athletic Shoe Industry Revenue Share (%), by Distribution Channel 2025 & 2033
- Figure 46: Asia Pacific Athletic Shoe Industry Volume Share (%), by Distribution Channel 2025 & 2033
- Figure 47: Asia Pacific Athletic Shoe Industry Revenue (Million), by Country 2025 & 2033
- Figure 48: Asia Pacific Athletic Shoe Industry Volume (K Units), by Country 2025 & 2033
- Figure 49: Asia Pacific Athletic Shoe Industry Revenue Share (%), by Country 2025 & 2033
- Figure 50: Asia Pacific Athletic Shoe Industry Volume Share (%), by Country 2025 & 2033
- Figure 51: South America Athletic Shoe Industry Revenue (Million), by Product Type 2025 & 2033
- Figure 52: South America Athletic Shoe Industry Volume (K Units), by Product Type 2025 & 2033
- Figure 53: South America Athletic Shoe Industry Revenue Share (%), by Product Type 2025 & 2033
- Figure 54: South America Athletic Shoe Industry Volume Share (%), by Product Type 2025 & 2033
- Figure 55: South America Athletic Shoe Industry Revenue (Million), by End User 2025 & 2033
- Figure 56: South America Athletic Shoe Industry Volume (K Units), by End User 2025 & 2033
- Figure 57: South America Athletic Shoe Industry Revenue Share (%), by End User 2025 & 2033
- Figure 58: South America Athletic Shoe Industry Volume Share (%), by End User 2025 & 2033
- Figure 59: South America Athletic Shoe Industry Revenue (Million), by Distribution Channel 2025 & 2033
- Figure 60: South America Athletic Shoe Industry Volume (K Units), by Distribution Channel 2025 & 2033
- Figure 61: South America Athletic Shoe Industry Revenue Share (%), by Distribution Channel 2025 & 2033
- Figure 62: South America Athletic Shoe Industry Volume Share (%), by Distribution Channel 2025 & 2033
- Figure 63: South America Athletic Shoe Industry Revenue (Million), by Country 2025 & 2033
- Figure 64: South America Athletic Shoe Industry Volume (K Units), by Country 2025 & 2033
- Figure 65: South America Athletic Shoe Industry Revenue Share (%), by Country 2025 & 2033
- Figure 66: South America Athletic Shoe Industry Volume Share (%), by Country 2025 & 2033
- Figure 67: Middle East and Africa Athletic Shoe Industry Revenue (Million), by Product Type 2025 & 2033
- Figure 68: Middle East and Africa Athletic Shoe Industry Volume (K Units), by Product Type 2025 & 2033
- Figure 69: Middle East and Africa Athletic Shoe Industry Revenue Share (%), by Product Type 2025 & 2033
- Figure 70: Middle East and Africa Athletic Shoe Industry Volume Share (%), by Product Type 2025 & 2033
- Figure 71: Middle East and Africa Athletic Shoe Industry Revenue (Million), by End User 2025 & 2033
- Figure 72: Middle East and Africa Athletic Shoe Industry Volume (K Units), by End User 2025 & 2033
- Figure 73: Middle East and Africa Athletic Shoe Industry Revenue Share (%), by End User 2025 & 2033
- Figure 74: Middle East and Africa Athletic Shoe Industry Volume Share (%), by End User 2025 & 2033
- Figure 75: Middle East and Africa Athletic Shoe Industry Revenue (Million), by Distribution Channel 2025 & 2033
- Figure 76: Middle East and Africa Athletic Shoe Industry Volume (K Units), by Distribution Channel 2025 & 2033
- Figure 77: Middle East and Africa Athletic Shoe Industry Revenue Share (%), by Distribution Channel 2025 & 2033
- Figure 78: Middle East and Africa Athletic Shoe Industry Volume Share (%), by Distribution Channel 2025 & 2033
- Figure 79: Middle East and Africa Athletic Shoe Industry Revenue (Million), by Country 2025 & 2033
- Figure 80: Middle East and Africa Athletic Shoe Industry Volume (K Units), by Country 2025 & 2033
- Figure 81: Middle East and Africa Athletic Shoe Industry Revenue Share (%), by Country 2025 & 2033
- Figure 82: Middle East and Africa Athletic Shoe Industry Volume Share (%), by Country 2025 & 2033
List of Tables
- Table 1: Global Athletic Shoe Industry Revenue Million Forecast, by Product Type 2020 & 2033
- Table 2: Global Athletic Shoe Industry Volume K Units Forecast, by Product Type 2020 & 2033
- Table 3: Global Athletic Shoe Industry Revenue Million Forecast, by End User 2020 & 2033
- Table 4: Global Athletic Shoe Industry Volume K Units Forecast, by End User 2020 & 2033
- Table 5: Global Athletic Shoe Industry Revenue Million Forecast, by Distribution Channel 2020 & 2033
- Table 6: Global Athletic Shoe Industry Volume K Units Forecast, by Distribution Channel 2020 & 2033
- Table 7: Global Athletic Shoe Industry Revenue Million Forecast, by Region 2020 & 2033
- Table 8: Global Athletic Shoe Industry Volume K Units Forecast, by Region 2020 & 2033
- Table 9: Global Athletic Shoe Industry Revenue Million Forecast, by Product Type 2020 & 2033
- Table 10: Global Athletic Shoe Industry Volume K Units Forecast, by Product Type 2020 & 2033
- Table 11: Global Athletic Shoe Industry Revenue Million Forecast, by End User 2020 & 2033
- Table 12: Global Athletic Shoe Industry Volume K Units Forecast, by End User 2020 & 2033
- Table 13: Global Athletic Shoe Industry Revenue Million Forecast, by Distribution Channel 2020 & 2033
- Table 14: Global Athletic Shoe Industry Volume K Units Forecast, by Distribution Channel 2020 & 2033
- Table 15: Global Athletic Shoe Industry Revenue Million Forecast, by Country 2020 & 2033
- Table 16: Global Athletic Shoe Industry Volume K Units Forecast, by Country 2020 & 2033
- Table 17: United States Athletic Shoe Industry Revenue (Million) Forecast, by Application 2020 & 2033
- Table 18: United States Athletic Shoe Industry Volume (K Units) Forecast, by Application 2020 & 2033
- Table 19: Canada Athletic Shoe Industry Revenue (Million) Forecast, by Application 2020 & 2033
- Table 20: Canada Athletic Shoe Industry Volume (K Units) Forecast, by Application 2020 & 2033
- Table 21: Mexico Athletic Shoe Industry Revenue (Million) Forecast, by Application 2020 & 2033
- Table 22: Mexico Athletic Shoe Industry Volume (K Units) Forecast, by Application 2020 & 2033
- Table 23: Rest of North America Athletic Shoe Industry Revenue (Million) Forecast, by Application 2020 & 2033
- Table 24: Rest of North America Athletic Shoe Industry Volume (K Units) Forecast, by Application 2020 & 2033
- Table 25: Global Athletic Shoe Industry Revenue Million Forecast, by Product Type 2020 & 2033
- Table 26: Global Athletic Shoe Industry Volume K Units Forecast, by Product Type 2020 & 2033
- Table 27: Global Athletic Shoe Industry Revenue Million Forecast, by End User 2020 & 2033
- Table 28: Global Athletic Shoe Industry Volume K Units Forecast, by End User 2020 & 2033
- Table 29: Global Athletic Shoe Industry Revenue Million Forecast, by Distribution Channel 2020 & 2033
- Table 30: Global Athletic Shoe Industry Volume K Units Forecast, by Distribution Channel 2020 & 2033
- Table 31: Global Athletic Shoe Industry Revenue Million Forecast, by Country 2020 & 2033
- Table 32: Global Athletic Shoe Industry Volume K Units Forecast, by Country 2020 & 2033
- Table 33: United Kingdom Athletic Shoe Industry Revenue (Million) Forecast, by Application 2020 & 2033
- Table 34: United Kingdom Athletic Shoe Industry Volume (K Units) Forecast, by Application 2020 & 2033
- Table 35: Germany Athletic Shoe Industry Revenue (Million) Forecast, by Application 2020 & 2033
- Table 36: Germany Athletic Shoe Industry Volume (K Units) Forecast, by Application 2020 & 2033
- Table 37: Spain Athletic Shoe Industry Revenue (Million) Forecast, by Application 2020 & 2033
- Table 38: Spain Athletic Shoe Industry Volume (K Units) Forecast, by Application 2020 & 2033
- Table 39: France Athletic Shoe Industry Revenue (Million) Forecast, by Application 2020 & 2033
- Table 40: France Athletic Shoe Industry Volume (K Units) Forecast, by Application 2020 & 2033
- Table 41: Italy Athletic Shoe Industry Revenue (Million) Forecast, by Application 2020 & 2033
- Table 42: Italy Athletic Shoe Industry Volume (K Units) Forecast, by Application 2020 & 2033
- Table 43: Netherlands Athletic Shoe Industry Revenue (Million) Forecast, by Application 2020 & 2033
- Table 44: Netherlands Athletic Shoe Industry Volume (K Units) Forecast, by Application 2020 & 2033
- Table 45: Rest of Europe Athletic Shoe Industry Revenue (Million) Forecast, by Application 2020 & 2033
- Table 46: Rest of Europe Athletic Shoe Industry Volume (K Units) Forecast, by Application 2020 & 2033
- Table 47: Global Athletic Shoe Industry Revenue Million Forecast, by Product Type 2020 & 2033
- Table 48: Global Athletic Shoe Industry Volume K Units Forecast, by Product Type 2020 & 2033
- Table 49: Global Athletic Shoe Industry Revenue Million Forecast, by End User 2020 & 2033
- Table 50: Global Athletic Shoe Industry Volume K Units Forecast, by End User 2020 & 2033
- Table 51: Global Athletic Shoe Industry Revenue Million Forecast, by Distribution Channel 2020 & 2033
- Table 52: Global Athletic Shoe Industry Volume K Units Forecast, by Distribution Channel 2020 & 2033
- Table 53: Global Athletic Shoe Industry Revenue Million Forecast, by Country 2020 & 2033
- Table 54: Global Athletic Shoe Industry Volume K Units Forecast, by Country 2020 & 2033
- Table 55: China Athletic Shoe Industry Revenue (Million) Forecast, by Application 2020 & 2033
- Table 56: China Athletic Shoe Industry Volume (K Units) Forecast, by Application 2020 & 2033
- Table 57: Japan Athletic Shoe Industry Revenue (Million) Forecast, by Application 2020 & 2033
- Table 58: Japan Athletic Shoe Industry Volume (K Units) Forecast, by Application 2020 & 2033
- Table 59: India Athletic Shoe Industry Revenue (Million) Forecast, by Application 2020 & 2033
- Table 60: India Athletic Shoe Industry Volume (K Units) Forecast, by Application 2020 & 2033
- Table 61: Australia Athletic Shoe Industry Revenue (Million) Forecast, by Application 2020 & 2033
- Table 62: Australia Athletic Shoe Industry Volume (K Units) Forecast, by Application 2020 & 2033
- Table 63: Rest of Asia Pacific Athletic Shoe Industry Revenue (Million) Forecast, by Application 2020 & 2033
- Table 64: Rest of Asia Pacific Athletic Shoe Industry Volume (K Units) Forecast, by Application 2020 & 2033
- Table 65: Global Athletic Shoe Industry Revenue Million Forecast, by Product Type 2020 & 2033
- Table 66: Global Athletic Shoe Industry Volume K Units Forecast, by Product Type 2020 & 2033
- Table 67: Global Athletic Shoe Industry Revenue Million Forecast, by End User 2020 & 2033
- Table 68: Global Athletic Shoe Industry Volume K Units Forecast, by End User 2020 & 2033
- Table 69: Global Athletic Shoe Industry Revenue Million Forecast, by Distribution Channel 2020 & 2033
- Table 70: Global Athletic Shoe Industry Volume K Units Forecast, by Distribution Channel 2020 & 2033
- Table 71: Global Athletic Shoe Industry Revenue Million Forecast, by Country 2020 & 2033
- Table 72: Global Athletic Shoe Industry Volume K Units Forecast, by Country 2020 & 2033
- Table 73: Brazil Athletic Shoe Industry Revenue (Million) Forecast, by Application 2020 & 2033
- Table 74: Brazil Athletic Shoe Industry Volume (K Units) Forecast, by Application 2020 & 2033
- Table 75: Argentina Athletic Shoe Industry Revenue (Million) Forecast, by Application 2020 & 2033
- Table 76: Argentina Athletic Shoe Industry Volume (K Units) Forecast, by Application 2020 & 2033
- Table 77: Rest of South America Athletic Shoe Industry Revenue (Million) Forecast, by Application 2020 & 2033
- Table 78: Rest of South America Athletic Shoe Industry Volume (K Units) Forecast, by Application 2020 & 2033
- Table 79: Global Athletic Shoe Industry Revenue Million Forecast, by Product Type 2020 & 2033
- Table 80: Global Athletic Shoe Industry Volume K Units Forecast, by Product Type 2020 & 2033
- Table 81: Global Athletic Shoe Industry Revenue Million Forecast, by End User 2020 & 2033
- Table 82: Global Athletic Shoe Industry Volume K Units Forecast, by End User 2020 & 2033
- Table 83: Global Athletic Shoe Industry Revenue Million Forecast, by Distribution Channel 2020 & 2033
- Table 84: Global Athletic Shoe Industry Volume K Units Forecast, by Distribution Channel 2020 & 2033
- Table 85: Global Athletic Shoe Industry Revenue Million Forecast, by Country 2020 & 2033
- Table 86: Global Athletic Shoe Industry Volume K Units Forecast, by Country 2020 & 2033
- Table 87: Saudi Arabia Athletic Shoe Industry Revenue (Million) Forecast, by Application 2020 & 2033
- Table 88: Saudi Arabia Athletic Shoe Industry Volume (K Units) Forecast, by Application 2020 & 2033
- Table 89: South Africa Athletic Shoe Industry Revenue (Million) Forecast, by Application 2020 & 2033
- Table 90: South Africa Athletic Shoe Industry Volume (K Units) Forecast, by Application 2020 & 2033
- Table 91: Rest of Middle East and Africa Athletic Shoe Industry Revenue (Million) Forecast, by Application 2020 & 2033
- Table 92: Rest of Middle East and Africa Athletic Shoe Industry Volume (K Units) Forecast, by Application 2020 & 2033
Frequently Asked Questions
1. What is the projected Compound Annual Growth Rate (CAGR) of the Athletic Shoe Industry?
The projected CAGR is approximately 6.86%.
2. Which companies are prominent players in the Athletic Shoe Industry?
Key companies in the market include Adidas AG, Columbia Sportswear Company, VF Corporation, SKECHERS USA Inc, Asics Corporation, Puma SE, Under Armour Inc, Nike Inc, New Balance Athletics Inc, Fila.
3. What are the main segments of the Athletic Shoe Industry?
The market segments include Product Type, End User, Distribution Channel.
4. Can you provide details about the market size?
The market size is estimated to be USD 173.89 Million as of 2022.
5. What are some drivers contributing to market growth?
Aggressive Marketing And Strategies By Brands; Enhanced Participation In Recreational And Outdoor/Sports Activities.
6. What are the notable trends driving market growth?
Growing Sports Participation and Influence of Athleisure.
7. Are there any restraints impacting market growth?
Unorganized Footwear Sector And Availability Of Counterfeit Goods.
8. Can you provide examples of recent developments in the market?
June 2024: Nike launched the Converse Run Star Trainer, a low-profile shoe built from the ground up, combining retro and modern aesthetics. The silhouette is inspired by Converse’s deep history in sport but designed for modern life.
9. What pricing options are available for accessing the report?
Pricing options include single-user, multi-user, and enterprise licenses priced at USD 4750, USD 5250, and USD 8750 respectively.
10. Is the market size provided in terms of value or volume?
The market size is provided in terms of value, measured in Million and volume, measured in K Units.
11. Are there any specific market keywords associated with the report?
Yes, the market keyword associated with the report is "Athletic Shoe Industry," which aids in identifying and referencing the specific market segment covered.
12. How do I determine which pricing option suits my needs best?
The pricing options vary based on user requirements and access needs. Individual users may opt for single-user licenses, while businesses requiring broader access may choose multi-user or enterprise licenses for cost-effective access to the report.
13. Are there any additional resources or data provided in the Athletic Shoe Industry report?
While the report offers comprehensive insights, it's advisable to review the specific contents or supplementary materials provided to ascertain if additional resources or data are available.
14. How can I stay updated on further developments or reports in the Athletic Shoe Industry?
To stay informed about further developments, trends, and reports in the Athletic Shoe Industry, consider subscribing to industry newsletters, following relevant companies and organizations, or regularly checking reputable industry news sources and publications.
Methodology
Step 1 - Identification of Relevant Samples Size from Population Database


Step 2 - Approaches for Defining Global Market Size (Value, Volume* & Price*)

Note*: In applicable scenarios
Step 3 - Data Sources
Primary Research
- Web Analytics
- Survey Reports
- Research Institute
- Latest Research Reports
- Opinion Leaders
Secondary Research
- Annual Reports
- White Paper
- Latest Press Release
- Industry Association
- Paid Database
- Investor Presentations

Step 4 - Data Triangulation
Involves using different sources of information in order to increase the validity of a study
These sources are likely to be stakeholders in a program - participants, other researchers, program staff, other community members, and so on.
Then we put all data in single framework & apply various statistical tools to find out the dynamic on the market.
During the analysis stage, feedback from the stakeholder groups would be compared to determine areas of agreement as well as areas of divergence