

Key Insights
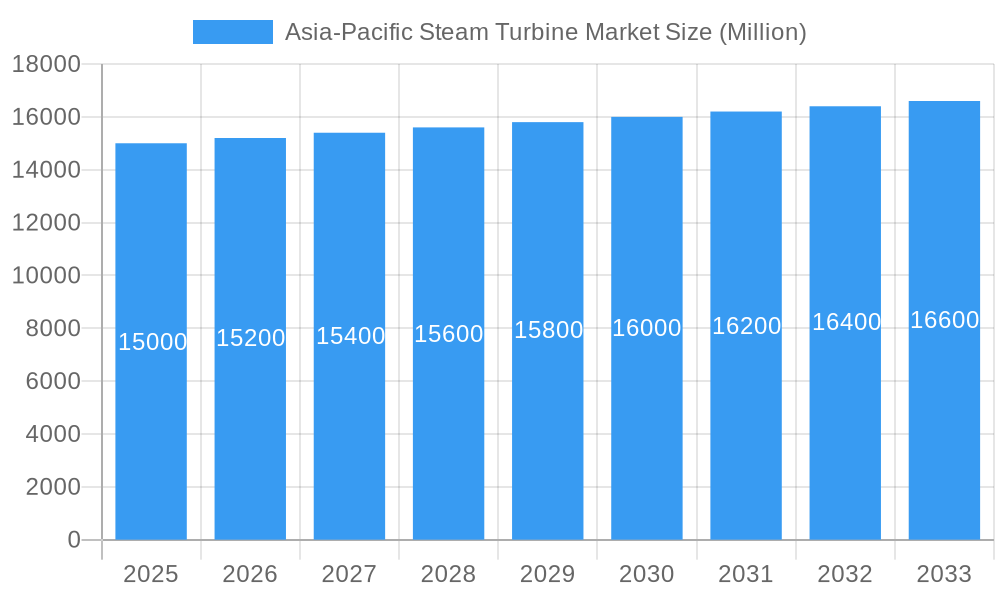
The Asia-Pacific steam turbine market is projected to reach $19.61 billion by 2025, with an anticipated Compound Annual Growth Rate (CAGR) of 3.2% from 2025 to 2033. This robust expansion is propelled by escalating energy demands in rapidly developing economies such as China, India, and Southeast Asia, necessitating efficient power generation solutions. Modernization and expansion of existing power plants, aimed at enhancing efficiency and reliability, also significantly contribute to market growth. Government initiatives promoting energy infrastructure development and cleaner energy sources, alongside evolving emission regulations, are fostering opportunities for advanced steam turbine technologies. The market is segmented by plant type, with coal and gas-fired plants holding the largest share, and by capacity, where units above 40 MW are expected to experience higher demand due to utility-scale projects. Leading players like General Electric, Siemens Energy, and Mitsubishi Power are actively pursuing technological advancements and strategic partnerships. Key challenges include fluctuating fuel prices and growing environmental concerns.
Asia-Pacific Steam Turbine Market Market Size (In Billion)
The competitive environment features both established global enterprises, leveraging extensive experience and technological expertise, and increasingly influential regional players, strengthened by strategic collaborations and R&D investments. Navigating diverse regulatory frameworks, infrastructure development, and varying energy mixes across the Asia-Pacific region presents both opportunities and challenges. The forecast period (2025-2033) anticipates sustained growth driven by ongoing industrialization, rising electricity consumption, and infrastructure development. Market success will depend on effectively managing environmental regulations, adopting technological innovations, and adapting to regional economic fluctuations.
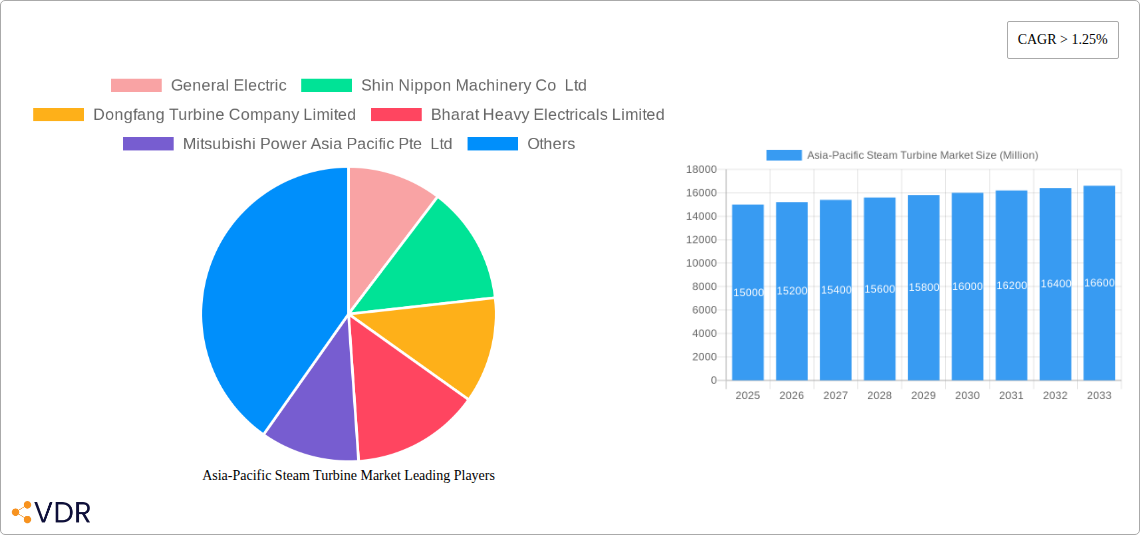
Asia-Pacific Steam Turbine Market Company Market Share
Asia-Pacific Steam Turbine Market: A Comprehensive Report (2019-2033)
This in-depth report provides a comprehensive analysis of the Asia-Pacific steam turbine market, covering market dynamics, growth trends, regional dominance, product landscape, key players, and future outlook. With a study period spanning 2019-2033, a base year of 2025, and a forecast period of 2025-2033, this report is an essential resource for industry professionals, investors, and strategic decision-makers. The report segments the market by plant type (Gas, Coal, Nuclear, Other Plant Types) and capacity (Below 40 MW, Above 40 MW), offering granular insights into market performance across various segments. The total market size is projected to reach xx Million units by 2033.
Asia-Pacific Steam Turbine Market Dynamics & Structure
The Asia-Pacific steam turbine market is characterized by a moderately concentrated landscape, with key players like General Electric, Shin Nippon Machinery Co Ltd, Dongfang Turbine Company Limited, and Bharat Heavy Electricals Limited holding significant market shares. Technological innovation, particularly in efficiency improvements and emissions reduction, is a major driver, alongside stringent regulatory frameworks promoting cleaner energy sources. The market also faces competition from alternative power generation technologies, such as solar and wind. Mergers and acquisitions (M&A) activity has been moderate, with strategic partnerships playing a larger role in market consolidation.
- Market Concentration: Moderately concentrated, with top 5 players holding approximately xx% market share in 2024.
- Technological Innovation: Focus on higher efficiency, lower emissions, and digitalization.
- Regulatory Framework: Stringent emission standards driving demand for advanced turbines.
- Competitive Substitutes: Solar, wind, and other renewable energy sources pose competition.
- End-User Demographics: Primarily power generation companies and industrial users.
- M&A Trends: Moderate activity, with strategic alliances gaining prominence. The number of M&A deals in the sector averaged xx per year between 2019 and 2024.
Asia-Pacific Steam Turbine Market Growth Trends & Insights
The Asia-Pacific steam turbine market has witnessed significant growth over the past five years, driven by increasing electricity demand, infrastructure development, and industrial expansion across the region. The market size experienced a CAGR of xx% during the historical period (2019-2024), reaching xx Million units in 2024. This growth is projected to continue, albeit at a slightly moderated pace, during the forecast period (2025-2033), with a projected CAGR of xx%. Technological advancements leading to improved efficiency and reduced operational costs are key drivers. Shifting consumer preferences towards cleaner energy sources are also influencing market dynamics. Market penetration of advanced steam turbine technologies is expected to increase from xx% in 2024 to xx% by 2033. The adoption rate is particularly high in regions with robust power generation infrastructure and government initiatives promoting sustainable energy.
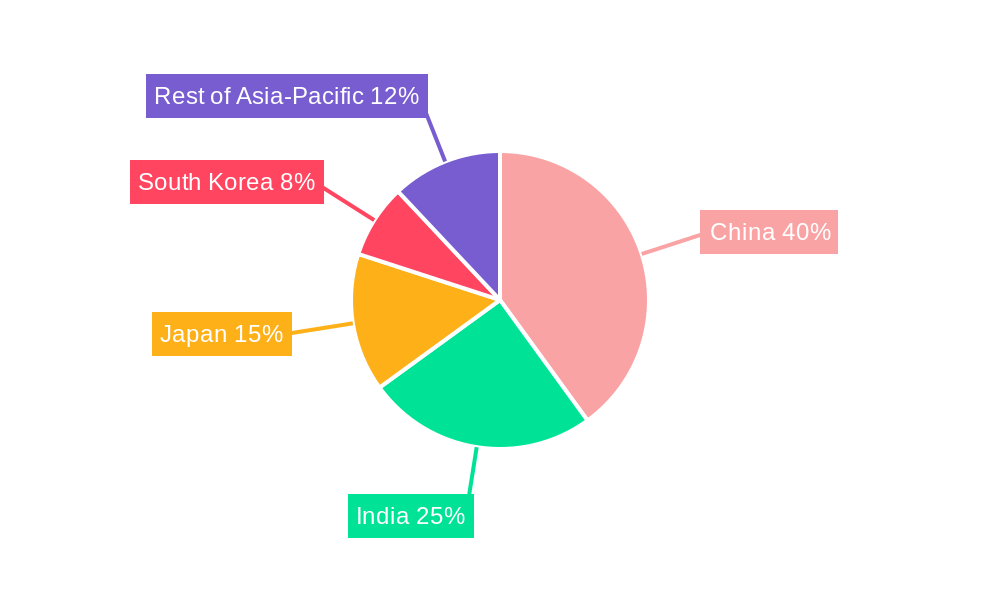
Dominant Regions, Countries, or Segments in Asia-Pacific Steam Turbine Market
China and India dominate the Asia-Pacific steam turbine market, driven by their massive energy demand and ongoing infrastructure development projects. The coal-fired segment currently holds the largest market share, but the gas-fired segment is experiencing faster growth due to its relatively lower emissions profile and supportive government policies. The above 40 MW capacity segment accounts for a larger share of the market, reflecting the preference for larger-scale power generation projects.
- Key Drivers:
- China & India: Rapid industrialization and expanding power grids.
- Government Policies: Initiatives promoting energy security and sustainable power generation.
- Infrastructure Development: Investments in new power plants and grid modernization.
- Dominant Segments: Coal (xx% market share in 2024), followed by Gas (xx%), and Above 40 MW capacity segment (xx%).
Asia-Pacific Steam Turbine Market Product Landscape
The Asia-Pacific steam turbine market features a range of products, from conventional steam turbines to advanced designs incorporating digital technologies for enhanced efficiency and performance monitoring. Innovations focus on improved blade designs, advanced materials, and digital control systems to optimize performance and reduce downtime. Key features include improved efficiency, reduced emissions, and enhanced reliability.
Key Drivers, Barriers & Challenges in Asia-Pacific Steam Turbine Market
Key Drivers:
- Increasing energy demand driven by economic growth and population increase.
- Government policies promoting energy security and renewable energy integration.
- Technological advancements improving turbine efficiency and reducing emissions.
Key Challenges:
- Competition from renewable energy sources (e.g., solar, wind) which is estimated to reduce the market size by xx Million units by 2033.
- Stringent environmental regulations increasing compliance costs.
- Supply chain disruptions impacting production and delivery timelines.
Emerging Opportunities in Asia-Pacific Steam Turbine Market
- Growing demand for combined cycle power plants integrating steam turbines with gas turbines.
- Increasing adoption of digital technologies for remote monitoring and predictive maintenance.
- Expansion into untapped markets in Southeast Asia and other developing economies.
Growth Accelerators in the Asia-Pacific Steam Turbine Market Industry
Technological breakthroughs in materials science, advanced blade design, and digitalization are key growth accelerators. Strategic partnerships between turbine manufacturers and power generation companies are also driving market expansion. Moreover, expansion into emerging markets and diversification into new applications will propel long-term growth.
Key Players Shaping the Asia-Pacific Steam Turbine Market Market
- General Electric
- Shin Nippon Machinery Co Ltd
- Dongfang Turbine Company Limited
- Bharat Heavy Electricals Limited
- Mitsubishi Power Asia Pacific Pte Ltd
- Siemens Energy
- Shanghai Electric Group Company Ltd
- Kawasaki Heavy Industries Ltd
Notable Milestones in Asia-Pacific Steam Turbine Market Sector
- March 2022: GE Gas Power awarded a contract for three 9HA.01 heavy-duty gas turbines for a power plant in Shenzhen, China.
- July 2021: Bharat Heavy Electricals Limited (BHEL) secured a contract to supply 12 steam generators to NPCIL for its PHWRs.
In-Depth Asia-Pacific Steam Turbine Market Market Outlook
The Asia-Pacific steam turbine market is poised for continued growth, driven by sustained energy demand and ongoing infrastructure development. Strategic investments in advanced technologies and expansion into new markets will unlock significant growth opportunities. The market's future hinges on adapting to the evolving energy landscape, integrating renewable energy sources, and meeting stringent environmental regulations. The market is expected to continue growing, albeit at a slower rate, driven by replacement and upgrade cycles and new capacities in developing economies.
Asia-Pacific Steam Turbine Market Segmentation
-
1. Plant Type
- 1.1. Gas
- 1.2. Coal
- 1.3. Nuclear
- 1.4. Other Pant Types
-
2. Capacity
- 2.1. Below 40 MW
- 2.2. Above 40 MW
-
3. Geography
- 3.1. China
- 3.2. India
- 3.3. Japan
- 3.4. Australia
- 3.5. Rest of Asia-Pacific
Asia-Pacific Steam Turbine Market Segmentation By Geography
- 1. China
- 2. India
- 3. Japan
- 4. Australia
- 5. Rest of Asia Pacific
Asia-Pacific Steam Turbine Market Regional Market Share
Geographic Coverage of Asia-Pacific Steam Turbine Market
Asia-Pacific Steam Turbine Market REPORT HIGHLIGHTS
| Aspects | Details |
|---|---|
| Study Period | 2020-2034 |
| Base Year | 2025 |
| Estimated Year | 2026 |
| Forecast Period | 2026-2034 |
| Historical Period | 2020-2025 |
| Growth Rate | CAGR of 3.2% from 2020-2034 |
| Segmentation |
|
Table of Contents
- 1. Introduction
- 1.1. Research Scope
- 1.2. Market Segmentation
- 1.3. Research Objective
- 1.4. Definitions and Assumptions
- 2. Executive Summary
- 2.1. Market Snapshot
- 3. Market Dynamics
- 3.1. Market Drivers
- 3.2. Market Restrains
- 3.3. Market Trends
- 3.4. Market Opportunities
- 4. Market Factor Analysis
- 4.1. Porters Five Forces
- 4.1.1. Bargaining Power of Suppliers
- 4.1.2. Bargaining Power of Buyers
- 4.1.3. Threat of New Entrants
- 4.1.4. Threat of Substitutes
- 4.1.5. Competitive Rivalry
- 4.2. PESTEL analysis
- 4.3. BCG Analysis
- 4.3.1. Stars (High Growth, High Market Share)
- 4.3.2. Cash Cows (Low Growth, High Market Share)
- 4.3.3. Question Mark (High Growth, Low Market Share)
- 4.3.4. Dogs (Low Growth, Low Market Share)
- 4.4. Ansoff Matrix Analysis
- 4.5. Supply Chain Analysis
- 4.6. Regulatory Landscape
- 4.7. Current Market Potential and Opportunity Assessment (TAM–SAM–SOM Framework)
- 4.8. VDR Analyst Note
- 4.1. Porters Five Forces
- 5. Market Analysis, Insights and Forecast 2021-2033
- 5.1. Market Analysis, Insights and Forecast - by Plant Type
- 5.1.1. Gas
- 5.1.2. Coal
- 5.1.3. Nuclear
- 5.1.4. Other Pant Types
- 5.2. Market Analysis, Insights and Forecast - by Capacity
- 5.2.1. Below 40 MW
- 5.2.2. Above 40 MW
- 5.3. Market Analysis, Insights and Forecast - by Geography
- 5.3.1. China
- 5.3.2. India
- 5.3.3. Japan
- 5.3.4. Australia
- 5.3.5. Rest of Asia-Pacific
- 5.4. Market Analysis, Insights and Forecast - by Region
- 5.4.1. China
- 5.4.2. India
- 5.4.3. Japan
- 5.4.4. Australia
- 5.4.5. Rest of Asia Pacific
- 5.1. Market Analysis, Insights and Forecast - by Plant Type
- 6. Asia-Pacific Steam Turbine Market Analysis, Insights and Forecast, 2021-2033
- 6.1. Market Analysis, Insights and Forecast - by Plant Type
- 6.1.1. Gas
- 6.1.2. Coal
- 6.1.3. Nuclear
- 6.1.4. Other Pant Types
- 6.2. Market Analysis, Insights and Forecast - by Capacity
- 6.2.1. Below 40 MW
- 6.2.2. Above 40 MW
- 6.3. Market Analysis, Insights and Forecast - by Geography
- 6.3.1. China
- 6.3.2. India
- 6.3.3. Japan
- 6.3.4. Australia
- 6.3.5. Rest of Asia-Pacific
- 6.1. Market Analysis, Insights and Forecast - by Plant Type
- 7. China Asia-Pacific Steam Turbine Market Analysis, Insights and Forecast, 2021-2033
- 7.1. Market Analysis, Insights and Forecast - by Plant Type
- 7.1.1. Gas
- 7.1.2. Coal
- 7.1.3. Nuclear
- 7.1.4. Other Pant Types
- 7.2. Market Analysis, Insights and Forecast - by Capacity
- 7.2.1. Below 40 MW
- 7.2.2. Above 40 MW
- 7.3. Market Analysis, Insights and Forecast - by Geography
- 7.3.1. China
- 7.3.2. India
- 7.3.3. Japan
- 7.3.4. Australia
- 7.3.5. Rest of Asia-Pacific
- 7.1. Market Analysis, Insights and Forecast - by Plant Type
- 8. India Asia-Pacific Steam Turbine Market Analysis, Insights and Forecast, 2021-2033
- 8.1. Market Analysis, Insights and Forecast - by Plant Type
- 8.1.1. Gas
- 8.1.2. Coal
- 8.1.3. Nuclear
- 8.1.4. Other Pant Types
- 8.2. Market Analysis, Insights and Forecast - by Capacity
- 8.2.1. Below 40 MW
- 8.2.2. Above 40 MW
- 8.3. Market Analysis, Insights and Forecast - by Geography
- 8.3.1. China
- 8.3.2. India
- 8.3.3. Japan
- 8.3.4. Australia
- 8.3.5. Rest of Asia-Pacific
- 8.1. Market Analysis, Insights and Forecast - by Plant Type
- 9. Japan Asia-Pacific Steam Turbine Market Analysis, Insights and Forecast, 2021-2033
- 9.1. Market Analysis, Insights and Forecast - by Plant Type
- 9.1.1. Gas
- 9.1.2. Coal
- 9.1.3. Nuclear
- 9.1.4. Other Pant Types
- 9.2. Market Analysis, Insights and Forecast - by Capacity
- 9.2.1. Below 40 MW
- 9.2.2. Above 40 MW
- 9.3. Market Analysis, Insights and Forecast - by Geography
- 9.3.1. China
- 9.3.2. India
- 9.3.3. Japan
- 9.3.4. Australia
- 9.3.5. Rest of Asia-Pacific
- 9.1. Market Analysis, Insights and Forecast - by Plant Type
- 10. Australia Asia-Pacific Steam Turbine Market Analysis, Insights and Forecast, 2021-2033
- 10.1. Market Analysis, Insights and Forecast - by Plant Type
- 10.1.1. Gas
- 10.1.2. Coal
- 10.1.3. Nuclear
- 10.1.4. Other Pant Types
- 10.2. Market Analysis, Insights and Forecast - by Capacity
- 10.2.1. Below 40 MW
- 10.2.2. Above 40 MW
- 10.3. Market Analysis, Insights and Forecast - by Geography
- 10.3.1. China
- 10.3.2. India
- 10.3.3. Japan
- 10.3.4. Australia
- 10.3.5. Rest of Asia-Pacific
- 10.1. Market Analysis, Insights and Forecast - by Plant Type
- 11. Rest of Asia Pacific Asia-Pacific Steam Turbine Market Analysis, Insights and Forecast, 2021-2033
- 11.1. Market Analysis, Insights and Forecast - by Plant Type
- 11.1.1. Gas
- 11.1.2. Coal
- 11.1.3. Nuclear
- 11.1.4. Other Pant Types
- 11.2. Market Analysis, Insights and Forecast - by Capacity
- 11.2.1. Below 40 MW
- 11.2.2. Above 40 MW
- 11.3. Market Analysis, Insights and Forecast - by Geography
- 11.3.1. China
- 11.3.2. India
- 11.3.3. Japan
- 11.3.4. Australia
- 11.3.5. Rest of Asia-Pacific
- 11.1. Market Analysis, Insights and Forecast - by Plant Type
- 12. Competitive Analysis
- 12.1. Company Profiles
- 12.1.1 General Electric
- 12.1.1.1. Company Overview
- 12.1.1.2. Products
- 12.1.1.3. Company Financials
- 12.1.1.4. SWOT Analysis
- 12.1.2 Shin Nippon Machinery Co Ltd
- 12.1.2.1. Company Overview
- 12.1.2.2. Products
- 12.1.2.3. Company Financials
- 12.1.2.4. SWOT Analysis
- 12.1.3 Dongfang Turbine Company Limited
- 12.1.3.1. Company Overview
- 12.1.3.2. Products
- 12.1.3.3. Company Financials
- 12.1.3.4. SWOT Analysis
- 12.1.4 Bharat Heavy Electricals Limited
- 12.1.4.1. Company Overview
- 12.1.4.2. Products
- 12.1.4.3. Company Financials
- 12.1.4.4. SWOT Analysis
- 12.1.5 Mitsubishi Power Asia Pacific Pte Ltd
- 12.1.5.1. Company Overview
- 12.1.5.2. Products
- 12.1.5.3. Company Financials
- 12.1.5.4. SWOT Analysis
- 12.1.6 Siemens Energy
- 12.1.6.1. Company Overview
- 12.1.6.2. Products
- 12.1.6.3. Company Financials
- 12.1.6.4. SWOT Analysis
- 12.1.7 Shanghai Electric Group Company Ltd*List Not Exhaustive
- 12.1.7.1. Company Overview
- 12.1.7.2. Products
- 12.1.7.3. Company Financials
- 12.1.7.4. SWOT Analysis
- 12.1.8 Kawasaki Heavy Industries Ltd
- 12.1.8.1. Company Overview
- 12.1.8.2. Products
- 12.1.8.3. Company Financials
- 12.1.8.4. SWOT Analysis
- 12.1.1 General Electric
- 12.2. Market Entropy
- 12.2.1 Company's Key Areas Served
- 12.2.2 Recent Developments
- 12.3. Company Market Share Analysis 2025
- 12.3.1 Top 5 Companies Market Share Analysis
- 12.3.2 Top 3 Companies Market Share Analysis
- 12.4. List of Potential Customers
- 13. Research Methodology
List of Figures
- Figure 1: Asia-Pacific Steam Turbine Market Revenue Breakdown (billion, %) by Product 2025 & 2033
- Figure 2: Asia-Pacific Steam Turbine Market Share (%) by Company 2025
List of Tables
- Table 1: Asia-Pacific Steam Turbine Market Revenue billion Forecast, by Plant Type 2020 & 2033
- Table 2: Asia-Pacific Steam Turbine Market Revenue billion Forecast, by Capacity 2020 & 2033
- Table 3: Asia-Pacific Steam Turbine Market Revenue billion Forecast, by Geography 2020 & 2033
- Table 4: Asia-Pacific Steam Turbine Market Revenue billion Forecast, by Region 2020 & 2033
- Table 5: Asia-Pacific Steam Turbine Market Revenue billion Forecast, by Plant Type 2020 & 2033
- Table 6: Asia-Pacific Steam Turbine Market Revenue billion Forecast, by Capacity 2020 & 2033
- Table 7: Asia-Pacific Steam Turbine Market Revenue billion Forecast, by Geography 2020 & 2033
- Table 8: Asia-Pacific Steam Turbine Market Revenue billion Forecast, by Country 2020 & 2033
- Table 9: Asia-Pacific Steam Turbine Market Revenue billion Forecast, by Plant Type 2020 & 2033
- Table 10: Asia-Pacific Steam Turbine Market Revenue billion Forecast, by Capacity 2020 & 2033
- Table 11: Asia-Pacific Steam Turbine Market Revenue billion Forecast, by Geography 2020 & 2033
- Table 12: Asia-Pacific Steam Turbine Market Revenue billion Forecast, by Country 2020 & 2033
- Table 13: Asia-Pacific Steam Turbine Market Revenue billion Forecast, by Plant Type 2020 & 2033
- Table 14: Asia-Pacific Steam Turbine Market Revenue billion Forecast, by Capacity 2020 & 2033
- Table 15: Asia-Pacific Steam Turbine Market Revenue billion Forecast, by Geography 2020 & 2033
- Table 16: Asia-Pacific Steam Turbine Market Revenue billion Forecast, by Country 2020 & 2033
- Table 17: Asia-Pacific Steam Turbine Market Revenue billion Forecast, by Plant Type 2020 & 2033
- Table 18: Asia-Pacific Steam Turbine Market Revenue billion Forecast, by Capacity 2020 & 2033
- Table 19: Asia-Pacific Steam Turbine Market Revenue billion Forecast, by Geography 2020 & 2033
- Table 20: Asia-Pacific Steam Turbine Market Revenue billion Forecast, by Country 2020 & 2033
- Table 21: Asia-Pacific Steam Turbine Market Revenue billion Forecast, by Plant Type 2020 & 2033
- Table 22: Asia-Pacific Steam Turbine Market Revenue billion Forecast, by Capacity 2020 & 2033
- Table 23: Asia-Pacific Steam Turbine Market Revenue billion Forecast, by Geography 2020 & 2033
- Table 24: Asia-Pacific Steam Turbine Market Revenue billion Forecast, by Country 2020 & 2033
Frequently Asked Questions
1. What is the projected Compound Annual Growth Rate (CAGR) of the Asia-Pacific Steam Turbine Market?
The projected CAGR is approximately 3.2%.
2. Which companies are prominent players in the Asia-Pacific Steam Turbine Market?
Key companies in the market include General Electric, Shin Nippon Machinery Co Ltd, Dongfang Turbine Company Limited, Bharat Heavy Electricals Limited, Mitsubishi Power Asia Pacific Pte Ltd, Siemens Energy, Shanghai Electric Group Company Ltd*List Not Exhaustive, Kawasaki Heavy Industries Ltd.
3. What are the main segments of the Asia-Pacific Steam Turbine Market?
The market segments include Plant Type, Capacity, Geography.
4. Can you provide details about the market size?
The market size is estimated to be USD 19.61 billion as of 2022.
5. What are some drivers contributing to market growth?
4.; Increasing Population Growth and Infrastructure Development.
6. What are the notable trends driving market growth?
Natural Gas Plants are Likely to Dominate the Market.
7. Are there any restraints impacting market growth?
4.; High Operational and Maintenance Costs.
8. Can you provide examples of recent developments in the market?
In March 2022, the Chinese state-owned power utility Shenzhen Energy Group announced that it had awarded GE Gas Power and Chinese power company Harbin Electric a supply contract for power generation equipment. Under the contract, GE will supply three 9HA.01 heavy-duty gas turbines for the power plant located in the Shenzhen Guangming district of China's Guangdong province.
9. What pricing options are available for accessing the report?
Pricing options include single-user, multi-user, and enterprise licenses priced at USD 4750, USD 5250, and USD 8750 respectively.
10. Is the market size provided in terms of value or volume?
The market size is provided in terms of value, measured in billion.
11. Are there any specific market keywords associated with the report?
Yes, the market keyword associated with the report is "Asia-Pacific Steam Turbine Market," which aids in identifying and referencing the specific market segment covered.
12. How do I determine which pricing option suits my needs best?
The pricing options vary based on user requirements and access needs. Individual users may opt for single-user licenses, while businesses requiring broader access may choose multi-user or enterprise licenses for cost-effective access to the report.
13. Are there any additional resources or data provided in the Asia-Pacific Steam Turbine Market report?
While the report offers comprehensive insights, it's advisable to review the specific contents or supplementary materials provided to ascertain if additional resources or data are available.
14. How can I stay updated on further developments or reports in the Asia-Pacific Steam Turbine Market?
To stay informed about further developments, trends, and reports in the Asia-Pacific Steam Turbine Market, consider subscribing to industry newsletters, following relevant companies and organizations, or regularly checking reputable industry news sources and publications.
Methodology
Step 1 - Identification of Relevant Samples Size from Population Database


Step 2 - Approaches for Defining Global Market Size (Value, Volume* & Price*)

Note*: In applicable scenarios
Step 3 - Data Sources
Primary Research
- Web Analytics
- Survey Reports
- Research Institute
- Latest Research Reports
- Opinion Leaders
Secondary Research
- Annual Reports
- White Paper
- Latest Press Release
- Industry Association
- Paid Database
- Investor Presentations

Step 4 - Data Triangulation
Involves using different sources of information in order to increase the validity of a study
These sources are likely to be stakeholders in a program - participants, other researchers, program staff, other community members, and so on.
Then we put all data in single framework & apply various statistical tools to find out the dynamic on the market.
During the analysis stage, feedback from the stakeholder groups would be compared to determine areas of agreement as well as areas of divergence