

Key Insights
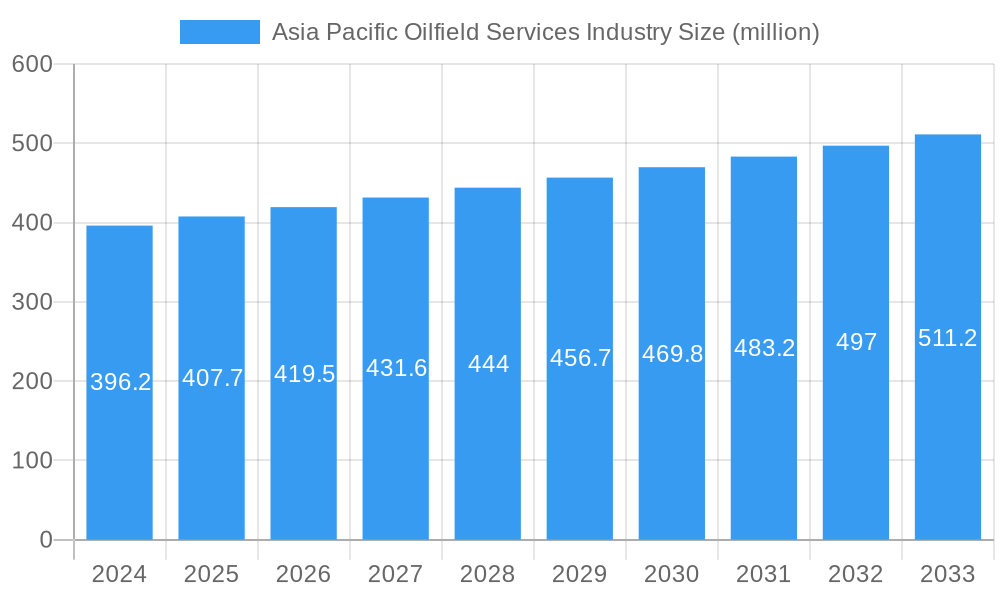
The Asia Pacific Oilfield Services market is poised for steady expansion, projected to reach $396.2 million in 2024 with a Compound Annual Growth Rate (CAGR) of 2.9% through 2033. This growth is underpinned by increasing energy demand across the region, particularly in developing economies like China and India, which are heavily reliant on oil and gas for their industrial and domestic needs. Key drivers include ongoing exploration and production activities, the need for enhanced oil recovery (EOR) techniques to maximize output from existing fields, and significant investments in both onshore and offshore infrastructure. The industry is witnessing a trend towards more technologically advanced services, including digital oilfield solutions and automation, aimed at improving efficiency, reducing operational costs, and enhancing safety. This technological adoption is crucial for overcoming the challenges posed by increasingly complex reservoir conditions and the declining productivity of mature fields.
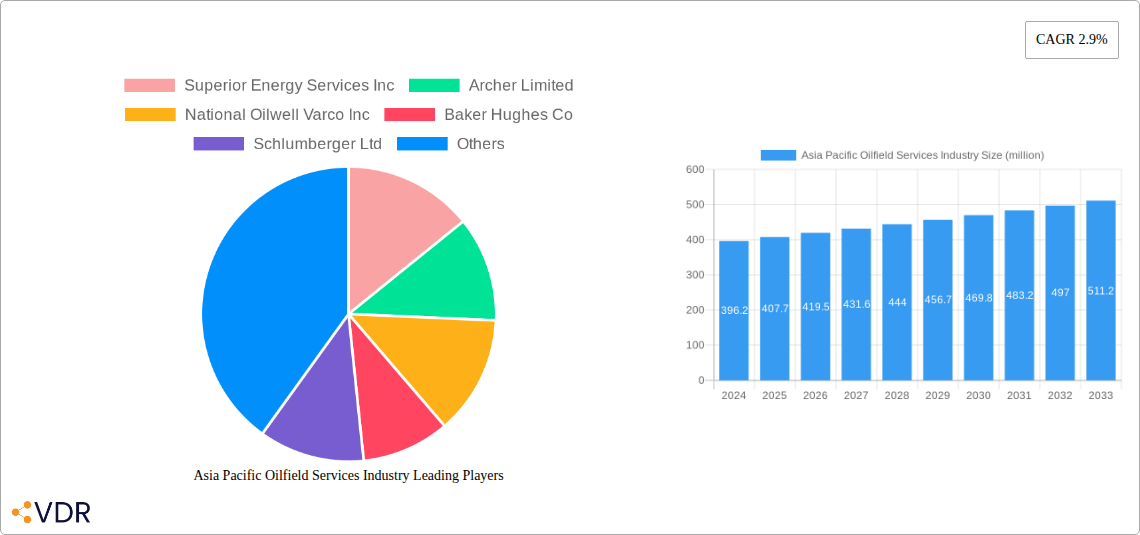
Asia Pacific Oilfield Services Industry Market Size (In Million)
Despite a generally positive outlook, the market faces certain restraints. Fluctuations in global oil prices can significantly impact exploration and production budgets, leading to project delays or cancellations. Geopolitical instability in certain sub-regions can also disrupt supply chains and investment flows. Furthermore, stringent environmental regulations and growing pressure for a transition towards renewable energy sources may temper long-term growth prospects for traditional oilfield services. However, the inherent need for hydrocarbons in the foreseeable future, coupled with strategic government initiatives to bolster energy security in the Asia Pacific, ensures continued demand for these essential services. The market is segmented by location of deployment (onshore and offshore), service type (drilling, completion, production, and others), and further analyzed across key geographies like India, China, Indonesia, and the Rest of Asia Pacific, all of which contribute to the dynamic landscape of this vital industry.
Asia Pacific Oilfield Services Industry Company Market Share
This in-depth report provides a granular analysis of the Asia Pacific Oilfield Services Industry, encompassing market dynamics, growth trends, regional dominance, product landscape, key drivers, challenges, opportunities, and the strategic positioning of major players. With a study period spanning from 2019 to 2033, and a base year of 2025, this report offers critical insights for stakeholders navigating the complex and evolving oilfield services landscape in the region. We dissect parent and child market segments to offer unparalleled clarity on market segmentation and growth potential.
Asia Pacific Oilfield Services Industry Market Dynamics & Structure
The Asia Pacific oilfield services industry is characterized by a dynamic market structure, with notable concentration among a few dominant players, while also fostering opportunities for specialized service providers. Technological innovation remains a primary driver, pushing advancements in drilling efficiency, reservoir management, and production optimization. Regulatory frameworks across diverse Asian nations present a mixed landscape, influencing investment decisions and operational compliance for oilfield service companies. Competitive product substitutes, while present in some service categories, are often outmaneuvered by integrated solutions and proprietary technologies offered by leading firms. End-user demographics are shifting, with an increasing demand for technically sophisticated services from national oil companies and international oil companies alike. Mergers and acquisitions (M&A) trends are a significant aspect of market consolidation, as companies seek to expand their service portfolios, geographic reach, and technological capabilities. For instance, in the historical period of 2019-2024, we anticipate a significant volume of M&A activities, potentially exceeding 15 significant deals in terms of value, aimed at acquiring niche technologies or consolidating market share in high-growth geographies. The barriers to innovation are often rooted in high capital expenditure requirements for R&D and the stringent safety and environmental regulations governing the sector.
Asia Pacific Oilfield Services Industry Growth Trends & Insights
The Asia Pacific oilfield services industry is poised for robust growth, driven by escalating energy demand and strategic investments in exploration and production activities. The market size is projected to witness a significant expansion from approximately USD 45,000 million in the base year 2025 to an estimated USD 65,000 million by 2033, exhibiting a compound annual growth rate (CAGR) of approximately 4.8%. Adoption rates for advanced technologies, such as digital oilfield solutions, artificial intelligence in reservoir characterization, and enhanced oil recovery (EOR) techniques, are steadily increasing, reflecting a proactive approach to optimizing hydrocarbon extraction. Technological disruptions are continuously reshaping the service delivery models, with a greater emphasis on efficiency, cost reduction, and environmental sustainability. Consumer behavior shifts are evident, with operators increasingly seeking integrated service packages that streamline operations and reduce project timelines. Market penetration for specialized services, such as subsea intervention and unconventional resource development, is expected to surge as exploration frontiers expand. The adoption of digital twins for predictive maintenance and real-time operational monitoring is becoming a standard practice, further enhancing efficiency and safety across the industry. The increasing focus on deepwater exploration in regions like Southeast Asia also contributes significantly to the growth trajectory of specialized offshore services.
Dominant Regions, Countries, or Segments in Asia Pacific Oilfield Services Industry
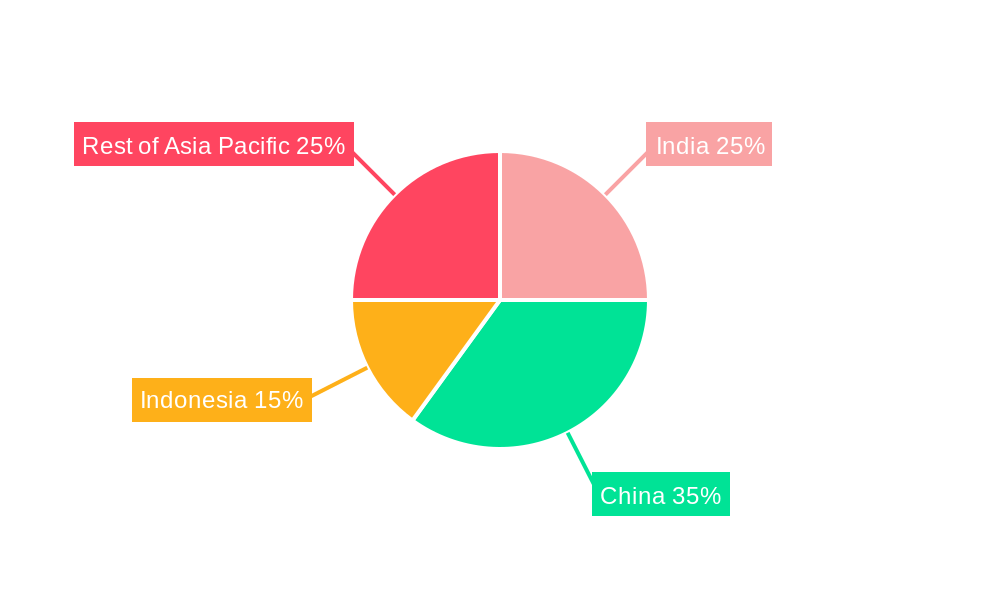
China and India are emerging as the dominant forces within the Asia Pacific oilfield services industry, propelled by substantial domestic energy demands and aggressive exploration and production strategies. In terms of Location of Deployment, the Offshore segment is anticipated to experience accelerated growth, driven by the region's rich deepwater and shallow water reserves, particularly in Southeast Asia and China's East Sea. This segment is projected to command a market share of approximately 45% by 2033. Within Service Type, Drilling services are expected to maintain a leading position, representing around 35% of the market, due to ongoing exploration efforts and the need to replace declining reserves. However, Completion services are demonstrating a rapid growth trajectory, fueled by the demand for advanced wellbore construction and stimulation techniques, with an estimated market share increase of 5% over the forecast period.
- China: Its vast onshore and offshore exploration activities, coupled with significant government investment in energy security, make it a primary growth engine. China's market share in oilfield services is projected to reach 30% by 2033.
- India: Driven by the national oil companies like ONGC and Reliance Industries, India's oilfield services market is expanding, particularly in offshore exploration and production. India's share is estimated at 20% by 2033.
- Rest of Asia-Pacific: Countries like Indonesia, Malaysia, and Australia contribute significantly through their established offshore and onshore operations, accounting for the remaining 30% of the market. Indonesia’s focus on natural gas production, particularly LNG, drives demand for specialized services.
- Key Drivers: Favorable economic policies promoting domestic energy production, substantial infrastructure development for oil and gas extraction, and growing investments in advanced technologies are key factors underpinning the dominance of these regions and segments. The increasing complexity of reservoirs necessitates sophisticated drilling and completion solutions, thereby boosting the demand for specialized services.
Asia Pacific Oilfield Services Industry Product Landscape
The product landscape within the Asia Pacific oilfield services industry is characterized by continuous innovation in drilling technology, completion tools, and production enhancement solutions. Advanced drilling fluids engineered for extreme conditions and specialized completion strings designed for complex wellbore architectures are key offerings. Performance metrics focus on enhanced drilling rates, improved well integrity, and optimized hydrocarbon recovery. Unique selling propositions often lie in proprietary software for reservoir simulation, automated drilling systems, and eco-friendly chemical solutions that minimize environmental impact. Technological advancements are driving the development of smart well systems and digital monitoring tools that provide real-time data for optimized production and proactive maintenance, ensuring higher operational efficiency.
Key Drivers, Barriers & Challenges in Asia Pacific Oilfield Services Industry
Key Drivers:
- Rising Energy Demand: The burgeoning economies of Asia Pacific necessitate increased hydrocarbon production, directly fueling demand for oilfield services.
- Technological Advancements: Innovations in drilling, exploration, and production technologies are creating new market opportunities and driving efficiency.
- Government Initiatives: Supportive policies for domestic energy production and exploration encourage significant investment in the sector.
- Untapped Reserves: The presence of unexplored offshore and unconventional reserves presents substantial growth potential.
Barriers & Challenges:
- Supply Chain Volatility: Geopolitical instability and global economic fluctuations can disrupt the supply chain for critical equipment and materials, impacting project timelines and costs.
- Regulatory Hurdles: Diverse and often stringent environmental and safety regulations across different countries can create compliance challenges and increase operational expenses.
- Intense Competition: The market faces significant competitive pressures from both established global players and emerging local service providers, leading to price sensitivity.
- Skilled Workforce Shortage: A growing gap in skilled labor, particularly for specialized roles in advanced technologies, poses a significant challenge to operational scalability. The estimated impact of these challenges on project execution can lead to delays of up to 15-20% and cost overruns of 10-12%.
Emerging Opportunities in Asia Pacific Oilfield Services Industry
Emerging opportunities in the Asia Pacific oilfield services industry lie in the development and deployment of sustainable energy solutions, including carbon capture, utilization, and storage (CCUS) services integrated with oil and gas operations. The untapped potential of unconventional resources, such as shale gas in China and India, presents a significant avenue for growth, requiring specialized hydraulic fracturing and well completion technologies. Furthermore, the increasing demand for digital oilfield solutions, including AI-powered predictive analytics and IoT-enabled monitoring systems, offers substantial opportunities for technology providers and service companies. The growing focus on decommissioning aging offshore platforms also opens up a niche market for specialized services related to asset integrity management and environmentally responsible dismantling.
Growth Accelerators in the Asia Pacific Oilfield Services Industry Industry
Long-term growth in the Asia Pacific oilfield services industry is being significantly accelerated by pioneering technological breakthroughs, such as the application of robotics and automation in hazardous offshore environments and the advancement of subsea processing technologies. Strategic partnerships between national oil companies and international service providers are fostering knowledge transfer and enabling access to cutting-edge technologies. Market expansion strategies, including the penetration of underdeveloped regions and the diversification into related energy sectors like renewable energy infrastructure support, are further propelling sustained growth. The increasing adoption of integrated project delivery models, streamlining operations and reducing costs, acts as a crucial catalyst for market expansion and enhanced profitability.
Key Players Shaping the Asia Pacific Oilfield Services Industry Market
- Schlumberger Ltd
- Halliburton Co
- Baker Hughes Co
- Weatherford International PLC
- National Oilwell Varco Inc
- Superior Energy Services Inc
- Archer Limited
- Expro Group
- Petrofac Limited
Notable Milestones in Asia Pacific Oilfield Services Industry Sector
- November 2022: Velesto Energy, a Malaysian company, signed an integrated rig, drilling, and completion services (i-RDC) deal with Hess Corp. for USD 135 million, highlighting the trend towards integrated service contracts.
- October 2022: The Indian Institute of Technology Kharagpur signed an agreement with the Oil & Natural Gas Corporation (ONGC) Limited Institute of Drilling Technology (IDT) to undertake collaborative R&D projects related to drilling, drilling fluids, cementing fluids, and completion fluids, emphasizing innovation in upstream technologies.
In-Depth Asia Pacific Oilfield Services Industry Market Outlook
The future outlook for the Asia Pacific oilfield services industry is characterized by sustained growth driven by increasing energy security imperatives and a strategic shift towards more efficient and sustainable extraction methods. Growth accelerators include the widespread adoption of digital transformation initiatives, enhancing operational efficiency and reducing downtime. Strategic partnerships and collaborations will be crucial for accessing new markets and technologies, particularly in deepwater and unconventional resource development. Market expansion strategies will likely focus on emerging economies and the diversification of service offerings to include renewable energy integration and decommissioning services. The forecast indicates a robust market potential, with significant opportunities for companies that can leverage innovation, adapt to evolving regulatory landscapes, and deliver value-driven integrated solutions to meet the region's dynamic energy needs.
Asia Pacific Oilfield Services Industry Segmentation
-
1. Location of Deployment
- 1.1. Onshore
- 1.2. Offshore
-
2. Service Type
- 2.1. Drilling
- 2.2. Completion
- 2.3. Production
- 2.4. Other Service Types
-
3. Geography
- 3.1. India
- 3.2. China
- 3.3. Indonesia
- 3.4. Rest of Asia-Pacifc
Asia Pacific Oilfield Services Industry Segmentation By Geography
- 1. India
- 2. China
- 3. Indonesia
- 4. Rest of Asia Pacifc
Asia Pacific Oilfield Services Industry Regional Market Share
Geographic Coverage of Asia Pacific Oilfield Services Industry
Asia Pacific Oilfield Services Industry REPORT HIGHLIGHTS
| Aspects | Details |
|---|---|
| Study Period | 2020-2034 |
| Base Year | 2025 |
| Estimated Year | 2026 |
| Forecast Period | 2026-2034 |
| Historical Period | 2020-2025 |
| Growth Rate | CAGR of 2.9% from 2020-2034 |
| Segmentation |
|
Table of Contents
- 1. Introduction
- 1.1. Research Scope
- 1.2. Market Segmentation
- 1.3. Research Objective
- 1.4. Definitions and Assumptions
- 2. Executive Summary
- 2.1. Market Snapshot
- 3. Market Dynamics
- 3.1. Market Drivers
- 3.2. Market Restrains
- 3.3. Market Trends
- 3.4. Market Opportunities
- 4. Market Factor Analysis
- 4.1. Porters Five Forces
- 4.1.1. Bargaining Power of Suppliers
- 4.1.2. Bargaining Power of Buyers
- 4.1.3. Threat of New Entrants
- 4.1.4. Threat of Substitutes
- 4.1.5. Competitive Rivalry
- 4.2. PESTEL analysis
- 4.3. BCG Analysis
- 4.3.1. Stars (High Growth, High Market Share)
- 4.3.2. Cash Cows (Low Growth, High Market Share)
- 4.3.3. Question Mark (High Growth, Low Market Share)
- 4.3.4. Dogs (Low Growth, Low Market Share)
- 4.4. Ansoff Matrix Analysis
- 4.5. Supply Chain Analysis
- 4.6. Regulatory Landscape
- 4.7. Current Market Potential and Opportunity Assessment (TAM–SAM–SOM Framework)
- 4.8. VDR Analyst Note
- 4.1. Porters Five Forces
- 5. Market Analysis, Insights and Forecast 2021-2033
- 5.1. Market Analysis, Insights and Forecast - by Location of Deployment
- 5.1.1. Onshore
- 5.1.2. Offshore
- 5.2. Market Analysis, Insights and Forecast - by Service Type
- 5.2.1. Drilling
- 5.2.2. Completion
- 5.2.3. Production
- 5.2.4. Other Service Types
- 5.3. Market Analysis, Insights and Forecast - by Geography
- 5.3.1. India
- 5.3.2. China
- 5.3.3. Indonesia
- 5.3.4. Rest of Asia-Pacifc
- 5.4. Market Analysis, Insights and Forecast - by Region
- 5.4.1. India
- 5.4.2. China
- 5.4.3. Indonesia
- 5.4.4. Rest of Asia Pacifc
- 5.1. Market Analysis, Insights and Forecast - by Location of Deployment
- 6. Asia Pacific Oilfield Services Industry Analysis, Insights and Forecast, 2021-2033
- 6.1. Market Analysis, Insights and Forecast - by Location of Deployment
- 6.1.1. Onshore
- 6.1.2. Offshore
- 6.2. Market Analysis, Insights and Forecast - by Service Type
- 6.2.1. Drilling
- 6.2.2. Completion
- 6.2.3. Production
- 6.2.4. Other Service Types
- 6.3. Market Analysis, Insights and Forecast - by Geography
- 6.3.1. India
- 6.3.2. China
- 6.3.3. Indonesia
- 6.3.4. Rest of Asia-Pacifc
- 6.1. Market Analysis, Insights and Forecast - by Location of Deployment
- 7. India Asia Pacific Oilfield Services Industry Analysis, Insights and Forecast, 2021-2033
- 7.1. Market Analysis, Insights and Forecast - by Location of Deployment
- 7.1.1. Onshore
- 7.1.2. Offshore
- 7.2. Market Analysis, Insights and Forecast - by Service Type
- 7.2.1. Drilling
- 7.2.2. Completion
- 7.2.3. Production
- 7.2.4. Other Service Types
- 7.3. Market Analysis, Insights and Forecast - by Geography
- 7.3.1. India
- 7.3.2. China
- 7.3.3. Indonesia
- 7.3.4. Rest of Asia-Pacifc
- 7.1. Market Analysis, Insights and Forecast - by Location of Deployment
- 8. China Asia Pacific Oilfield Services Industry Analysis, Insights and Forecast, 2021-2033
- 8.1. Market Analysis, Insights and Forecast - by Location of Deployment
- 8.1.1. Onshore
- 8.1.2. Offshore
- 8.2. Market Analysis, Insights and Forecast - by Service Type
- 8.2.1. Drilling
- 8.2.2. Completion
- 8.2.3. Production
- 8.2.4. Other Service Types
- 8.3. Market Analysis, Insights and Forecast - by Geography
- 8.3.1. India
- 8.3.2. China
- 8.3.3. Indonesia
- 8.3.4. Rest of Asia-Pacifc
- 8.1. Market Analysis, Insights and Forecast - by Location of Deployment
- 9. Indonesia Asia Pacific Oilfield Services Industry Analysis, Insights and Forecast, 2021-2033
- 9.1. Market Analysis, Insights and Forecast - by Location of Deployment
- 9.1.1. Onshore
- 9.1.2. Offshore
- 9.2. Market Analysis, Insights and Forecast - by Service Type
- 9.2.1. Drilling
- 9.2.2. Completion
- 9.2.3. Production
- 9.2.4. Other Service Types
- 9.3. Market Analysis, Insights and Forecast - by Geography
- 9.3.1. India
- 9.3.2. China
- 9.3.3. Indonesia
- 9.3.4. Rest of Asia-Pacifc
- 9.1. Market Analysis, Insights and Forecast - by Location of Deployment
- 10. Rest of Asia Pacifc Asia Pacific Oilfield Services Industry Analysis, Insights and Forecast, 2021-2033
- 10.1. Market Analysis, Insights and Forecast - by Location of Deployment
- 10.1.1. Onshore
- 10.1.2. Offshore
- 10.2. Market Analysis, Insights and Forecast - by Service Type
- 10.2.1. Drilling
- 10.2.2. Completion
- 10.2.3. Production
- 10.2.4. Other Service Types
- 10.3. Market Analysis, Insights and Forecast - by Geography
- 10.3.1. India
- 10.3.2. China
- 10.3.3. Indonesia
- 10.3.4. Rest of Asia-Pacifc
- 10.1. Market Analysis, Insights and Forecast - by Location of Deployment
- 11. Competitive Analysis
- 11.1. Company Profiles
- 11.1.1 Superior Energy Services Inc
- 11.1.1.1. Company Overview
- 11.1.1.2. Products
- 11.1.1.3. Company Financials
- 11.1.1.4. SWOT Analysis
- 11.1.2 Archer Limited
- 11.1.2.1. Company Overview
- 11.1.2.2. Products
- 11.1.2.3. Company Financials
- 11.1.2.4. SWOT Analysis
- 11.1.3 National Oilwell Varco Inc
- 11.1.3.1. Company Overview
- 11.1.3.2. Products
- 11.1.3.3. Company Financials
- 11.1.3.4. SWOT Analysis
- 11.1.4 Baker Hughes Co
- 11.1.4.1. Company Overview
- 11.1.4.2. Products
- 11.1.4.3. Company Financials
- 11.1.4.4. SWOT Analysis
- 11.1.5 Schlumberger Ltd
- 11.1.5.1. Company Overview
- 11.1.5.2. Products
- 11.1.5.3. Company Financials
- 11.1.5.4. SWOT Analysis
- 11.1.6 Petrofac Limited
- 11.1.6.1. Company Overview
- 11.1.6.2. Products
- 11.1.6.3. Company Financials
- 11.1.6.4. SWOT Analysis
- 11.1.7 Expro Group
- 11.1.7.1. Company Overview
- 11.1.7.2. Products
- 11.1.7.3. Company Financials
- 11.1.7.4. SWOT Analysis
- 11.1.8 Weatherford International PLC
- 11.1.8.1. Company Overview
- 11.1.8.2. Products
- 11.1.8.3. Company Financials
- 11.1.8.4. SWOT Analysis
- 11.1.9 Halliburton Co
- 11.1.9.1. Company Overview
- 11.1.9.2. Products
- 11.1.9.3. Company Financials
- 11.1.9.4. SWOT Analysis
- 11.1.1 Superior Energy Services Inc
- 11.2. Market Entropy
- 11.2.1 Company's Key Areas Served
- 11.2.2 Recent Developments
- 11.3. Company Market Share Analysis 2025
- 11.3.1 Top 5 Companies Market Share Analysis
- 11.3.2 Top 3 Companies Market Share Analysis
- 11.4. List of Potential Customers
- 12. Research Methodology
List of Figures
- Figure 1: Asia Pacific Oilfield Services Industry Revenue Breakdown (million, %) by Product 2025 & 2033
- Figure 2: Asia Pacific Oilfield Services Industry Share (%) by Company 2025
List of Tables
- Table 1: Asia Pacific Oilfield Services Industry Revenue million Forecast, by Location of Deployment 2020 & 2033
- Table 2: Asia Pacific Oilfield Services Industry Revenue million Forecast, by Service Type 2020 & 2033
- Table 3: Asia Pacific Oilfield Services Industry Revenue million Forecast, by Geography 2020 & 2033
- Table 4: Asia Pacific Oilfield Services Industry Revenue million Forecast, by Region 2020 & 2033
- Table 5: Asia Pacific Oilfield Services Industry Revenue million Forecast, by Location of Deployment 2020 & 2033
- Table 6: Asia Pacific Oilfield Services Industry Revenue million Forecast, by Service Type 2020 & 2033
- Table 7: Asia Pacific Oilfield Services Industry Revenue million Forecast, by Geography 2020 & 2033
- Table 8: Asia Pacific Oilfield Services Industry Revenue million Forecast, by Country 2020 & 2033
- Table 9: Asia Pacific Oilfield Services Industry Revenue million Forecast, by Location of Deployment 2020 & 2033
- Table 10: Asia Pacific Oilfield Services Industry Revenue million Forecast, by Service Type 2020 & 2033
- Table 11: Asia Pacific Oilfield Services Industry Revenue million Forecast, by Geography 2020 & 2033
- Table 12: Asia Pacific Oilfield Services Industry Revenue million Forecast, by Country 2020 & 2033
- Table 13: Asia Pacific Oilfield Services Industry Revenue million Forecast, by Location of Deployment 2020 & 2033
- Table 14: Asia Pacific Oilfield Services Industry Revenue million Forecast, by Service Type 2020 & 2033
- Table 15: Asia Pacific Oilfield Services Industry Revenue million Forecast, by Geography 2020 & 2033
- Table 16: Asia Pacific Oilfield Services Industry Revenue million Forecast, by Country 2020 & 2033
- Table 17: Asia Pacific Oilfield Services Industry Revenue million Forecast, by Location of Deployment 2020 & 2033
- Table 18: Asia Pacific Oilfield Services Industry Revenue million Forecast, by Service Type 2020 & 2033
- Table 19: Asia Pacific Oilfield Services Industry Revenue million Forecast, by Geography 2020 & 2033
- Table 20: Asia Pacific Oilfield Services Industry Revenue million Forecast, by Country 2020 & 2033
Frequently Asked Questions
1. What is the projected Compound Annual Growth Rate (CAGR) of the Asia Pacific Oilfield Services Industry?
The projected CAGR is approximately 2.9%.
2. Which companies are prominent players in the Asia Pacific Oilfield Services Industry?
Key companies in the market include Superior Energy Services Inc, Archer Limited, National Oilwell Varco Inc, Baker Hughes Co, Schlumberger Ltd, Petrofac Limited, Expro Group, Weatherford International PLC, Halliburton Co.
3. What are the main segments of the Asia Pacific Oilfield Services Industry?
The market segments include Location of Deployment, Service Type, Geography.
4. Can you provide details about the market size?
The market size is estimated to be USD 396.2 million as of 2022.
5. What are some drivers contributing to market growth?
4.; Increasing Development of Gas Reserves and Advanced Technology. Tools. and Equipment4.; Increasing Investment in the Oilfield Services across World.
6. What are the notable trends driving market growth?
Drilling Services to Dominate the Market.
7. Are there any restraints impacting market growth?
4.; The Volatile Oil Prices Over the Recent Period. Owing to the Supply-Demand Gap.
8. Can you provide examples of recent developments in the market?
November 2022: Velesto Energy, a Malaysian company, signed an integrated rig, drilling, and completion services deal with Hess Corp. for USD 135 million. The i-RDC is a concept in which integration of drilling rig services, equipment, and in some cases, procurement of materials for drilling and completion services is covered under a single contract between the operator or oil company, as the owner of the project, and a service company, which serves as the i-RDC contractor.
9. What pricing options are available for accessing the report?
Pricing options include single-user, multi-user, and enterprise licenses priced at USD 4750, USD 5250, and USD 8750 respectively.
10. Is the market size provided in terms of value or volume?
The market size is provided in terms of value, measured in million.
11. Are there any specific market keywords associated with the report?
Yes, the market keyword associated with the report is "Asia Pacific Oilfield Services Industry," which aids in identifying and referencing the specific market segment covered.
12. How do I determine which pricing option suits my needs best?
The pricing options vary based on user requirements and access needs. Individual users may opt for single-user licenses, while businesses requiring broader access may choose multi-user or enterprise licenses for cost-effective access to the report.
13. Are there any additional resources or data provided in the Asia Pacific Oilfield Services Industry report?
While the report offers comprehensive insights, it's advisable to review the specific contents or supplementary materials provided to ascertain if additional resources or data are available.
14. How can I stay updated on further developments or reports in the Asia Pacific Oilfield Services Industry?
To stay informed about further developments, trends, and reports in the Asia Pacific Oilfield Services Industry, consider subscribing to industry newsletters, following relevant companies and organizations, or regularly checking reputable industry news sources and publications.
Methodology
Step 1 - Identification of Relevant Samples Size from Population Database


Step 2 - Approaches for Defining Global Market Size (Value, Volume* & Price*)

Note*: In applicable scenarios
Step 3 - Data Sources
Primary Research
- Web Analytics
- Survey Reports
- Research Institute
- Latest Research Reports
- Opinion Leaders
Secondary Research
- Annual Reports
- White Paper
- Latest Press Release
- Industry Association
- Paid Database
- Investor Presentations

Step 4 - Data Triangulation
Involves using different sources of information in order to increase the validity of a study
These sources are likely to be stakeholders in a program - participants, other researchers, program staff, other community members, and so on.
Then we put all data in single framework & apply various statistical tools to find out the dynamic on the market.
During the analysis stage, feedback from the stakeholder groups would be compared to determine areas of agreement as well as areas of divergence