

Key Insights
The Asia Pacific Gas Insulated Switchgear (GIS) market is experiencing robust growth, driven by the region's expanding power infrastructure and increasing demand for reliable electricity transmission and distribution. A compound annual growth rate (CAGR) exceeding 6% from 2019 to 2024 suggests a significant market expansion. This growth is fueled by several key factors. Firstly, rapid urbanization and industrialization across countries like China, India, and Japan are boosting electricity consumption, necessitating upgrades to existing power grids and the installation of new GIS systems. Secondly, the focus on improving grid reliability and reducing power outages is driving the adoption of GIS, known for its superior performance and safety compared to air-insulated switchgear. Thirdly, government initiatives promoting renewable energy integration are also contributing to market growth, as GIS is well-suited for integrating renewable energy sources into the grid. The market is segmented by voltage level (low, medium, high) and end-user (power utilities, industrial, commercial & residential), with power utilities representing the largest segment. Key players like Toshiba, Hitachi, and Siemens are actively investing in research and development to enhance GIS technology, further fueling market expansion.
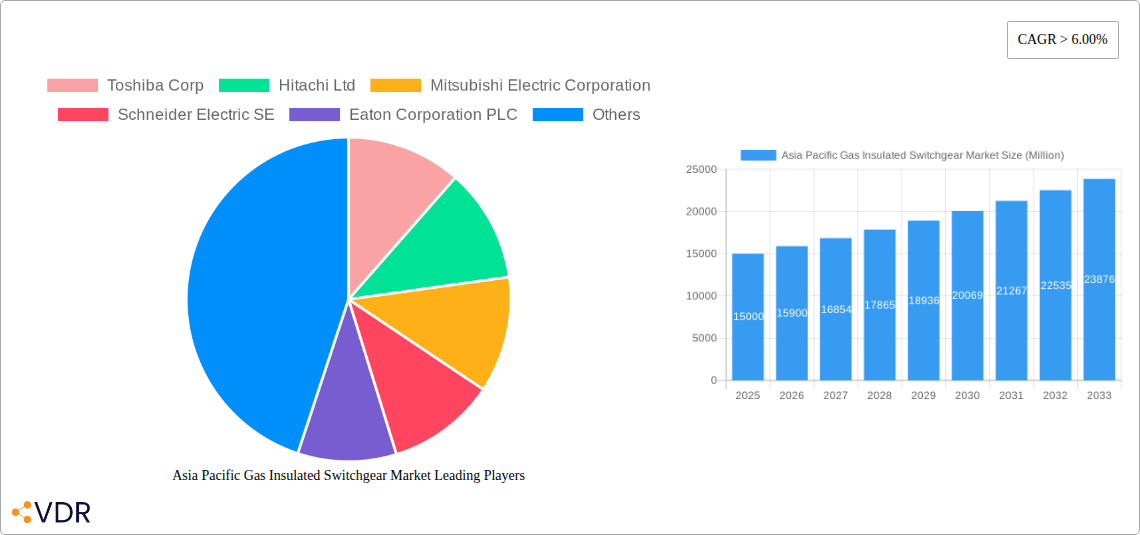
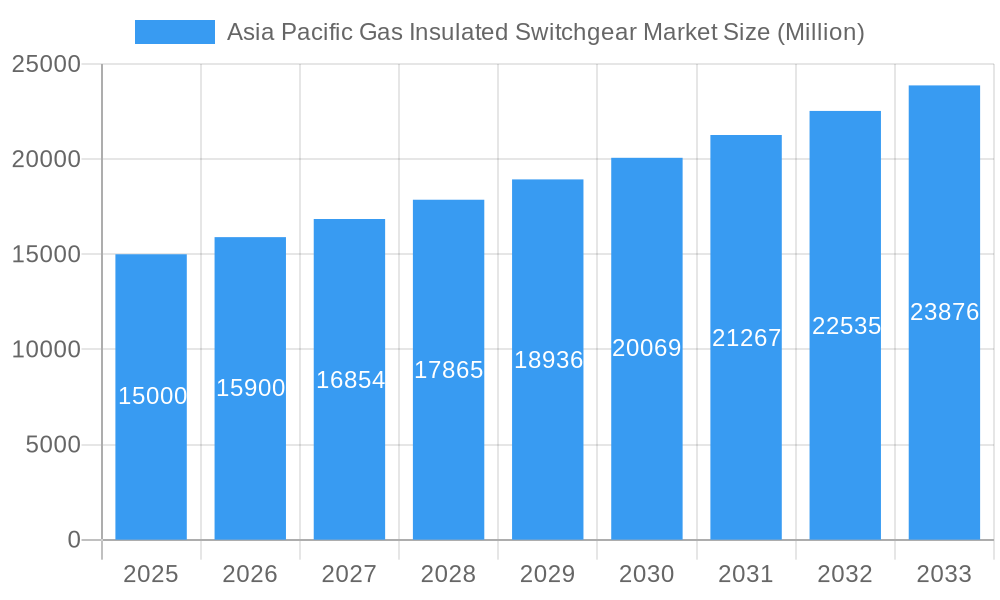
Asia Pacific Gas Insulated Switchgear Market Market Size (In Billion)
The Asia Pacific GIS market presents lucrative opportunities for existing and new market entrants. While the high initial investment cost of GIS can act as a restraint for some smaller players, the long-term benefits in terms of operational efficiency, reliability, and safety make it a compelling investment for large power utilities and industrial sectors. The future of the market hinges on technological advancements like the development of compact and eco-friendly GIS solutions. Furthermore, the increasing adoption of smart grid technologies and digitalization in the power sector will play a crucial role in shaping market trends. Competitive pressures among manufacturers are driving innovation and price optimization, further enhancing market attractiveness. Future growth will likely be influenced by government regulations, infrastructure development plans, and economic growth across the various nations in the Asia-Pacific region. Focusing on providing customized solutions to specific end-user needs will be crucial for market success.
Asia Pacific Gas Insulated Switchgear Market Company Market Share
Asia Pacific Gas Insulated Switchgear Market: A Comprehensive Report (2019-2033)
This in-depth report provides a comprehensive analysis of the Asia Pacific Gas Insulated Switchgear (GIS) market, encompassing market dynamics, growth trends, regional performance, product landscape, and key players. The study period covers 2019-2033, with 2025 as the base and estimated year, and a forecast period of 2025-2033. The historical period analyzed is 2019-2024. This report is crucial for industry professionals, investors, and strategic decision-makers seeking to understand and capitalize on opportunities within this rapidly evolving market. The market value is projected to reach xx Million units by 2033.
Asia Pacific Gas Insulated Switchgear Market Dynamics & Structure
This section delves into the intricate structure of the Asia Pacific GIS market, examining market concentration, technological advancements, regulatory landscapes, competitive dynamics, and end-user trends. The analysis incorporates quantitative data (market share, M&A activity) and qualitative factors (innovation barriers) to provide a holistic view.
- Market Concentration: The Asia Pacific GIS market exhibits a moderately concentrated landscape, with leading players holding xx% market share in 2024. Smaller, regional players account for the remaining xx%.
- Technological Innovation: The market is driven by the continuous development of eco-friendly SF6 alternatives and advancements in GIS technology for enhanced efficiency, reliability, and safety.
- Regulatory Frameworks: Stringent environmental regulations regarding SF6 emissions are significantly impacting market dynamics, fostering innovation in gas alternatives.
- Competitive Landscape: Intense competition among established players and emerging companies is driving price reductions and technological improvements.
- End-User Demographics: The power utilities sector dominates the market, followed by the industrial sector. The commercial and residential sector is experiencing slow but steady growth.
- M&A Trends: The number of M&A deals in the Asia Pacific GIS market witnessed a xx% increase from 2020 to 2024, primarily driven by consolidation efforts and expansion strategies.
Asia Pacific Gas Insulated Switchgear Market Growth Trends & Insights
This section analyzes the historical and projected growth trajectory of the Asia Pacific GIS market. It explores factors influencing market size evolution, adoption rates, technological disruptions, and changing consumer behaviors. The analysis incorporates key metrics like compound annual growth rate (CAGR) and market penetration.
[Insert 600-word analysis here, incorporating data on CAGR, market penetration, and other relevant metrics.]
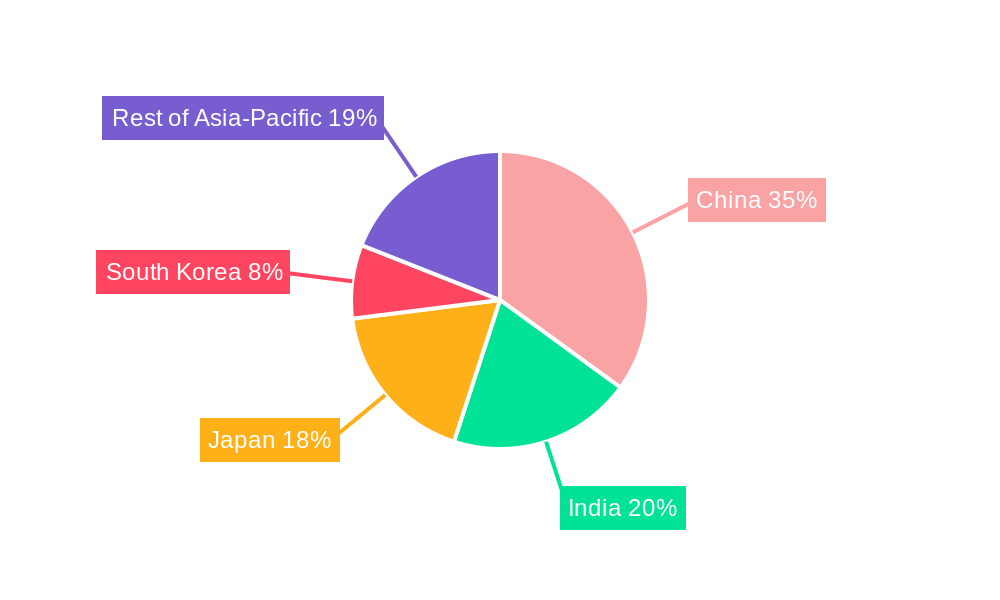
Dominant Regions, Countries, or Segments in Asia Pacific Gas Insulated Switchgear Market
This section identifies the leading regions, countries, and segments (voltage level: low, medium, high; end-user: power utilities, industrial, commercial & residential) within the Asia Pacific GIS market. It analyzes dominance factors such as market share, growth potential, and influencing economic and infrastructural drivers.
- Leading Region/Country: [Insert leading region/country] is the dominant market, driven by [reasons].
- High Voltage Segment Dominance: The high-voltage segment holds the largest market share (xx%), fueled by large-scale power projects.
- Power Utilities Sector: The power utilities sector remains the primary end-user, accounting for xx% of total market demand.
- Key Drivers: Investment in renewable energy infrastructure, grid modernization initiatives, and increasing electricity demand are key growth drivers.
[Insert 600-word analysis supporting the above bullet points, including market share data and growth potential projections.]
Asia Pacific Gas Insulated Switchgear Market Product Landscape
The Asia Pacific GIS market features a diverse range of products with varying voltage levels, functionalities, and performance capabilities. Technological advancements focus on enhanced reliability, compact design, and reduced environmental impact, particularly through the development of SF6 alternatives. Unique selling propositions often center around operational efficiency, safety features, and eco-friendliness.
Key Drivers, Barriers & Challenges in Asia Pacific Gas Insulated Switchgear Market
Key Drivers: Increasing demand for reliable and efficient power transmission and distribution systems, coupled with government initiatives promoting grid modernization, are key drivers. Furthermore, stringent environmental regulations are accelerating the adoption of eco-friendly SF6 alternatives.
Key Challenges: High initial investment costs, complex installation processes, and the need for specialized expertise can hinder market growth. Supply chain disruptions and intense competition also pose significant challenges. The market also faces regulatory hurdles and potential impacts from fluctuating raw material prices.
Emerging Opportunities in Asia Pacific Gas Insulated Switchgear Market
Emerging opportunities exist in untapped markets across the region, particularly in developing economies with expanding power grids. The increasing adoption of renewable energy sources and smart grid technologies presents significant growth prospects. Furthermore, the development of innovative GIS applications in various industries is opening up new avenues.
Growth Accelerators in the Asia Pacific Gas Insulated Switchgear Market Industry
Technological advancements in GIS technology, including the development of compact designs and improved gas insulation, are key growth accelerators. Strategic partnerships and collaborations among manufacturers, utilities, and research institutions are also driving innovation and market expansion. Government incentives promoting grid modernization and investment in renewable energy further support market growth.
Key Players Shaping the Asia Pacific Gas Insulated Switchgear Market Market
- Toshiba Corp
- Hitachi Ltd
- Mitsubishi Electric Corporation
- Schneider Electric SE
- Eaton Corporation PLC
- Powell Industries Inc
- Siemens Energy AG
- General Electric Company
- Hyosung Heavy Industries Corp
- Bharat Heavy Electricals Limited
Notable Milestones in Asia Pacific Gas Insulated Switchgear Market Sector
- May 2022: German start-up Nuventura seeks Chinese partners to commercialize SF6 alternatives for medium-voltage GIS.
- February 2022: Bharat Heavy Electricals LTD (BHEL) develops a 33 kV Bus Potential Transformer Module for GIS, eliminating the need for a separate PT panel.
In-Depth Asia Pacific Gas Insulated Switchgear Market Market Outlook
The Asia Pacific GIS market is poised for significant growth driven by continued investments in power grid infrastructure, the adoption of sustainable technologies, and increasing demand for reliable power supply. Strategic partnerships, technological advancements, and favorable government policies will further accelerate market expansion in the coming years, creating lucrative opportunities for industry players.
Asia Pacific Gas Insulated Switchgear Market Segmentation
-
1. Voltage Level
- 1.1. Low Voltage
- 1.2. Medium Voltage
- 1.3. High Voltage
-
2. End User
- 2.1. Power Utilities
- 2.2. Industrial Sector
- 2.3. Commercial and Residential
-
3. Geography
- 3.1. China
- 3.2. India
- 3.3. Japan
- 3.4. South Korea
- 3.5. Rest of Asia-Pacific
Asia Pacific Gas Insulated Switchgear Market Segmentation By Geography
- 1. China
- 2. India
- 3. Japan
- 4. South Korea
- 5. Rest of Asia Pacific
Asia Pacific Gas Insulated Switchgear Market Regional Market Share
Geographic Coverage of Asia Pacific Gas Insulated Switchgear Market
Asia Pacific Gas Insulated Switchgear Market REPORT HIGHLIGHTS
| Aspects | Details |
|---|---|
| Study Period | 2020-2034 |
| Base Year | 2025 |
| Estimated Year | 2026 |
| Forecast Period | 2026-2034 |
| Historical Period | 2020-2025 |
| Growth Rate | CAGR of 7.1% from 2020-2034 |
| Segmentation |
|
Table of Contents
- 1. Introduction
- 1.1. Research Scope
- 1.2. Market Segmentation
- 1.3. Research Objective
- 1.4. Definitions and Assumptions
- 2. Executive Summary
- 2.1. Market Snapshot
- 3. Market Dynamics
- 3.1. Market Drivers
- 3.2. Market Restrains
- 3.3. Market Trends
- 3.4. Market Opportunities
- 4. Market Factor Analysis
- 4.1. Porters Five Forces
- 4.1.1. Bargaining Power of Suppliers
- 4.1.2. Bargaining Power of Buyers
- 4.1.3. Threat of New Entrants
- 4.1.4. Threat of Substitutes
- 4.1.5. Competitive Rivalry
- 4.2. PESTEL analysis
- 4.3. BCG Analysis
- 4.3.1. Stars (High Growth, High Market Share)
- 4.3.2. Cash Cows (Low Growth, High Market Share)
- 4.3.3. Question Mark (High Growth, Low Market Share)
- 4.3.4. Dogs (Low Growth, Low Market Share)
- 4.4. Ansoff Matrix Analysis
- 4.5. Supply Chain Analysis
- 4.6. Regulatory Landscape
- 4.7. Current Market Potential and Opportunity Assessment (TAM–SAM–SOM Framework)
- 4.8. VDR Analyst Note
- 4.1. Porters Five Forces
- 5. Market Analysis, Insights and Forecast 2021-2033
- 5.1. Market Analysis, Insights and Forecast - by Voltage Level
- 5.1.1. Low Voltage
- 5.1.2. Medium Voltage
- 5.1.3. High Voltage
- 5.2. Market Analysis, Insights and Forecast - by End User
- 5.2.1. Power Utilities
- 5.2.2. Industrial Sector
- 5.2.3. Commercial and Residential
- 5.3. Market Analysis, Insights and Forecast - by Geography
- 5.3.1. China
- 5.3.2. India
- 5.3.3. Japan
- 5.3.4. South Korea
- 5.3.5. Rest of Asia-Pacific
- 5.4. Market Analysis, Insights and Forecast - by Region
- 5.4.1. China
- 5.4.2. India
- 5.4.3. Japan
- 5.4.4. South Korea
- 5.4.5. Rest of Asia Pacific
- 5.1. Market Analysis, Insights and Forecast - by Voltage Level
- 6. Asia Pacific Gas Insulated Switchgear Market Analysis, Insights and Forecast, 2021-2033
- 6.1. Market Analysis, Insights and Forecast - by Voltage Level
- 6.1.1. Low Voltage
- 6.1.2. Medium Voltage
- 6.1.3. High Voltage
- 6.2. Market Analysis, Insights and Forecast - by End User
- 6.2.1. Power Utilities
- 6.2.2. Industrial Sector
- 6.2.3. Commercial and Residential
- 6.3. Market Analysis, Insights and Forecast - by Geography
- 6.3.1. China
- 6.3.2. India
- 6.3.3. Japan
- 6.3.4. South Korea
- 6.3.5. Rest of Asia-Pacific
- 6.1. Market Analysis, Insights and Forecast - by Voltage Level
- 7. China Asia Pacific Gas Insulated Switchgear Market Analysis, Insights and Forecast, 2021-2033
- 7.1. Market Analysis, Insights and Forecast - by Voltage Level
- 7.1.1. Low Voltage
- 7.1.2. Medium Voltage
- 7.1.3. High Voltage
- 7.2. Market Analysis, Insights and Forecast - by End User
- 7.2.1. Power Utilities
- 7.2.2. Industrial Sector
- 7.2.3. Commercial and Residential
- 7.3. Market Analysis, Insights and Forecast - by Geography
- 7.3.1. China
- 7.3.2. India
- 7.3.3. Japan
- 7.3.4. South Korea
- 7.3.5. Rest of Asia-Pacific
- 7.1. Market Analysis, Insights and Forecast - by Voltage Level
- 8. India Asia Pacific Gas Insulated Switchgear Market Analysis, Insights and Forecast, 2021-2033
- 8.1. Market Analysis, Insights and Forecast - by Voltage Level
- 8.1.1. Low Voltage
- 8.1.2. Medium Voltage
- 8.1.3. High Voltage
- 8.2. Market Analysis, Insights and Forecast - by End User
- 8.2.1. Power Utilities
- 8.2.2. Industrial Sector
- 8.2.3. Commercial and Residential
- 8.3. Market Analysis, Insights and Forecast - by Geography
- 8.3.1. China
- 8.3.2. India
- 8.3.3. Japan
- 8.3.4. South Korea
- 8.3.5. Rest of Asia-Pacific
- 8.1. Market Analysis, Insights and Forecast - by Voltage Level
- 9. Japan Asia Pacific Gas Insulated Switchgear Market Analysis, Insights and Forecast, 2021-2033
- 9.1. Market Analysis, Insights and Forecast - by Voltage Level
- 9.1.1. Low Voltage
- 9.1.2. Medium Voltage
- 9.1.3. High Voltage
- 9.2. Market Analysis, Insights and Forecast - by End User
- 9.2.1. Power Utilities
- 9.2.2. Industrial Sector
- 9.2.3. Commercial and Residential
- 9.3. Market Analysis, Insights and Forecast - by Geography
- 9.3.1. China
- 9.3.2. India
- 9.3.3. Japan
- 9.3.4. South Korea
- 9.3.5. Rest of Asia-Pacific
- 9.1. Market Analysis, Insights and Forecast - by Voltage Level
- 10. South Korea Asia Pacific Gas Insulated Switchgear Market Analysis, Insights and Forecast, 2021-2033
- 10.1. Market Analysis, Insights and Forecast - by Voltage Level
- 10.1.1. Low Voltage
- 10.1.2. Medium Voltage
- 10.1.3. High Voltage
- 10.2. Market Analysis, Insights and Forecast - by End User
- 10.2.1. Power Utilities
- 10.2.2. Industrial Sector
- 10.2.3. Commercial and Residential
- 10.3. Market Analysis, Insights and Forecast - by Geography
- 10.3.1. China
- 10.3.2. India
- 10.3.3. Japan
- 10.3.4. South Korea
- 10.3.5. Rest of Asia-Pacific
- 10.1. Market Analysis, Insights and Forecast - by Voltage Level
- 11. Rest of Asia Pacific Asia Pacific Gas Insulated Switchgear Market Analysis, Insights and Forecast, 2021-2033
- 11.1. Market Analysis, Insights and Forecast - by Voltage Level
- 11.1.1. Low Voltage
- 11.1.2. Medium Voltage
- 11.1.3. High Voltage
- 11.2. Market Analysis, Insights and Forecast - by End User
- 11.2.1. Power Utilities
- 11.2.2. Industrial Sector
- 11.2.3. Commercial and Residential
- 11.3. Market Analysis, Insights and Forecast - by Geography
- 11.3.1. China
- 11.3.2. India
- 11.3.3. Japan
- 11.3.4. South Korea
- 11.3.5. Rest of Asia-Pacific
- 11.1. Market Analysis, Insights and Forecast - by Voltage Level
- 12. Competitive Analysis
- 12.1. Company Profiles
- 12.1.1 Toshiba Corp
- 12.1.1.1. Company Overview
- 12.1.1.2. Products
- 12.1.1.3. Company Financials
- 12.1.1.4. SWOT Analysis
- 12.1.2 Hitachi Ltd
- 12.1.2.1. Company Overview
- 12.1.2.2. Products
- 12.1.2.3. Company Financials
- 12.1.2.4. SWOT Analysis
- 12.1.3 Mitsubishi Electric Corporation
- 12.1.3.1. Company Overview
- 12.1.3.2. Products
- 12.1.3.3. Company Financials
- 12.1.3.4. SWOT Analysis
- 12.1.4 Schneider Electric SE
- 12.1.4.1. Company Overview
- 12.1.4.2. Products
- 12.1.4.3. Company Financials
- 12.1.4.4. SWOT Analysis
- 12.1.5 Eaton Corporation PLC
- 12.1.5.1. Company Overview
- 12.1.5.2. Products
- 12.1.5.3. Company Financials
- 12.1.5.4. SWOT Analysis
- 12.1.6 Powell Industries Inc
- 12.1.6.1. Company Overview
- 12.1.6.2. Products
- 12.1.6.3. Company Financials
- 12.1.6.4. SWOT Analysis
- 12.1.7 Siemens Energy AG
- 12.1.7.1. Company Overview
- 12.1.7.2. Products
- 12.1.7.3. Company Financials
- 12.1.7.4. SWOT Analysis
- 12.1.8 General Electric Company
- 12.1.8.1. Company Overview
- 12.1.8.2. Products
- 12.1.8.3. Company Financials
- 12.1.8.4. SWOT Analysis
- 12.1.9 Hyosung Heavy Industries Corp
- 12.1.9.1. Company Overview
- 12.1.9.2. Products
- 12.1.9.3. Company Financials
- 12.1.9.4. SWOT Analysis
- 12.1.10 Bharat Heavy Electricals Limited
- 12.1.10.1. Company Overview
- 12.1.10.2. Products
- 12.1.10.3. Company Financials
- 12.1.10.4. SWOT Analysis
- 12.1.1 Toshiba Corp
- 12.2. Market Entropy
- 12.2.1 Company's Key Areas Served
- 12.2.2 Recent Developments
- 12.3. Company Market Share Analysis 2025
- 12.3.1 Top 5 Companies Market Share Analysis
- 12.3.2 Top 3 Companies Market Share Analysis
- 12.4. List of Potential Customers
- 13. Research Methodology
List of Figures
- Figure 1: Asia Pacific Gas Insulated Switchgear Market Revenue Breakdown (undefined, %) by Product 2025 & 2033
- Figure 2: Asia Pacific Gas Insulated Switchgear Market Share (%) by Company 2025
List of Tables
- Table 1: Asia Pacific Gas Insulated Switchgear Market Revenue undefined Forecast, by Voltage Level 2020 & 2033
- Table 2: Asia Pacific Gas Insulated Switchgear Market Volume Gigawatt Forecast, by Voltage Level 2020 & 2033
- Table 3: Asia Pacific Gas Insulated Switchgear Market Revenue undefined Forecast, by End User 2020 & 2033
- Table 4: Asia Pacific Gas Insulated Switchgear Market Volume Gigawatt Forecast, by End User 2020 & 2033
- Table 5: Asia Pacific Gas Insulated Switchgear Market Revenue undefined Forecast, by Geography 2020 & 2033
- Table 6: Asia Pacific Gas Insulated Switchgear Market Volume Gigawatt Forecast, by Geography 2020 & 2033
- Table 7: Asia Pacific Gas Insulated Switchgear Market Revenue undefined Forecast, by Region 2020 & 2033
- Table 8: Asia Pacific Gas Insulated Switchgear Market Volume Gigawatt Forecast, by Region 2020 & 2033
- Table 9: Asia Pacific Gas Insulated Switchgear Market Revenue undefined Forecast, by Voltage Level 2020 & 2033
- Table 10: Asia Pacific Gas Insulated Switchgear Market Volume Gigawatt Forecast, by Voltage Level 2020 & 2033
- Table 11: Asia Pacific Gas Insulated Switchgear Market Revenue undefined Forecast, by End User 2020 & 2033
- Table 12: Asia Pacific Gas Insulated Switchgear Market Volume Gigawatt Forecast, by End User 2020 & 2033
- Table 13: Asia Pacific Gas Insulated Switchgear Market Revenue undefined Forecast, by Geography 2020 & 2033
- Table 14: Asia Pacific Gas Insulated Switchgear Market Volume Gigawatt Forecast, by Geography 2020 & 2033
- Table 15: Asia Pacific Gas Insulated Switchgear Market Revenue undefined Forecast, by Country 2020 & 2033
- Table 16: Asia Pacific Gas Insulated Switchgear Market Volume Gigawatt Forecast, by Country 2020 & 2033
- Table 17: Asia Pacific Gas Insulated Switchgear Market Revenue undefined Forecast, by Voltage Level 2020 & 2033
- Table 18: Asia Pacific Gas Insulated Switchgear Market Volume Gigawatt Forecast, by Voltage Level 2020 & 2033
- Table 19: Asia Pacific Gas Insulated Switchgear Market Revenue undefined Forecast, by End User 2020 & 2033
- Table 20: Asia Pacific Gas Insulated Switchgear Market Volume Gigawatt Forecast, by End User 2020 & 2033
- Table 21: Asia Pacific Gas Insulated Switchgear Market Revenue undefined Forecast, by Geography 2020 & 2033
- Table 22: Asia Pacific Gas Insulated Switchgear Market Volume Gigawatt Forecast, by Geography 2020 & 2033
- Table 23: Asia Pacific Gas Insulated Switchgear Market Revenue undefined Forecast, by Country 2020 & 2033
- Table 24: Asia Pacific Gas Insulated Switchgear Market Volume Gigawatt Forecast, by Country 2020 & 2033
- Table 25: Asia Pacific Gas Insulated Switchgear Market Revenue undefined Forecast, by Voltage Level 2020 & 2033
- Table 26: Asia Pacific Gas Insulated Switchgear Market Volume Gigawatt Forecast, by Voltage Level 2020 & 2033
- Table 27: Asia Pacific Gas Insulated Switchgear Market Revenue undefined Forecast, by End User 2020 & 2033
- Table 28: Asia Pacific Gas Insulated Switchgear Market Volume Gigawatt Forecast, by End User 2020 & 2033
- Table 29: Asia Pacific Gas Insulated Switchgear Market Revenue undefined Forecast, by Geography 2020 & 2033
- Table 30: Asia Pacific Gas Insulated Switchgear Market Volume Gigawatt Forecast, by Geography 2020 & 2033
- Table 31: Asia Pacific Gas Insulated Switchgear Market Revenue undefined Forecast, by Country 2020 & 2033
- Table 32: Asia Pacific Gas Insulated Switchgear Market Volume Gigawatt Forecast, by Country 2020 & 2033
- Table 33: Asia Pacific Gas Insulated Switchgear Market Revenue undefined Forecast, by Voltage Level 2020 & 2033
- Table 34: Asia Pacific Gas Insulated Switchgear Market Volume Gigawatt Forecast, by Voltage Level 2020 & 2033
- Table 35: Asia Pacific Gas Insulated Switchgear Market Revenue undefined Forecast, by End User 2020 & 2033
- Table 36: Asia Pacific Gas Insulated Switchgear Market Volume Gigawatt Forecast, by End User 2020 & 2033
- Table 37: Asia Pacific Gas Insulated Switchgear Market Revenue undefined Forecast, by Geography 2020 & 2033
- Table 38: Asia Pacific Gas Insulated Switchgear Market Volume Gigawatt Forecast, by Geography 2020 & 2033
- Table 39: Asia Pacific Gas Insulated Switchgear Market Revenue undefined Forecast, by Country 2020 & 2033
- Table 40: Asia Pacific Gas Insulated Switchgear Market Volume Gigawatt Forecast, by Country 2020 & 2033
- Table 41: Asia Pacific Gas Insulated Switchgear Market Revenue undefined Forecast, by Voltage Level 2020 & 2033
- Table 42: Asia Pacific Gas Insulated Switchgear Market Volume Gigawatt Forecast, by Voltage Level 2020 & 2033
- Table 43: Asia Pacific Gas Insulated Switchgear Market Revenue undefined Forecast, by End User 2020 & 2033
- Table 44: Asia Pacific Gas Insulated Switchgear Market Volume Gigawatt Forecast, by End User 2020 & 2033
- Table 45: Asia Pacific Gas Insulated Switchgear Market Revenue undefined Forecast, by Geography 2020 & 2033
- Table 46: Asia Pacific Gas Insulated Switchgear Market Volume Gigawatt Forecast, by Geography 2020 & 2033
- Table 47: Asia Pacific Gas Insulated Switchgear Market Revenue undefined Forecast, by Country 2020 & 2033
- Table 48: Asia Pacific Gas Insulated Switchgear Market Volume Gigawatt Forecast, by Country 2020 & 2033
Frequently Asked Questions
1. What is the projected Compound Annual Growth Rate (CAGR) of the Asia Pacific Gas Insulated Switchgear Market?
The projected CAGR is approximately 7.1%.
2. Which companies are prominent players in the Asia Pacific Gas Insulated Switchgear Market?
Key companies in the market include Toshiba Corp, Hitachi Ltd, Mitsubishi Electric Corporation, Schneider Electric SE, Eaton Corporation PLC, Powell Industries Inc, Siemens Energy AG, General Electric Company, Hyosung Heavy Industries Corp, Bharat Heavy Electricals Limited.
3. What are the main segments of the Asia Pacific Gas Insulated Switchgear Market?
The market segments include Voltage Level, End User, Geography.
4. Can you provide details about the market size?
The market size is estimated to be USD XXX N/A as of 2022.
5. What are some drivers contributing to market growth?
4.; Increasing Demand For Power Quality In Industrial And Manufacturing Sectors4.; Increase In Smart Grid Infrastructure.
6. What are the notable trends driving market growth?
High Voltage Level Segment Expected to Dominate the Market.
7. Are there any restraints impacting market growth?
4.; High Costs Of Power Quality Equipment.
8. Can you provide examples of recent developments in the market?
In May 2022, German start-up Nuventura sought partners in China to commercialize a replacement for sulfur hexafluoride (SF6), the world's most harmful greenhouse gas widely used in electricity distribution grids. The Asian Development Bank-backed firm plans to transfer its technology to makers of medium voltage gas-insulated switchgear (GIS) in China that cannot develop a replacement for SF6.
9. What pricing options are available for accessing the report?
Pricing options include single-user, multi-user, and enterprise licenses priced at USD 4750, USD 5250, and USD 8750 respectively.
10. Is the market size provided in terms of value or volume?
The market size is provided in terms of value, measured in N/A and volume, measured in Gigawatt.
11. Are there any specific market keywords associated with the report?
Yes, the market keyword associated with the report is "Asia Pacific Gas Insulated Switchgear Market," which aids in identifying and referencing the specific market segment covered.
12. How do I determine which pricing option suits my needs best?
The pricing options vary based on user requirements and access needs. Individual users may opt for single-user licenses, while businesses requiring broader access may choose multi-user or enterprise licenses for cost-effective access to the report.
13. Are there any additional resources or data provided in the Asia Pacific Gas Insulated Switchgear Market report?
While the report offers comprehensive insights, it's advisable to review the specific contents or supplementary materials provided to ascertain if additional resources or data are available.
14. How can I stay updated on further developments or reports in the Asia Pacific Gas Insulated Switchgear Market?
To stay informed about further developments, trends, and reports in the Asia Pacific Gas Insulated Switchgear Market, consider subscribing to industry newsletters, following relevant companies and organizations, or regularly checking reputable industry news sources and publications.
Methodology
Step 1 - Identification of Relevant Samples Size from Population Database


Step 2 - Approaches for Defining Global Market Size (Value, Volume* & Price*)

Note*: In applicable scenarios
Step 3 - Data Sources
Primary Research
- Web Analytics
- Survey Reports
- Research Institute
- Latest Research Reports
- Opinion Leaders
Secondary Research
- Annual Reports
- White Paper
- Latest Press Release
- Industry Association
- Paid Database
- Investor Presentations

Step 4 - Data Triangulation
Involves using different sources of information in order to increase the validity of a study
These sources are likely to be stakeholders in a program - participants, other researchers, program staff, other community members, and so on.
Then we put all data in single framework & apply various statistical tools to find out the dynamic on the market.
During the analysis stage, feedback from the stakeholder groups would be compared to determine areas of agreement as well as areas of divergence