

Key Insights
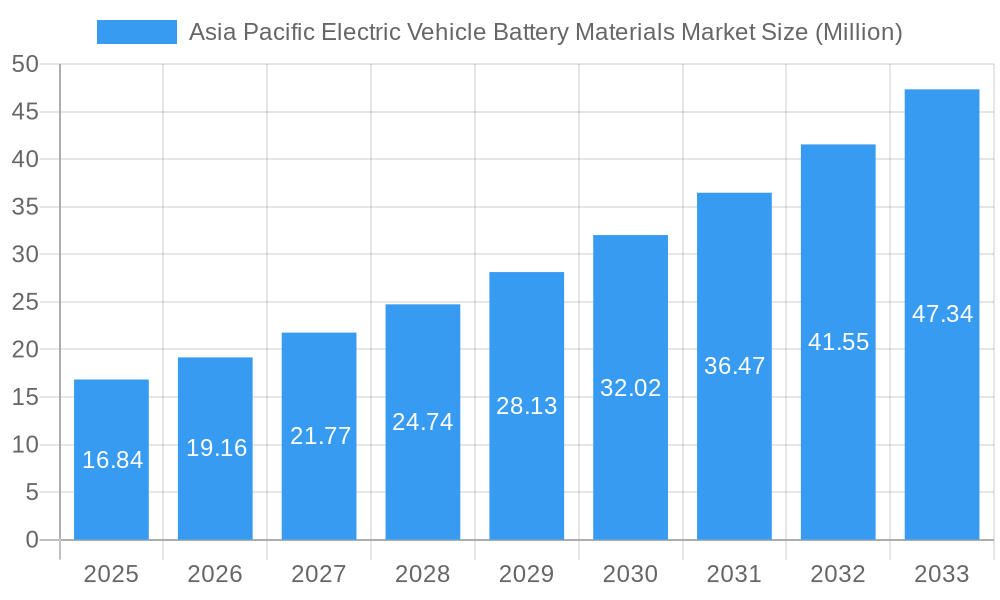
The Asia Pacific Electric Vehicle Battery Materials Market is poised for substantial expansion, driven by the burgeoning electric vehicle (EV) sector across the region. With a current market size of USD 16.84 Million and a projected Compound Annual Growth Rate (CAGR) of 13.61%, this market is set to witness dynamic growth throughout the forecast period of 2025-2033. This robust growth is fueled by supportive government policies, increasing environmental consciousness among consumers, and the continuous innovation in battery technology. Key market drivers include the escalating demand for high-performance batteries for EVs, the significant investments being made by major automotive manufacturers in electrification, and the growing need for sustainable energy storage solutions. The dominant trend is the shift towards advanced battery chemistries, particularly lithium-ion, which offers superior energy density and faster charging capabilities compared to traditional lead-acid batteries. This innovation is further supported by advancements in cathode, anode, and electrolyte materials, which are crucial for enhancing battery performance and longevity.
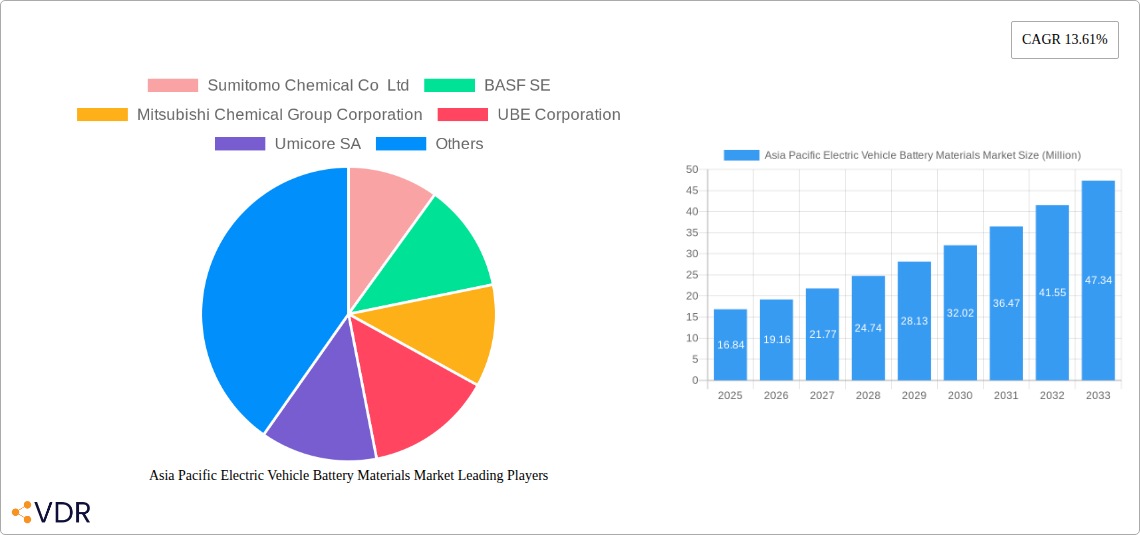
Asia Pacific Electric Vehicle Battery Materials Market Market Size (In Million)
While the market benefits from strong growth drivers, certain restraints need to be addressed. The volatility in raw material prices, such as lithium and cobalt, can impact production costs and ultimately affect the pricing of EV batteries and the materials used. Supply chain disruptions and the geopolitical landscape also present challenges to consistent material sourcing. However, ongoing research and development efforts focused on alternative materials and recycling technologies are expected to mitigate these restraints. The market segmentation reveals a clear dominance of Lithium-ion batteries, reflecting their widespread adoption in the EV industry. Geographically, China stands as a powerhouse in this market, owing to its established EV manufacturing base and substantial domestic demand. Other key regions like India, Japan, South Korea, and Southeast Asian nations are also exhibiting significant growth potential, driven by their own expanding EV ecosystems and strategic investments. The competitive landscape features major global players like Sumitomo Chemical, BASF SE, and Contemporary Amperex Technology Co Limited, who are actively involved in material innovation and expanding production capacities to meet the surging demand.
Asia Pacific Electric Vehicle Battery Materials Market Company Market Share
Asia Pacific Electric Vehicle Battery Materials Market: Comprehensive Report 2024-2033
Unlock unparalleled insights into the burgeoning Asia Pacific electric vehicle (EV) battery materials market. This in-depth report provides a critical analysis of market dynamics, growth trends, regional dominance, and the competitive landscape, equipping industry stakeholders with actionable intelligence for strategic decision-making.
The Asia Pacific EV battery materials market is a critical hub for global electric mobility, driven by robust government initiatives, rapid technological advancements, and escalating consumer adoption of electric vehicles. This report delves deep into the intricate supply chain of EV battery materials, encompassing Cathode, Anode, Electrolyte, and Separator segments, with a particular focus on the dominant Lithium-ion Battery technology.
This study encompasses a comprehensive forecast period from 2025 to 2033, with a base year of 2025. Historical data from 2019-2024 provides a foundational understanding of past market trajectories. All quantitative values are presented in Million units for clarity and comparability.
Key Market Segments Analyzed:
- Battery Type: Lithium-ion Battery, Lead-Acid Battery, Others
- Material: Cathode, Anode, Electrolyte, Separator, Others
- Geography: China, India, Australia, Japan, South Korea, Malaysia, Thailand, Indonesia, Vietnam, Rest of Asia-Pacific
Leading Companies Covered (List Not Exhaustive):
Sumitomo Chemical Co Ltd, BASF SE, Mitsubishi Chemical Group Corporation, UBE Corporation, Umicore SA, Contemporary Amperex Technology Co Limited, Nichia Corporation, ENTEK International LLC, LG Chem, Kureha Corporation.
Asia Pacific Electric Vehicle Battery Materials Market Market Dynamics & Structure
The Asia Pacific electric vehicle battery materials market is characterized by a dynamic interplay of factors shaping its present and future trajectory. Market concentration is notably high in select countries, particularly China, which leads in both production and consumption of battery materials due to its dominant EV manufacturing sector. Technological innovation is a primary driver, with continuous R&D efforts focused on enhancing battery performance, safety, and lifespan. Key innovation drivers include the pursuit of higher energy densities, faster charging capabilities, and the development of more sustainable and ethically sourced materials. Regulatory frameworks, including government incentives for EV adoption, battery recycling mandates, and stringent environmental standards, are profoundly influencing market growth and material selection. Competitive product substitutes, such as advancements in solid-state battery technology, pose a long-term challenge to incumbent lithium-ion materials, spurring further innovation. End-user demographics are shifting towards younger, environmentally conscious consumers, driving demand for affordable and high-performing EVs. Mergers and acquisitions (M&A) trends indicate a consolidation of the market, with major players strategically acquiring smaller innovators or securing raw material supply chains. For instance, recent M&A activities highlight significant investments aimed at securing critical mineral supplies and expanding manufacturing capacities.
- Market Concentration: High concentration in China, with other key players in Japan and South Korea.
- Technological Innovation Drivers: Increased energy density, faster charging, improved safety, sustainable sourcing.
- Regulatory Frameworks: Government subsidies for EVs, battery recycling policies, environmental protection laws.
- Competitive Product Substitutes: Emerging solid-state battery technologies.
- End-User Demographics: Growing environmentally conscious consumer base, increasing demand for affordable EVs.
- M&A Trends: Strategic acquisitions for raw material security and capacity expansion. In the historical period (2019-2024), an estimated 15-20 significant M&A deals have been observed within the Asia Pacific EV battery materials sector, focusing on both material producers and recycling companies.
Asia Pacific Electric Vehicle Battery Materials Market Growth Trends & Insights
The Asia Pacific electric vehicle battery materials market is poised for exceptional growth, projected to expand at a Compound Annual Growth Rate (CAGR) of approximately 18.5% from 2025 to 2033. This robust expansion is fueled by a confluence of factors, including the escalating global demand for sustainable transportation solutions and the region's pivotal role in the global EV manufacturing ecosystem. The market size, valued at an estimated $55,000 million units in 2025, is expected to reach $190,000 million units by 2033. Adoption rates of electric vehicles across Asia Pacific countries are witnessing a significant surge, driven by supportive government policies, declining battery costs, and an expanding charging infrastructure. Technological disruptions are continuously reshaping the industry, with ongoing research into novel battery chemistries, advanced cathode and anode materials, and more efficient electrolyte formulations aimed at improving energy density, charging speed, and overall battery lifespan. Consumer behavior shifts are demonstrably in favor of EVs, with a growing awareness of environmental concerns and a desire for lower running costs influencing purchasing decisions. This evolving consumer preference, coupled with increasing model availability and improving performance metrics, is acting as a powerful catalyst for market expansion. The increasing penetration of EVs into mainstream automotive markets across the region, particularly in China, South Korea, and Japan, is directly translating into heightened demand for the underlying battery materials. The development of next-generation battery technologies, such as silicon-based anodes and nickel-rich cathodes, is also a significant growth driver, promising further advancements in performance and cost-effectiveness.
- Projected CAGR (2025-2033): 18.5%
- Market Size (2025): $55,000 million units
- Market Size (2033): $190,000 million units
- Key Growth Drivers: Government EV incentives, declining battery costs, expanding charging infrastructure, technological advancements in battery chemistry, evolving consumer preferences.
- Market Penetration: Steadily increasing as EV adoption rates climb across key Asian markets.
- Technological Disruptions: Innovations in solid-state batteries, advanced cathode/anode materials, and electrolyte formulations.
- Consumer Behavior Shifts: Growing environmental consciousness, demand for lower operating costs, and increasing awareness of EV benefits.
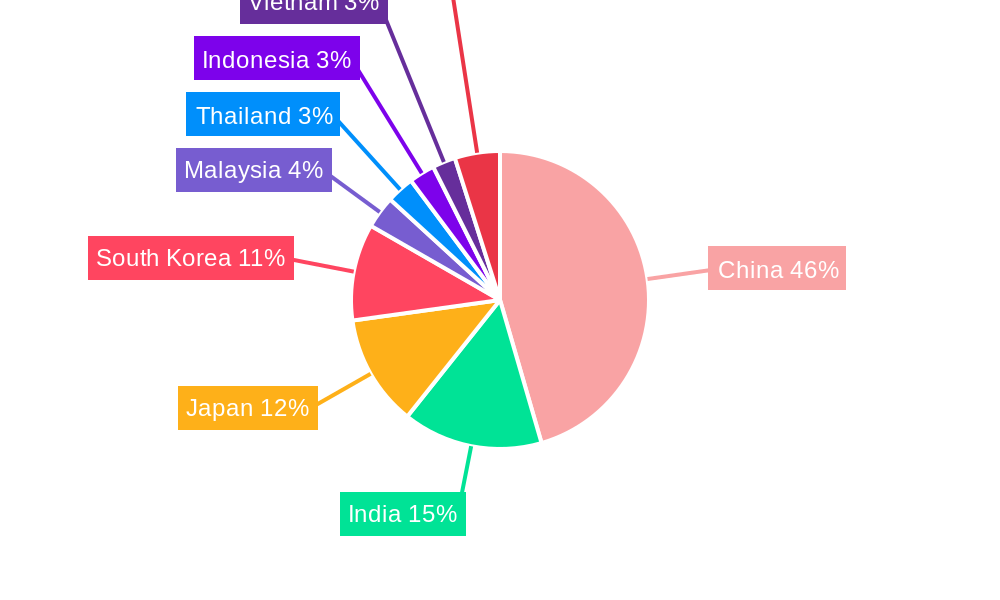
Dominant Regions, Countries, or Segments in Asia Pacific Electric Vehicle Battery Materials Market
China stands as the undisputed leader in the Asia Pacific electric vehicle battery materials market, driven by its colossal EV manufacturing output and extensive domestic supply chain. Its dominance is further bolstered by significant government support, aggressive policy incentives for EV adoption, and substantial investments in battery research and development. As a result, the Lithium-ion Battery segment, particularly within the Cathode and Anode material categories, experiences its most substantial growth and demand in China. The country's sheer volume of EV production translates into an unparalleled demand for these critical battery components.
Japan and South Korea are also pivotal players, renowned for their technological prowess in battery innovation and their significant contributions to the global EV market. These nations are at the forefront of developing advanced battery materials and next-generation battery technologies, contributing to the growth of high-performance Lithium-ion Batteries. Their focus often leans towards specialized materials and advanced manufacturing techniques for premium EV segments.
India is emerging as a significant growth market, driven by government initiatives like the National Electric Mobility Mission Plan and increasing investments in domestic manufacturing. The Rest of Asia-Pacific region, encompassing countries like Malaysia, Thailand, and Indonesia, is also witnessing burgeoning growth due to expanding EV adoption and the establishment of regional manufacturing hubs, particularly for battery components and assembly.
The dominance is further solidified by the substantial market share of Lithium-ion Batteries, which account for over 95% of the total EV battery market. Within this segment, Cathode materials are the highest value contributors due to their complexity and impact on battery performance. The projected growth in this segment is intrinsically linked to the rising global demand for electric vehicles, with China alone representing a substantial portion of this demand.
- Dominant Region: China, leading in EV production and battery material manufacturing.
- Key Country Markets: China, Japan, South Korea, India.
- Dominant Battery Type: Lithium-ion Battery (over 95% market share).
- Dominant Material Segment: Cathode materials, followed by Anode materials, due to their critical role in energy density and cost.
- Key Drivers of Dominance:
- Economic Policies: Government incentives, subsidies, and favorable tax structures for EV and battery manufacturing.
- Infrastructure Development: Expansion of charging networks and robust electricity grids.
- Manufacturing Prowess: Extensive production capacity and established supply chains.
- Technological Innovation: Leading research and development in battery chemistry and materials.
- Consumer Adoption: Increasing acceptance and demand for electric vehicles.
Asia Pacific Electric Vehicle Battery Materials Market Product Landscape
The product landscape of the Asia Pacific EV battery materials market is characterized by continuous innovation aimed at enhancing energy density, charging speeds, safety, and lifespan. Key developments include advanced cathode materials such as Nickel-Cobalt-Manganese (NCM) and Nickel-Cobalt-Aluminum (NCA) oxides, offering higher energy storage capacities. Anode materials are evolving with the integration of silicon to boost performance and reduce reliance on graphite. Electrolyte formulations are being optimized for improved ionic conductivity and thermal stability, with a growing focus on solid-state electrolytes for enhanced safety and energy density. Separator technologies are advancing to prevent short circuits and improve overall battery reliability. These material innovations directly translate to improved EV performance metrics, including extended driving ranges, faster charging times, and enhanced battery longevity, making them critical competitive advantages for EV manufacturers.
Key Drivers, Barriers & Challenges in Asia Pacific Electric Vehicle Battery Materials Market
Key Drivers:
The Asia Pacific EV battery materials market is propelled by several potent drivers. Foremost among these is the escalating global demand for electric vehicles, spurred by environmental concerns and government mandates for emissions reduction. Significant government incentives, subsidies for EV purchases, and preferential tax policies are actively encouraging consumer adoption. Continuous technological advancements in battery chemistry and materials are leading to improved performance, longer lifespans, and reduced costs, making EVs more attractive. The expanding charging infrastructure across the region also plays a crucial role in alleviating range anxiety and promoting EV ownership. Furthermore, increasing investments in domestic manufacturing capabilities by both established automakers and new entrants are bolstering the supply chain and driving material demand.
- Environmental Regulations & Government Mandates: Push for zero-emission vehicles.
- Government Subsidies & Incentives: Making EVs more affordable.
- Technological Advancements: Higher energy density, faster charging, improved safety.
- Expanding Charging Infrastructure: Reducing range anxiety for consumers.
- Growing Investments in EV Manufacturing: Strengthening the supply chain.
Barriers & Challenges:
Despite the positive outlook, the market faces significant barriers and challenges. The volatility in the prices and availability of key raw materials, such as lithium, cobalt, and nickel, poses a substantial risk to production costs and supply chain stability. Developing and scaling up the production of advanced battery materials requires significant capital investment and advanced technological expertise. Stringent regulatory hurdles related to battery safety, disposal, and recycling can also slow down market expansion. Intense competition among material suppliers and the threat of emerging alternative battery technologies necessitate continuous innovation and cost optimization. Supply chain disruptions, exacerbated by geopolitical factors and logistical complexities, can impact timely delivery and production schedules.
- Raw Material Price Volatility & Availability: Fluctuations in lithium, cobalt, and nickel prices.
- High Capital Investment: For R&D and large-scale production facilities.
- Regulatory Hurdles: Safety standards, recycling mandates, and environmental compliance.
- Intense Competition: Pressure on pricing and innovation.
- Supply Chain Disruptions: Geopolitical risks and logistical challenges.
Emerging Opportunities in Asia Pacific Electric Vehicle Battery Materials Market
Emerging opportunities within the Asia Pacific EV battery materials market lie in the burgeoning demand for sustainable and ethically sourced materials. The development and commercialization of next-generation battery technologies, such as solid-state batteries and silicon-anode batteries, present significant growth potential. Furthermore, the growing focus on battery recycling and the circular economy offers lucrative prospects for companies involved in material recovery and repurposing. Untapped markets in Southeast Asia and South Asia, with their rapidly growing middle classes and increasing focus on electrification, represent significant expansion opportunities. The increasing demand for electric two-wheelers and commercial vehicles also opens new avenues for specialized battery material solutions.
Growth Accelerators in the Asia Pacific Electric Vehicle Battery Materials Market Industry
The long-term growth of the Asia Pacific EV battery materials market is being significantly accelerated by several key factors. Breakthroughs in material science are leading to batteries with higher energy densities and faster charging capabilities, directly enhancing EV performance and consumer appeal. Strategic partnerships between battery manufacturers, material suppliers, and automotive OEMs are crucial for streamlining innovation and ensuring supply chain stability. Furthermore, market expansion strategies, including the establishment of new manufacturing facilities in emerging economies and diversification of supply sources, are bolstering growth. The ongoing push towards electrification across various vehicle segments, from passenger cars to commercial fleets, creates a sustained demand for battery materials.
Key Players Shaping the Asia Pacific Electric Vehicle Battery Materials Market Market
- Sumitomo Chemical Co Ltd
- BASF SE
- Mitsubishi Chemical Group Corporation
- UBE Corporation
- Umicore SA
- Contemporary Amperex Technology Co Limited
- Nichia Corporation
- ENTEK International LLC
- LG Chem
- Kureha Corporation
Notable Milestones in Asia Pacific Electric Vehicle Battery Materials Market Sector
- November 2023: SK On Co. and BASF SE collaborate to develop industry-leading battery materials for lithium-ion batteries in North America and the Asia-Pacific, aiming to enhance long-term competitiveness amidst slowing eco-friendly automobile industry growth.
- June 2023: Japan develops a rechargeable solid-air battery. Researchers demonstrate an all-solid-state rechargeable air battery utilizing a proton-conductive polymer electrolyte and a redox-active organic negative electrode, showcasing performance near theoretical maximum capacity.
In-Depth Asia Pacific Electric Vehicle Battery Materials Market Market Outlook
The future outlook for the Asia Pacific electric vehicle battery materials market is exceptionally promising, driven by continued technological advancements and supportive policy environments. Growth accelerators include the relentless pursuit of higher energy density and faster charging solutions, alongside the increasing adoption of solid-state battery technology, which promises enhanced safety and performance. Strategic partnerships between key industry players will continue to be vital for securing raw material supplies and fostering innovation. Market expansion into emerging economies within the region presents substantial opportunities for growth. The overarching trend towards electrification across all vehicle segments, from personal mobility to heavy-duty transport, will ensure a sustained and robust demand for a diverse range of battery materials. This dynamic landscape offers considerable strategic opportunities for market participants to innovate, expand, and capitalize on the transformative shift towards electric mobility.
Asia Pacific Electric Vehicle Battery Materials Market Segmentation
-
1. Battery Type
- 1.1. Lithium-ion Battery
- 1.2. Lead-Acid Battery
- 1.3. Others
-
2. Material
- 2.1. Cathode
- 2.2. Anode
- 2.3. Electrolyte
- 2.4. Separator
- 2.5. Others
-
3. Geography
- 3.1. China
- 3.2. India
- 3.3. Australia
- 3.4. Japan
- 3.5. South Korea
- 3.6. Malaysia
- 3.7. Thailand
- 3.8. Indonesia
- 3.9. Vietnam
- 3.10. Rest of Asia-Pacific
Asia Pacific Electric Vehicle Battery Materials Market Segmentation By Geography
- 1. China
- 2. India
- 3. Australia
- 4. Japan
- 5. South Korea
- 6. Malaysia
- 7. Thailand
- 8. Indonesia
- 9. Vietnam
- 10. Rest of Asia Pacific
Asia Pacific Electric Vehicle Battery Materials Market Regional Market Share
Geographic Coverage of Asia Pacific Electric Vehicle Battery Materials Market
Asia Pacific Electric Vehicle Battery Materials Market REPORT HIGHLIGHTS
| Aspects | Details |
|---|---|
| Study Period | 2020-2034 |
| Base Year | 2025 |
| Estimated Year | 2026 |
| Forecast Period | 2026-2034 |
| Historical Period | 2020-2025 |
| Growth Rate | CAGR of 13.61% from 2020-2034 |
| Segmentation |
|
Table of Contents
- 1. Introduction
- 1.1. Research Scope
- 1.2. Market Segmentation
- 1.3. Research Objective
- 1.4. Definitions and Assumptions
- 2. Executive Summary
- 2.1. Market Snapshot
- 3. Market Dynamics
- 3.1. Market Drivers
- 3.2. Market Restrains
- 3.3. Market Trends
- 3.4. Market Opportunities
- 4. Market Factor Analysis
- 4.1. Porters Five Forces
- 4.1.1. Bargaining Power of Suppliers
- 4.1.2. Bargaining Power of Buyers
- 4.1.3. Threat of New Entrants
- 4.1.4. Threat of Substitutes
- 4.1.5. Competitive Rivalry
- 4.2. PESTEL analysis
- 4.3. BCG Analysis
- 4.3.1. Stars (High Growth, High Market Share)
- 4.3.2. Cash Cows (Low Growth, High Market Share)
- 4.3.3. Question Mark (High Growth, Low Market Share)
- 4.3.4. Dogs (Low Growth, Low Market Share)
- 4.4. Ansoff Matrix Analysis
- 4.5. Supply Chain Analysis
- 4.6. Regulatory Landscape
- 4.7. Current Market Potential and Opportunity Assessment (TAM–SAM–SOM Framework)
- 4.8. VDR Analyst Note
- 4.1. Porters Five Forces
- 5. Market Analysis, Insights and Forecast 2021-2033
- 5.1. Market Analysis, Insights and Forecast - by Battery Type
- 5.1.1. Lithium-ion Battery
- 5.1.2. Lead-Acid Battery
- 5.1.3. Others
- 5.2. Market Analysis, Insights and Forecast - by Material
- 5.2.1. Cathode
- 5.2.2. Anode
- 5.2.3. Electrolyte
- 5.2.4. Separator
- 5.2.5. Others
- 5.3. Market Analysis, Insights and Forecast - by Geography
- 5.3.1. China
- 5.3.2. India
- 5.3.3. Australia
- 5.3.4. Japan
- 5.3.5. South Korea
- 5.3.6. Malaysia
- 5.3.7. Thailand
- 5.3.8. Indonesia
- 5.3.9. Vietnam
- 5.3.10. Rest of Asia-Pacific
- 5.4. Market Analysis, Insights and Forecast - by Region
- 5.4.1. China
- 5.4.2. India
- 5.4.3. Australia
- 5.4.4. Japan
- 5.4.5. South Korea
- 5.4.6. Malaysia
- 5.4.7. Thailand
- 5.4.8. Indonesia
- 5.4.9. Vietnam
- 5.4.10. Rest of Asia Pacific
- 5.1. Market Analysis, Insights and Forecast - by Battery Type
- 6. Global Asia Pacific Electric Vehicle Battery Materials Market Analysis, Insights and Forecast, 2021-2033
- 6.1. Market Analysis, Insights and Forecast - by Battery Type
- 6.1.1. Lithium-ion Battery
- 6.1.2. Lead-Acid Battery
- 6.1.3. Others
- 6.2. Market Analysis, Insights and Forecast - by Material
- 6.2.1. Cathode
- 6.2.2. Anode
- 6.2.3. Electrolyte
- 6.2.4. Separator
- 6.2.5. Others
- 6.3. Market Analysis, Insights and Forecast - by Geography
- 6.3.1. China
- 6.3.2. India
- 6.3.3. Australia
- 6.3.4. Japan
- 6.3.5. South Korea
- 6.3.6. Malaysia
- 6.3.7. Thailand
- 6.3.8. Indonesia
- 6.3.9. Vietnam
- 6.3.10. Rest of Asia-Pacific
- 6.1. Market Analysis, Insights and Forecast - by Battery Type
- 7. China Asia Pacific Electric Vehicle Battery Materials Market Analysis, Insights and Forecast, 2021-2033
- 7.1. Market Analysis, Insights and Forecast - by Battery Type
- 7.1.1. Lithium-ion Battery
- 7.1.2. Lead-Acid Battery
- 7.1.3. Others
- 7.2. Market Analysis, Insights and Forecast - by Material
- 7.2.1. Cathode
- 7.2.2. Anode
- 7.2.3. Electrolyte
- 7.2.4. Separator
- 7.2.5. Others
- 7.3. Market Analysis, Insights and Forecast - by Geography
- 7.3.1. China
- 7.3.2. India
- 7.3.3. Australia
- 7.3.4. Japan
- 7.3.5. South Korea
- 7.3.6. Malaysia
- 7.3.7. Thailand
- 7.3.8. Indonesia
- 7.3.9. Vietnam
- 7.3.10. Rest of Asia-Pacific
- 7.1. Market Analysis, Insights and Forecast - by Battery Type
- 8. India Asia Pacific Electric Vehicle Battery Materials Market Analysis, Insights and Forecast, 2021-2033
- 8.1. Market Analysis, Insights and Forecast - by Battery Type
- 8.1.1. Lithium-ion Battery
- 8.1.2. Lead-Acid Battery
- 8.1.3. Others
- 8.2. Market Analysis, Insights and Forecast - by Material
- 8.2.1. Cathode
- 8.2.2. Anode
- 8.2.3. Electrolyte
- 8.2.4. Separator
- 8.2.5. Others
- 8.3. Market Analysis, Insights and Forecast - by Geography
- 8.3.1. China
- 8.3.2. India
- 8.3.3. Australia
- 8.3.4. Japan
- 8.3.5. South Korea
- 8.3.6. Malaysia
- 8.3.7. Thailand
- 8.3.8. Indonesia
- 8.3.9. Vietnam
- 8.3.10. Rest of Asia-Pacific
- 8.1. Market Analysis, Insights and Forecast - by Battery Type
- 9. Australia Asia Pacific Electric Vehicle Battery Materials Market Analysis, Insights and Forecast, 2021-2033
- 9.1. Market Analysis, Insights and Forecast - by Battery Type
- 9.1.1. Lithium-ion Battery
- 9.1.2. Lead-Acid Battery
- 9.1.3. Others
- 9.2. Market Analysis, Insights and Forecast - by Material
- 9.2.1. Cathode
- 9.2.2. Anode
- 9.2.3. Electrolyte
- 9.2.4. Separator
- 9.2.5. Others
- 9.3. Market Analysis, Insights and Forecast - by Geography
- 9.3.1. China
- 9.3.2. India
- 9.3.3. Australia
- 9.3.4. Japan
- 9.3.5. South Korea
- 9.3.6. Malaysia
- 9.3.7. Thailand
- 9.3.8. Indonesia
- 9.3.9. Vietnam
- 9.3.10. Rest of Asia-Pacific
- 9.1. Market Analysis, Insights and Forecast - by Battery Type
- 10. Japan Asia Pacific Electric Vehicle Battery Materials Market Analysis, Insights and Forecast, 2021-2033
- 10.1. Market Analysis, Insights and Forecast - by Battery Type
- 10.1.1. Lithium-ion Battery
- 10.1.2. Lead-Acid Battery
- 10.1.3. Others
- 10.2. Market Analysis, Insights and Forecast - by Material
- 10.2.1. Cathode
- 10.2.2. Anode
- 10.2.3. Electrolyte
- 10.2.4. Separator
- 10.2.5. Others
- 10.3. Market Analysis, Insights and Forecast - by Geography
- 10.3.1. China
- 10.3.2. India
- 10.3.3. Australia
- 10.3.4. Japan
- 10.3.5. South Korea
- 10.3.6. Malaysia
- 10.3.7. Thailand
- 10.3.8. Indonesia
- 10.3.9. Vietnam
- 10.3.10. Rest of Asia-Pacific
- 10.1. Market Analysis, Insights and Forecast - by Battery Type
- 11. South Korea Asia Pacific Electric Vehicle Battery Materials Market Analysis, Insights and Forecast, 2021-2033
- 11.1. Market Analysis, Insights and Forecast - by Battery Type
- 11.1.1. Lithium-ion Battery
- 11.1.2. Lead-Acid Battery
- 11.1.3. Others
- 11.2. Market Analysis, Insights and Forecast - by Material
- 11.2.1. Cathode
- 11.2.2. Anode
- 11.2.3. Electrolyte
- 11.2.4. Separator
- 11.2.5. Others
- 11.3. Market Analysis, Insights and Forecast - by Geography
- 11.3.1. China
- 11.3.2. India
- 11.3.3. Australia
- 11.3.4. Japan
- 11.3.5. South Korea
- 11.3.6. Malaysia
- 11.3.7. Thailand
- 11.3.8. Indonesia
- 11.3.9. Vietnam
- 11.3.10. Rest of Asia-Pacific
- 11.1. Market Analysis, Insights and Forecast - by Battery Type
- 12. Malaysia Asia Pacific Electric Vehicle Battery Materials Market Analysis, Insights and Forecast, 2021-2033
- 12.1. Market Analysis, Insights and Forecast - by Battery Type
- 12.1.1. Lithium-ion Battery
- 12.1.2. Lead-Acid Battery
- 12.1.3. Others
- 12.2. Market Analysis, Insights and Forecast - by Material
- 12.2.1. Cathode
- 12.2.2. Anode
- 12.2.3. Electrolyte
- 12.2.4. Separator
- 12.2.5. Others
- 12.3. Market Analysis, Insights and Forecast - by Geography
- 12.3.1. China
- 12.3.2. India
- 12.3.3. Australia
- 12.3.4. Japan
- 12.3.5. South Korea
- 12.3.6. Malaysia
- 12.3.7. Thailand
- 12.3.8. Indonesia
- 12.3.9. Vietnam
- 12.3.10. Rest of Asia-Pacific
- 12.1. Market Analysis, Insights and Forecast - by Battery Type
- 13. Thailand Asia Pacific Electric Vehicle Battery Materials Market Analysis, Insights and Forecast, 2021-2033
- 13.1. Market Analysis, Insights and Forecast - by Battery Type
- 13.1.1. Lithium-ion Battery
- 13.1.2. Lead-Acid Battery
- 13.1.3. Others
- 13.2. Market Analysis, Insights and Forecast - by Material
- 13.2.1. Cathode
- 13.2.2. Anode
- 13.2.3. Electrolyte
- 13.2.4. Separator
- 13.2.5. Others
- 13.3. Market Analysis, Insights and Forecast - by Geography
- 13.3.1. China
- 13.3.2. India
- 13.3.3. Australia
- 13.3.4. Japan
- 13.3.5. South Korea
- 13.3.6. Malaysia
- 13.3.7. Thailand
- 13.3.8. Indonesia
- 13.3.9. Vietnam
- 13.3.10. Rest of Asia-Pacific
- 13.1. Market Analysis, Insights and Forecast - by Battery Type
- 14. Indonesia Asia Pacific Electric Vehicle Battery Materials Market Analysis, Insights and Forecast, 2021-2033
- 14.1. Market Analysis, Insights and Forecast - by Battery Type
- 14.1.1. Lithium-ion Battery
- 14.1.2. Lead-Acid Battery
- 14.1.3. Others
- 14.2. Market Analysis, Insights and Forecast - by Material
- 14.2.1. Cathode
- 14.2.2. Anode
- 14.2.3. Electrolyte
- 14.2.4. Separator
- 14.2.5. Others
- 14.3. Market Analysis, Insights and Forecast - by Geography
- 14.3.1. China
- 14.3.2. India
- 14.3.3. Australia
- 14.3.4. Japan
- 14.3.5. South Korea
- 14.3.6. Malaysia
- 14.3.7. Thailand
- 14.3.8. Indonesia
- 14.3.9. Vietnam
- 14.3.10. Rest of Asia-Pacific
- 14.1. Market Analysis, Insights and Forecast - by Battery Type
- 15. Vietnam Asia Pacific Electric Vehicle Battery Materials Market Analysis, Insights and Forecast, 2021-2033
- 15.1. Market Analysis, Insights and Forecast - by Battery Type
- 15.1.1. Lithium-ion Battery
- 15.1.2. Lead-Acid Battery
- 15.1.3. Others
- 15.2. Market Analysis, Insights and Forecast - by Material
- 15.2.1. Cathode
- 15.2.2. Anode
- 15.2.3. Electrolyte
- 15.2.4. Separator
- 15.2.5. Others
- 15.3. Market Analysis, Insights and Forecast - by Geography
- 15.3.1. China
- 15.3.2. India
- 15.3.3. Australia
- 15.3.4. Japan
- 15.3.5. South Korea
- 15.3.6. Malaysia
- 15.3.7. Thailand
- 15.3.8. Indonesia
- 15.3.9. Vietnam
- 15.3.10. Rest of Asia-Pacific
- 15.1. Market Analysis, Insights and Forecast - by Battery Type
- 16. Rest of Asia Pacific Asia Pacific Electric Vehicle Battery Materials Market Analysis, Insights and Forecast, 2021-2033
- 16.1. Market Analysis, Insights and Forecast - by Battery Type
- 16.1.1. Lithium-ion Battery
- 16.1.2. Lead-Acid Battery
- 16.1.3. Others
- 16.2. Market Analysis, Insights and Forecast - by Material
- 16.2.1. Cathode
- 16.2.2. Anode
- 16.2.3. Electrolyte
- 16.2.4. Separator
- 16.2.5. Others
- 16.3. Market Analysis, Insights and Forecast - by Geography
- 16.3.1. China
- 16.3.2. India
- 16.3.3. Australia
- 16.3.4. Japan
- 16.3.5. South Korea
- 16.3.6. Malaysia
- 16.3.7. Thailand
- 16.3.8. Indonesia
- 16.3.9. Vietnam
- 16.3.10. Rest of Asia-Pacific
- 16.1. Market Analysis, Insights and Forecast - by Battery Type
- 17. Competitive Analysis
- 17.1. Company Profiles
- 17.1.1 Sumitomo Chemical Co Ltd
- 17.1.1.1. Company Overview
- 17.1.1.2. Products
- 17.1.1.3. Company Financials
- 17.1.1.4. SWOT Analysis
- 17.1.2 BASF SE
- 17.1.2.1. Company Overview
- 17.1.2.2. Products
- 17.1.2.3. Company Financials
- 17.1.2.4. SWOT Analysis
- 17.1.3 Mitsubishi Chemical Group Corporation
- 17.1.3.1. Company Overview
- 17.1.3.2. Products
- 17.1.3.3. Company Financials
- 17.1.3.4. SWOT Analysis
- 17.1.4 UBE Corporation
- 17.1.4.1. Company Overview
- 17.1.4.2. Products
- 17.1.4.3. Company Financials
- 17.1.4.4. SWOT Analysis
- 17.1.5 Umicore SA
- 17.1.5.1. Company Overview
- 17.1.5.2. Products
- 17.1.5.3. Company Financials
- 17.1.5.4. SWOT Analysis
- 17.1.6 Contemporary Amperex Technology Co Limited
- 17.1.6.1. Company Overview
- 17.1.6.2. Products
- 17.1.6.3. Company Financials
- 17.1.6.4. SWOT Analysis
- 17.1.7 Nichia Corporation
- 17.1.7.1. Company Overview
- 17.1.7.2. Products
- 17.1.7.3. Company Financials
- 17.1.7.4. SWOT Analysis
- 17.1.8 ENTEK International LLC
- 17.1.8.1. Company Overview
- 17.1.8.2. Products
- 17.1.8.3. Company Financials
- 17.1.8.4. SWOT Analysis
- 17.1.9 LG Chem
- 17.1.9.1. Company Overview
- 17.1.9.2. Products
- 17.1.9.3. Company Financials
- 17.1.9.4. SWOT Analysis
- 17.1.10 Kureha Corporation*List Not Exhaustive 6 4 List of Other Prominent Companies6 5 Market Ranking/ Share Analysi
- 17.1.10.1. Company Overview
- 17.1.10.2. Products
- 17.1.10.3. Company Financials
- 17.1.10.4. SWOT Analysis
- 17.1.1 Sumitomo Chemical Co Ltd
- 17.2. Market Entropy
- 17.2.1 Company's Key Areas Served
- 17.2.2 Recent Developments
- 17.3. Company Market Share Analysis 2025
- 17.3.1 Top 5 Companies Market Share Analysis
- 17.3.2 Top 3 Companies Market Share Analysis
- 17.4. List of Potential Customers
- 18. Research Methodology
List of Figures
- Figure 1: Global Asia Pacific Electric Vehicle Battery Materials Market Revenue Breakdown (Million, %) by Region 2025 & 2033
- Figure 2: Global Asia Pacific Electric Vehicle Battery Materials Market Volume Breakdown (Billion, %) by Region 2025 & 2033
- Figure 3: China Asia Pacific Electric Vehicle Battery Materials Market Revenue (Million), by Battery Type 2025 & 2033
- Figure 4: China Asia Pacific Electric Vehicle Battery Materials Market Volume (Billion), by Battery Type 2025 & 2033
- Figure 5: China Asia Pacific Electric Vehicle Battery Materials Market Revenue Share (%), by Battery Type 2025 & 2033
- Figure 6: China Asia Pacific Electric Vehicle Battery Materials Market Volume Share (%), by Battery Type 2025 & 2033
- Figure 7: China Asia Pacific Electric Vehicle Battery Materials Market Revenue (Million), by Material 2025 & 2033
- Figure 8: China Asia Pacific Electric Vehicle Battery Materials Market Volume (Billion), by Material 2025 & 2033
- Figure 9: China Asia Pacific Electric Vehicle Battery Materials Market Revenue Share (%), by Material 2025 & 2033
- Figure 10: China Asia Pacific Electric Vehicle Battery Materials Market Volume Share (%), by Material 2025 & 2033
- Figure 11: China Asia Pacific Electric Vehicle Battery Materials Market Revenue (Million), by Geography 2025 & 2033
- Figure 12: China Asia Pacific Electric Vehicle Battery Materials Market Volume (Billion), by Geography 2025 & 2033
- Figure 13: China Asia Pacific Electric Vehicle Battery Materials Market Revenue Share (%), by Geography 2025 & 2033
- Figure 14: China Asia Pacific Electric Vehicle Battery Materials Market Volume Share (%), by Geography 2025 & 2033
- Figure 15: China Asia Pacific Electric Vehicle Battery Materials Market Revenue (Million), by Country 2025 & 2033
- Figure 16: China Asia Pacific Electric Vehicle Battery Materials Market Volume (Billion), by Country 2025 & 2033
- Figure 17: China Asia Pacific Electric Vehicle Battery Materials Market Revenue Share (%), by Country 2025 & 2033
- Figure 18: China Asia Pacific Electric Vehicle Battery Materials Market Volume Share (%), by Country 2025 & 2033
- Figure 19: India Asia Pacific Electric Vehicle Battery Materials Market Revenue (Million), by Battery Type 2025 & 2033
- Figure 20: India Asia Pacific Electric Vehicle Battery Materials Market Volume (Billion), by Battery Type 2025 & 2033
- Figure 21: India Asia Pacific Electric Vehicle Battery Materials Market Revenue Share (%), by Battery Type 2025 & 2033
- Figure 22: India Asia Pacific Electric Vehicle Battery Materials Market Volume Share (%), by Battery Type 2025 & 2033
- Figure 23: India Asia Pacific Electric Vehicle Battery Materials Market Revenue (Million), by Material 2025 & 2033
- Figure 24: India Asia Pacific Electric Vehicle Battery Materials Market Volume (Billion), by Material 2025 & 2033
- Figure 25: India Asia Pacific Electric Vehicle Battery Materials Market Revenue Share (%), by Material 2025 & 2033
- Figure 26: India Asia Pacific Electric Vehicle Battery Materials Market Volume Share (%), by Material 2025 & 2033
- Figure 27: India Asia Pacific Electric Vehicle Battery Materials Market Revenue (Million), by Geography 2025 & 2033
- Figure 28: India Asia Pacific Electric Vehicle Battery Materials Market Volume (Billion), by Geography 2025 & 2033
- Figure 29: India Asia Pacific Electric Vehicle Battery Materials Market Revenue Share (%), by Geography 2025 & 2033
- Figure 30: India Asia Pacific Electric Vehicle Battery Materials Market Volume Share (%), by Geography 2025 & 2033
- Figure 31: India Asia Pacific Electric Vehicle Battery Materials Market Revenue (Million), by Country 2025 & 2033
- Figure 32: India Asia Pacific Electric Vehicle Battery Materials Market Volume (Billion), by Country 2025 & 2033
- Figure 33: India Asia Pacific Electric Vehicle Battery Materials Market Revenue Share (%), by Country 2025 & 2033
- Figure 34: India Asia Pacific Electric Vehicle Battery Materials Market Volume Share (%), by Country 2025 & 2033
- Figure 35: Australia Asia Pacific Electric Vehicle Battery Materials Market Revenue (Million), by Battery Type 2025 & 2033
- Figure 36: Australia Asia Pacific Electric Vehicle Battery Materials Market Volume (Billion), by Battery Type 2025 & 2033
- Figure 37: Australia Asia Pacific Electric Vehicle Battery Materials Market Revenue Share (%), by Battery Type 2025 & 2033
- Figure 38: Australia Asia Pacific Electric Vehicle Battery Materials Market Volume Share (%), by Battery Type 2025 & 2033
- Figure 39: Australia Asia Pacific Electric Vehicle Battery Materials Market Revenue (Million), by Material 2025 & 2033
- Figure 40: Australia Asia Pacific Electric Vehicle Battery Materials Market Volume (Billion), by Material 2025 & 2033
- Figure 41: Australia Asia Pacific Electric Vehicle Battery Materials Market Revenue Share (%), by Material 2025 & 2033
- Figure 42: Australia Asia Pacific Electric Vehicle Battery Materials Market Volume Share (%), by Material 2025 & 2033
- Figure 43: Australia Asia Pacific Electric Vehicle Battery Materials Market Revenue (Million), by Geography 2025 & 2033
- Figure 44: Australia Asia Pacific Electric Vehicle Battery Materials Market Volume (Billion), by Geography 2025 & 2033
- Figure 45: Australia Asia Pacific Electric Vehicle Battery Materials Market Revenue Share (%), by Geography 2025 & 2033
- Figure 46: Australia Asia Pacific Electric Vehicle Battery Materials Market Volume Share (%), by Geography 2025 & 2033
- Figure 47: Australia Asia Pacific Electric Vehicle Battery Materials Market Revenue (Million), by Country 2025 & 2033
- Figure 48: Australia Asia Pacific Electric Vehicle Battery Materials Market Volume (Billion), by Country 2025 & 2033
- Figure 49: Australia Asia Pacific Electric Vehicle Battery Materials Market Revenue Share (%), by Country 2025 & 2033
- Figure 50: Australia Asia Pacific Electric Vehicle Battery Materials Market Volume Share (%), by Country 2025 & 2033
- Figure 51: Japan Asia Pacific Electric Vehicle Battery Materials Market Revenue (Million), by Battery Type 2025 & 2033
- Figure 52: Japan Asia Pacific Electric Vehicle Battery Materials Market Volume (Billion), by Battery Type 2025 & 2033
- Figure 53: Japan Asia Pacific Electric Vehicle Battery Materials Market Revenue Share (%), by Battery Type 2025 & 2033
- Figure 54: Japan Asia Pacific Electric Vehicle Battery Materials Market Volume Share (%), by Battery Type 2025 & 2033
- Figure 55: Japan Asia Pacific Electric Vehicle Battery Materials Market Revenue (Million), by Material 2025 & 2033
- Figure 56: Japan Asia Pacific Electric Vehicle Battery Materials Market Volume (Billion), by Material 2025 & 2033
- Figure 57: Japan Asia Pacific Electric Vehicle Battery Materials Market Revenue Share (%), by Material 2025 & 2033
- Figure 58: Japan Asia Pacific Electric Vehicle Battery Materials Market Volume Share (%), by Material 2025 & 2033
- Figure 59: Japan Asia Pacific Electric Vehicle Battery Materials Market Revenue (Million), by Geography 2025 & 2033
- Figure 60: Japan Asia Pacific Electric Vehicle Battery Materials Market Volume (Billion), by Geography 2025 & 2033
- Figure 61: Japan Asia Pacific Electric Vehicle Battery Materials Market Revenue Share (%), by Geography 2025 & 2033
- Figure 62: Japan Asia Pacific Electric Vehicle Battery Materials Market Volume Share (%), by Geography 2025 & 2033
- Figure 63: Japan Asia Pacific Electric Vehicle Battery Materials Market Revenue (Million), by Country 2025 & 2033
- Figure 64: Japan Asia Pacific Electric Vehicle Battery Materials Market Volume (Billion), by Country 2025 & 2033
- Figure 65: Japan Asia Pacific Electric Vehicle Battery Materials Market Revenue Share (%), by Country 2025 & 2033
- Figure 66: Japan Asia Pacific Electric Vehicle Battery Materials Market Volume Share (%), by Country 2025 & 2033
- Figure 67: South Korea Asia Pacific Electric Vehicle Battery Materials Market Revenue (Million), by Battery Type 2025 & 2033
- Figure 68: South Korea Asia Pacific Electric Vehicle Battery Materials Market Volume (Billion), by Battery Type 2025 & 2033
- Figure 69: South Korea Asia Pacific Electric Vehicle Battery Materials Market Revenue Share (%), by Battery Type 2025 & 2033
- Figure 70: South Korea Asia Pacific Electric Vehicle Battery Materials Market Volume Share (%), by Battery Type 2025 & 2033
- Figure 71: South Korea Asia Pacific Electric Vehicle Battery Materials Market Revenue (Million), by Material 2025 & 2033
- Figure 72: South Korea Asia Pacific Electric Vehicle Battery Materials Market Volume (Billion), by Material 2025 & 2033
- Figure 73: South Korea Asia Pacific Electric Vehicle Battery Materials Market Revenue Share (%), by Material 2025 & 2033
- Figure 74: South Korea Asia Pacific Electric Vehicle Battery Materials Market Volume Share (%), by Material 2025 & 2033
- Figure 75: South Korea Asia Pacific Electric Vehicle Battery Materials Market Revenue (Million), by Geography 2025 & 2033
- Figure 76: South Korea Asia Pacific Electric Vehicle Battery Materials Market Volume (Billion), by Geography 2025 & 2033
- Figure 77: South Korea Asia Pacific Electric Vehicle Battery Materials Market Revenue Share (%), by Geography 2025 & 2033
- Figure 78: South Korea Asia Pacific Electric Vehicle Battery Materials Market Volume Share (%), by Geography 2025 & 2033
- Figure 79: South Korea Asia Pacific Electric Vehicle Battery Materials Market Revenue (Million), by Country 2025 & 2033
- Figure 80: South Korea Asia Pacific Electric Vehicle Battery Materials Market Volume (Billion), by Country 2025 & 2033
- Figure 81: South Korea Asia Pacific Electric Vehicle Battery Materials Market Revenue Share (%), by Country 2025 & 2033
- Figure 82: South Korea Asia Pacific Electric Vehicle Battery Materials Market Volume Share (%), by Country 2025 & 2033
- Figure 83: Malaysia Asia Pacific Electric Vehicle Battery Materials Market Revenue (Million), by Battery Type 2025 & 2033
- Figure 84: Malaysia Asia Pacific Electric Vehicle Battery Materials Market Volume (Billion), by Battery Type 2025 & 2033
- Figure 85: Malaysia Asia Pacific Electric Vehicle Battery Materials Market Revenue Share (%), by Battery Type 2025 & 2033
- Figure 86: Malaysia Asia Pacific Electric Vehicle Battery Materials Market Volume Share (%), by Battery Type 2025 & 2033
- Figure 87: Malaysia Asia Pacific Electric Vehicle Battery Materials Market Revenue (Million), by Material 2025 & 2033
- Figure 88: Malaysia Asia Pacific Electric Vehicle Battery Materials Market Volume (Billion), by Material 2025 & 2033
- Figure 89: Malaysia Asia Pacific Electric Vehicle Battery Materials Market Revenue Share (%), by Material 2025 & 2033
- Figure 90: Malaysia Asia Pacific Electric Vehicle Battery Materials Market Volume Share (%), by Material 2025 & 2033
- Figure 91: Malaysia Asia Pacific Electric Vehicle Battery Materials Market Revenue (Million), by Geography 2025 & 2033
- Figure 92: Malaysia Asia Pacific Electric Vehicle Battery Materials Market Volume (Billion), by Geography 2025 & 2033
- Figure 93: Malaysia Asia Pacific Electric Vehicle Battery Materials Market Revenue Share (%), by Geography 2025 & 2033
- Figure 94: Malaysia Asia Pacific Electric Vehicle Battery Materials Market Volume Share (%), by Geography 2025 & 2033
- Figure 95: Malaysia Asia Pacific Electric Vehicle Battery Materials Market Revenue (Million), by Country 2025 & 2033
- Figure 96: Malaysia Asia Pacific Electric Vehicle Battery Materials Market Volume (Billion), by Country 2025 & 2033
- Figure 97: Malaysia Asia Pacific Electric Vehicle Battery Materials Market Revenue Share (%), by Country 2025 & 2033
- Figure 98: Malaysia Asia Pacific Electric Vehicle Battery Materials Market Volume Share (%), by Country 2025 & 2033
- Figure 99: Thailand Asia Pacific Electric Vehicle Battery Materials Market Revenue (Million), by Battery Type 2025 & 2033
- Figure 100: Thailand Asia Pacific Electric Vehicle Battery Materials Market Volume (Billion), by Battery Type 2025 & 2033
- Figure 101: Thailand Asia Pacific Electric Vehicle Battery Materials Market Revenue Share (%), by Battery Type 2025 & 2033
- Figure 102: Thailand Asia Pacific Electric Vehicle Battery Materials Market Volume Share (%), by Battery Type 2025 & 2033
- Figure 103: Thailand Asia Pacific Electric Vehicle Battery Materials Market Revenue (Million), by Material 2025 & 2033
- Figure 104: Thailand Asia Pacific Electric Vehicle Battery Materials Market Volume (Billion), by Material 2025 & 2033
- Figure 105: Thailand Asia Pacific Electric Vehicle Battery Materials Market Revenue Share (%), by Material 2025 & 2033
- Figure 106: Thailand Asia Pacific Electric Vehicle Battery Materials Market Volume Share (%), by Material 2025 & 2033
- Figure 107: Thailand Asia Pacific Electric Vehicle Battery Materials Market Revenue (Million), by Geography 2025 & 2033
- Figure 108: Thailand Asia Pacific Electric Vehicle Battery Materials Market Volume (Billion), by Geography 2025 & 2033
- Figure 109: Thailand Asia Pacific Electric Vehicle Battery Materials Market Revenue Share (%), by Geography 2025 & 2033
- Figure 110: Thailand Asia Pacific Electric Vehicle Battery Materials Market Volume Share (%), by Geography 2025 & 2033
- Figure 111: Thailand Asia Pacific Electric Vehicle Battery Materials Market Revenue (Million), by Country 2025 & 2033
- Figure 112: Thailand Asia Pacific Electric Vehicle Battery Materials Market Volume (Billion), by Country 2025 & 2033
- Figure 113: Thailand Asia Pacific Electric Vehicle Battery Materials Market Revenue Share (%), by Country 2025 & 2033
- Figure 114: Thailand Asia Pacific Electric Vehicle Battery Materials Market Volume Share (%), by Country 2025 & 2033
- Figure 115: Indonesia Asia Pacific Electric Vehicle Battery Materials Market Revenue (Million), by Battery Type 2025 & 2033
- Figure 116: Indonesia Asia Pacific Electric Vehicle Battery Materials Market Volume (Billion), by Battery Type 2025 & 2033
- Figure 117: Indonesia Asia Pacific Electric Vehicle Battery Materials Market Revenue Share (%), by Battery Type 2025 & 2033
- Figure 118: Indonesia Asia Pacific Electric Vehicle Battery Materials Market Volume Share (%), by Battery Type 2025 & 2033
- Figure 119: Indonesia Asia Pacific Electric Vehicle Battery Materials Market Revenue (Million), by Material 2025 & 2033
- Figure 120: Indonesia Asia Pacific Electric Vehicle Battery Materials Market Volume (Billion), by Material 2025 & 2033
- Figure 121: Indonesia Asia Pacific Electric Vehicle Battery Materials Market Revenue Share (%), by Material 2025 & 2033
- Figure 122: Indonesia Asia Pacific Electric Vehicle Battery Materials Market Volume Share (%), by Material 2025 & 2033
- Figure 123: Indonesia Asia Pacific Electric Vehicle Battery Materials Market Revenue (Million), by Geography 2025 & 2033
- Figure 124: Indonesia Asia Pacific Electric Vehicle Battery Materials Market Volume (Billion), by Geography 2025 & 2033
- Figure 125: Indonesia Asia Pacific Electric Vehicle Battery Materials Market Revenue Share (%), by Geography 2025 & 2033
- Figure 126: Indonesia Asia Pacific Electric Vehicle Battery Materials Market Volume Share (%), by Geography 2025 & 2033
- Figure 127: Indonesia Asia Pacific Electric Vehicle Battery Materials Market Revenue (Million), by Country 2025 & 2033
- Figure 128: Indonesia Asia Pacific Electric Vehicle Battery Materials Market Volume (Billion), by Country 2025 & 2033
- Figure 129: Indonesia Asia Pacific Electric Vehicle Battery Materials Market Revenue Share (%), by Country 2025 & 2033
- Figure 130: Indonesia Asia Pacific Electric Vehicle Battery Materials Market Volume Share (%), by Country 2025 & 2033
- Figure 131: Vietnam Asia Pacific Electric Vehicle Battery Materials Market Revenue (Million), by Battery Type 2025 & 2033
- Figure 132: Vietnam Asia Pacific Electric Vehicle Battery Materials Market Volume (Billion), by Battery Type 2025 & 2033
- Figure 133: Vietnam Asia Pacific Electric Vehicle Battery Materials Market Revenue Share (%), by Battery Type 2025 & 2033
- Figure 134: Vietnam Asia Pacific Electric Vehicle Battery Materials Market Volume Share (%), by Battery Type 2025 & 2033
- Figure 135: Vietnam Asia Pacific Electric Vehicle Battery Materials Market Revenue (Million), by Material 2025 & 2033
- Figure 136: Vietnam Asia Pacific Electric Vehicle Battery Materials Market Volume (Billion), by Material 2025 & 2033
- Figure 137: Vietnam Asia Pacific Electric Vehicle Battery Materials Market Revenue Share (%), by Material 2025 & 2033
- Figure 138: Vietnam Asia Pacific Electric Vehicle Battery Materials Market Volume Share (%), by Material 2025 & 2033
- Figure 139: Vietnam Asia Pacific Electric Vehicle Battery Materials Market Revenue (Million), by Geography 2025 & 2033
- Figure 140: Vietnam Asia Pacific Electric Vehicle Battery Materials Market Volume (Billion), by Geography 2025 & 2033
- Figure 141: Vietnam Asia Pacific Electric Vehicle Battery Materials Market Revenue Share (%), by Geography 2025 & 2033
- Figure 142: Vietnam Asia Pacific Electric Vehicle Battery Materials Market Volume Share (%), by Geography 2025 & 2033
- Figure 143: Vietnam Asia Pacific Electric Vehicle Battery Materials Market Revenue (Million), by Country 2025 & 2033
- Figure 144: Vietnam Asia Pacific Electric Vehicle Battery Materials Market Volume (Billion), by Country 2025 & 2033
- Figure 145: Vietnam Asia Pacific Electric Vehicle Battery Materials Market Revenue Share (%), by Country 2025 & 2033
- Figure 146: Vietnam Asia Pacific Electric Vehicle Battery Materials Market Volume Share (%), by Country 2025 & 2033
- Figure 147: Rest of Asia Pacific Asia Pacific Electric Vehicle Battery Materials Market Revenue (Million), by Battery Type 2025 & 2033
- Figure 148: Rest of Asia Pacific Asia Pacific Electric Vehicle Battery Materials Market Volume (Billion), by Battery Type 2025 & 2033
- Figure 149: Rest of Asia Pacific Asia Pacific Electric Vehicle Battery Materials Market Revenue Share (%), by Battery Type 2025 & 2033
- Figure 150: Rest of Asia Pacific Asia Pacific Electric Vehicle Battery Materials Market Volume Share (%), by Battery Type 2025 & 2033
- Figure 151: Rest of Asia Pacific Asia Pacific Electric Vehicle Battery Materials Market Revenue (Million), by Material 2025 & 2033
- Figure 152: Rest of Asia Pacific Asia Pacific Electric Vehicle Battery Materials Market Volume (Billion), by Material 2025 & 2033
- Figure 153: Rest of Asia Pacific Asia Pacific Electric Vehicle Battery Materials Market Revenue Share (%), by Material 2025 & 2033
- Figure 154: Rest of Asia Pacific Asia Pacific Electric Vehicle Battery Materials Market Volume Share (%), by Material 2025 & 2033
- Figure 155: Rest of Asia Pacific Asia Pacific Electric Vehicle Battery Materials Market Revenue (Million), by Geography 2025 & 2033
- Figure 156: Rest of Asia Pacific Asia Pacific Electric Vehicle Battery Materials Market Volume (Billion), by Geography 2025 & 2033
- Figure 157: Rest of Asia Pacific Asia Pacific Electric Vehicle Battery Materials Market Revenue Share (%), by Geography 2025 & 2033
- Figure 158: Rest of Asia Pacific Asia Pacific Electric Vehicle Battery Materials Market Volume Share (%), by Geography 2025 & 2033
- Figure 159: Rest of Asia Pacific Asia Pacific Electric Vehicle Battery Materials Market Revenue (Million), by Country 2025 & 2033
- Figure 160: Rest of Asia Pacific Asia Pacific Electric Vehicle Battery Materials Market Volume (Billion), by Country 2025 & 2033
- Figure 161: Rest of Asia Pacific Asia Pacific Electric Vehicle Battery Materials Market Revenue Share (%), by Country 2025 & 2033
- Figure 162: Rest of Asia Pacific Asia Pacific Electric Vehicle Battery Materials Market Volume Share (%), by Country 2025 & 2033
List of Tables
- Table 1: Global Asia Pacific Electric Vehicle Battery Materials Market Revenue Million Forecast, by Battery Type 2020 & 2033
- Table 2: Global Asia Pacific Electric Vehicle Battery Materials Market Volume Billion Forecast, by Battery Type 2020 & 2033
- Table 3: Global Asia Pacific Electric Vehicle Battery Materials Market Revenue Million Forecast, by Material 2020 & 2033
- Table 4: Global Asia Pacific Electric Vehicle Battery Materials Market Volume Billion Forecast, by Material 2020 & 2033
- Table 5: Global Asia Pacific Electric Vehicle Battery Materials Market Revenue Million Forecast, by Geography 2020 & 2033
- Table 6: Global Asia Pacific Electric Vehicle Battery Materials Market Volume Billion Forecast, by Geography 2020 & 2033
- Table 7: Global Asia Pacific Electric Vehicle Battery Materials Market Revenue Million Forecast, by Region 2020 & 2033
- Table 8: Global Asia Pacific Electric Vehicle Battery Materials Market Volume Billion Forecast, by Region 2020 & 2033
- Table 9: Global Asia Pacific Electric Vehicle Battery Materials Market Revenue Million Forecast, by Battery Type 2020 & 2033
- Table 10: Global Asia Pacific Electric Vehicle Battery Materials Market Volume Billion Forecast, by Battery Type 2020 & 2033
- Table 11: Global Asia Pacific Electric Vehicle Battery Materials Market Revenue Million Forecast, by Material 2020 & 2033
- Table 12: Global Asia Pacific Electric Vehicle Battery Materials Market Volume Billion Forecast, by Material 2020 & 2033
- Table 13: Global Asia Pacific Electric Vehicle Battery Materials Market Revenue Million Forecast, by Geography 2020 & 2033
- Table 14: Global Asia Pacific Electric Vehicle Battery Materials Market Volume Billion Forecast, by Geography 2020 & 2033
- Table 15: Global Asia Pacific Electric Vehicle Battery Materials Market Revenue Million Forecast, by Country 2020 & 2033
- Table 16: Global Asia Pacific Electric Vehicle Battery Materials Market Volume Billion Forecast, by Country 2020 & 2033
- Table 17: Global Asia Pacific Electric Vehicle Battery Materials Market Revenue Million Forecast, by Battery Type 2020 & 2033
- Table 18: Global Asia Pacific Electric Vehicle Battery Materials Market Volume Billion Forecast, by Battery Type 2020 & 2033
- Table 19: Global Asia Pacific Electric Vehicle Battery Materials Market Revenue Million Forecast, by Material 2020 & 2033
- Table 20: Global Asia Pacific Electric Vehicle Battery Materials Market Volume Billion Forecast, by Material 2020 & 2033
- Table 21: Global Asia Pacific Electric Vehicle Battery Materials Market Revenue Million Forecast, by Geography 2020 & 2033
- Table 22: Global Asia Pacific Electric Vehicle Battery Materials Market Volume Billion Forecast, by Geography 2020 & 2033
- Table 23: Global Asia Pacific Electric Vehicle Battery Materials Market Revenue Million Forecast, by Country 2020 & 2033
- Table 24: Global Asia Pacific Electric Vehicle Battery Materials Market Volume Billion Forecast, by Country 2020 & 2033
- Table 25: Global Asia Pacific Electric Vehicle Battery Materials Market Revenue Million Forecast, by Battery Type 2020 & 2033
- Table 26: Global Asia Pacific Electric Vehicle Battery Materials Market Volume Billion Forecast, by Battery Type 2020 & 2033
- Table 27: Global Asia Pacific Electric Vehicle Battery Materials Market Revenue Million Forecast, by Material 2020 & 2033
- Table 28: Global Asia Pacific Electric Vehicle Battery Materials Market Volume Billion Forecast, by Material 2020 & 2033
- Table 29: Global Asia Pacific Electric Vehicle Battery Materials Market Revenue Million Forecast, by Geography 2020 & 2033
- Table 30: Global Asia Pacific Electric Vehicle Battery Materials Market Volume Billion Forecast, by Geography 2020 & 2033
- Table 31: Global Asia Pacific Electric Vehicle Battery Materials Market Revenue Million Forecast, by Country 2020 & 2033
- Table 32: Global Asia Pacific Electric Vehicle Battery Materials Market Volume Billion Forecast, by Country 2020 & 2033
- Table 33: Global Asia Pacific Electric Vehicle Battery Materials Market Revenue Million Forecast, by Battery Type 2020 & 2033
- Table 34: Global Asia Pacific Electric Vehicle Battery Materials Market Volume Billion Forecast, by Battery Type 2020 & 2033
- Table 35: Global Asia Pacific Electric Vehicle Battery Materials Market Revenue Million Forecast, by Material 2020 & 2033
- Table 36: Global Asia Pacific Electric Vehicle Battery Materials Market Volume Billion Forecast, by Material 2020 & 2033
- Table 37: Global Asia Pacific Electric Vehicle Battery Materials Market Revenue Million Forecast, by Geography 2020 & 2033
- Table 38: Global Asia Pacific Electric Vehicle Battery Materials Market Volume Billion Forecast, by Geography 2020 & 2033
- Table 39: Global Asia Pacific Electric Vehicle Battery Materials Market Revenue Million Forecast, by Country 2020 & 2033
- Table 40: Global Asia Pacific Electric Vehicle Battery Materials Market Volume Billion Forecast, by Country 2020 & 2033
- Table 41: Global Asia Pacific Electric Vehicle Battery Materials Market Revenue Million Forecast, by Battery Type 2020 & 2033
- Table 42: Global Asia Pacific Electric Vehicle Battery Materials Market Volume Billion Forecast, by Battery Type 2020 & 2033
- Table 43: Global Asia Pacific Electric Vehicle Battery Materials Market Revenue Million Forecast, by Material 2020 & 2033
- Table 44: Global Asia Pacific Electric Vehicle Battery Materials Market Volume Billion Forecast, by Material 2020 & 2033
- Table 45: Global Asia Pacific Electric Vehicle Battery Materials Market Revenue Million Forecast, by Geography 2020 & 2033
- Table 46: Global Asia Pacific Electric Vehicle Battery Materials Market Volume Billion Forecast, by Geography 2020 & 2033
- Table 47: Global Asia Pacific Electric Vehicle Battery Materials Market Revenue Million Forecast, by Country 2020 & 2033
- Table 48: Global Asia Pacific Electric Vehicle Battery Materials Market Volume Billion Forecast, by Country 2020 & 2033
- Table 49: Global Asia Pacific Electric Vehicle Battery Materials Market Revenue Million Forecast, by Battery Type 2020 & 2033
- Table 50: Global Asia Pacific Electric Vehicle Battery Materials Market Volume Billion Forecast, by Battery Type 2020 & 2033
- Table 51: Global Asia Pacific Electric Vehicle Battery Materials Market Revenue Million Forecast, by Material 2020 & 2033
- Table 52: Global Asia Pacific Electric Vehicle Battery Materials Market Volume Billion Forecast, by Material 2020 & 2033
- Table 53: Global Asia Pacific Electric Vehicle Battery Materials Market Revenue Million Forecast, by Geography 2020 & 2033
- Table 54: Global Asia Pacific Electric Vehicle Battery Materials Market Volume Billion Forecast, by Geography 2020 & 2033
- Table 55: Global Asia Pacific Electric Vehicle Battery Materials Market Revenue Million Forecast, by Country 2020 & 2033
- Table 56: Global Asia Pacific Electric Vehicle Battery Materials Market Volume Billion Forecast, by Country 2020 & 2033
- Table 57: Global Asia Pacific Electric Vehicle Battery Materials Market Revenue Million Forecast, by Battery Type 2020 & 2033
- Table 58: Global Asia Pacific Electric Vehicle Battery Materials Market Volume Billion Forecast, by Battery Type 2020 & 2033
- Table 59: Global Asia Pacific Electric Vehicle Battery Materials Market Revenue Million Forecast, by Material 2020 & 2033
- Table 60: Global Asia Pacific Electric Vehicle Battery Materials Market Volume Billion Forecast, by Material 2020 & 2033
- Table 61: Global Asia Pacific Electric Vehicle Battery Materials Market Revenue Million Forecast, by Geography 2020 & 2033
- Table 62: Global Asia Pacific Electric Vehicle Battery Materials Market Volume Billion Forecast, by Geography 2020 & 2033
- Table 63: Global Asia Pacific Electric Vehicle Battery Materials Market Revenue Million Forecast, by Country 2020 & 2033
- Table 64: Global Asia Pacific Electric Vehicle Battery Materials Market Volume Billion Forecast, by Country 2020 & 2033
- Table 65: Global Asia Pacific Electric Vehicle Battery Materials Market Revenue Million Forecast, by Battery Type 2020 & 2033
- Table 66: Global Asia Pacific Electric Vehicle Battery Materials Market Volume Billion Forecast, by Battery Type 2020 & 2033
- Table 67: Global Asia Pacific Electric Vehicle Battery Materials Market Revenue Million Forecast, by Material 2020 & 2033
- Table 68: Global Asia Pacific Electric Vehicle Battery Materials Market Volume Billion Forecast, by Material 2020 & 2033
- Table 69: Global Asia Pacific Electric Vehicle Battery Materials Market Revenue Million Forecast, by Geography 2020 & 2033
- Table 70: Global Asia Pacific Electric Vehicle Battery Materials Market Volume Billion Forecast, by Geography 2020 & 2033
- Table 71: Global Asia Pacific Electric Vehicle Battery Materials Market Revenue Million Forecast, by Country 2020 & 2033
- Table 72: Global Asia Pacific Electric Vehicle Battery Materials Market Volume Billion Forecast, by Country 2020 & 2033
- Table 73: Global Asia Pacific Electric Vehicle Battery Materials Market Revenue Million Forecast, by Battery Type 2020 & 2033
- Table 74: Global Asia Pacific Electric Vehicle Battery Materials Market Volume Billion Forecast, by Battery Type 2020 & 2033
- Table 75: Global Asia Pacific Electric Vehicle Battery Materials Market Revenue Million Forecast, by Material 2020 & 2033
- Table 76: Global Asia Pacific Electric Vehicle Battery Materials Market Volume Billion Forecast, by Material 2020 & 2033
- Table 77: Global Asia Pacific Electric Vehicle Battery Materials Market Revenue Million Forecast, by Geography 2020 & 2033
- Table 78: Global Asia Pacific Electric Vehicle Battery Materials Market Volume Billion Forecast, by Geography 2020 & 2033
- Table 79: Global Asia Pacific Electric Vehicle Battery Materials Market Revenue Million Forecast, by Country 2020 & 2033
- Table 80: Global Asia Pacific Electric Vehicle Battery Materials Market Volume Billion Forecast, by Country 2020 & 2033
- Table 81: Global Asia Pacific Electric Vehicle Battery Materials Market Revenue Million Forecast, by Battery Type 2020 & 2033
- Table 82: Global Asia Pacific Electric Vehicle Battery Materials Market Volume Billion Forecast, by Battery Type 2020 & 2033
- Table 83: Global Asia Pacific Electric Vehicle Battery Materials Market Revenue Million Forecast, by Material 2020 & 2033
- Table 84: Global Asia Pacific Electric Vehicle Battery Materials Market Volume Billion Forecast, by Material 2020 & 2033
- Table 85: Global Asia Pacific Electric Vehicle Battery Materials Market Revenue Million Forecast, by Geography 2020 & 2033
- Table 86: Global Asia Pacific Electric Vehicle Battery Materials Market Volume Billion Forecast, by Geography 2020 & 2033
- Table 87: Global Asia Pacific Electric Vehicle Battery Materials Market Revenue Million Forecast, by Country 2020 & 2033
- Table 88: Global Asia Pacific Electric Vehicle Battery Materials Market Volume Billion Forecast, by Country 2020 & 2033
Frequently Asked Questions
1. What is the projected Compound Annual Growth Rate (CAGR) of the Asia Pacific Electric Vehicle Battery Materials Market?
The projected CAGR is approximately 13.61%.
2. Which companies are prominent players in the Asia Pacific Electric Vehicle Battery Materials Market?
Key companies in the market include Sumitomo Chemical Co Ltd, BASF SE, Mitsubishi Chemical Group Corporation, UBE Corporation, Umicore SA, Contemporary Amperex Technology Co Limited, Nichia Corporation, ENTEK International LLC, LG Chem, Kureha Corporation*List Not Exhaustive 6 4 List of Other Prominent Companies6 5 Market Ranking/ Share Analysi.
3. What are the main segments of the Asia Pacific Electric Vehicle Battery Materials Market?
The market segments include Battery Type, Material, Geography.
4. Can you provide details about the market size?
The market size is estimated to be USD 16.84 Million as of 2022.
5. What are some drivers contributing to market growth?
4.; Growing Electric Vehicle Sales4.; Supportive Government Policies and Regulations.
6. What are the notable trends driving market growth?
Lithium-Ion Battery Type Dominate the Market.
7. Are there any restraints impacting market growth?
4.; Growing Electric Vehicle Sales4.; Supportive Government Policies and Regulations.
8. Can you provide examples of recent developments in the market?
November 2023: SK On Co., an electric vehicle battery maker, and BASF SE, a battery materials producer, collaborated to develop industry-leading battery materials for lithium-ion batteries in North America and the Asia-Pacific. The companies intended to improve long-term competitiveness amid slowing growth in the eco-friendly automobile industry.June 2023: Japan created a solid-air battery that can be recharged. Researchers have shown an all-solid-state rechargeable air battery made of a proton-conductive polymer electrolyte and a redox-active organic negative electrode. These batteries function well in the vicinity of their theoretical maximum capacity.
9. What pricing options are available for accessing the report?
Pricing options include single-user, multi-user, and enterprise licenses priced at USD 4750, USD 5250, and USD 8750 respectively.
10. Is the market size provided in terms of value or volume?
The market size is provided in terms of value, measured in Million and volume, measured in Billion.
11. Are there any specific market keywords associated with the report?
Yes, the market keyword associated with the report is "Asia Pacific Electric Vehicle Battery Materials Market," which aids in identifying and referencing the specific market segment covered.
12. How do I determine which pricing option suits my needs best?
The pricing options vary based on user requirements and access needs. Individual users may opt for single-user licenses, while businesses requiring broader access may choose multi-user or enterprise licenses for cost-effective access to the report.
13. Are there any additional resources or data provided in the Asia Pacific Electric Vehicle Battery Materials Market report?
While the report offers comprehensive insights, it's advisable to review the specific contents or supplementary materials provided to ascertain if additional resources or data are available.
14. How can I stay updated on further developments or reports in the Asia Pacific Electric Vehicle Battery Materials Market?
To stay informed about further developments, trends, and reports in the Asia Pacific Electric Vehicle Battery Materials Market, consider subscribing to industry newsletters, following relevant companies and organizations, or regularly checking reputable industry news sources and publications.
Methodology
Step 1 - Identification of Relevant Samples Size from Population Database


Step 2 - Approaches for Defining Global Market Size (Value, Volume* & Price*)

Note*: In applicable scenarios
Step 3 - Data Sources
Primary Research
- Web Analytics
- Survey Reports
- Research Institute
- Latest Research Reports
- Opinion Leaders
Secondary Research
- Annual Reports
- White Paper
- Latest Press Release
- Industry Association
- Paid Database
- Investor Presentations

Step 4 - Data Triangulation
Involves using different sources of information in order to increase the validity of a study
These sources are likely to be stakeholders in a program - participants, other researchers, program staff, other community members, and so on.
Then we put all data in single framework & apply various statistical tools to find out the dynamic on the market.
During the analysis stage, feedback from the stakeholder groups would be compared to determine areas of agreement as well as areas of divergence