
Key Insights
The Asia-Pacific cancer biomarkers market is experiencing robust growth, driven by rising cancer incidence rates across the region, particularly in countries like China, India, and Japan. The market's Compound Annual Growth Rate (CAGR) of 12.50% from 2019-2033 signifies a substantial expansion, projecting significant market value by 2033. This growth is fueled by several key factors: increasing awareness and early detection initiatives, technological advancements in biomarker profiling technologies (such as OMICS and advanced imaging), and growing adoption of personalized medicine approaches in cancer treatment. The significant market segments include prostate, breast, lung, and colorectal cancers, with protein and genetic biomarkers playing a crucial role in diagnosis and treatment monitoring. While the market faces certain restraints like high testing costs and regulatory hurdles, the overall positive trajectory is largely due to increased investments in research and development, collaborations between pharmaceutical companies and diagnostic players, and the growing penetration of advanced healthcare infrastructure in major APAC economies.
Technological innovation continues to shape the market landscape. The widespread adoption of OMICS technologies, including genomics and proteomics, offers more precise and efficient biomarker profiling. This, coupled with the development of more sophisticated imaging technologies and immunoassays, allows for earlier and more accurate cancer detection, leading to improved treatment outcomes and patient survival rates. The increasing prevalence of chronic diseases, coupled with an aging population, further contributes to the market's growth. The diverse segment landscape presents significant opportunities for market players, with companies focusing on developing innovative biomarkers for early detection and personalized cancer therapies to maintain a competitive edge. Expansion into less-developed regions within Asia-Pacific also presents a significant avenue for future growth.
Asia-Pacific Cancer Biomarkers Industry Market Report: 2019-2033
This comprehensive report provides an in-depth analysis of the Asia-Pacific cancer biomarkers market, encompassing market dynamics, growth trends, dominant segments, product landscape, key players, and future outlook. The study period covers 2019-2033, with 2025 as the base and estimated year. The report is invaluable for industry professionals, investors, and researchers seeking to understand and capitalize on opportunities within this rapidly evolving sector. The market is segmented by cancer type (Prostate, Breast, Lung, Colorectal, Cervical, Other), biomarker type (Protein, Genetic, Other), and profiling technology (OMICS, Imaging, Immunoassays, Cytogenetics).
Asia-Pacific Cancer Biomarkers Industry Market Dynamics & Structure
The Asia-Pacific cancer biomarkers market is characterized by a moderately concentrated structure, with key players holding significant market share. The market size in 2025 is estimated at XXX Million. Technological innovation, particularly in OMICS technologies and advanced imaging, is a major growth driver. Stringent regulatory frameworks influence product development and approval timelines. Competitive pressures arise from the availability of substitute diagnostic methods and the emergence of innovative technologies. The market is also influenced by evolving end-user demographics (aging population, rising cancer incidence) and an active M&A landscape.
- Market Concentration: The top 5 players account for approximately XX% of the market share in 2025.
- Technological Innovation: Significant investments in R&D are driving advancements in biomarker discovery and profiling technologies.
- Regulatory Landscape: Stringent regulatory approvals processes in countries like Japan, Australia, and Singapore influence market entry and product development strategies.
- Competitive Substitutes: Traditional diagnostic methods and emerging alternative technologies present competitive challenges.
- End-User Demographics: The aging population and rising cancer incidence across the Asia-Pacific region are key drivers of market growth.
- M&A Activity: A moderate level of M&A activity is observed, with XX deals recorded between 2019 and 2024.
Asia-Pacific Cancer Biomarkers Industry Growth Trends & Insights
The Asia-Pacific cancer biomarkers market experienced significant growth during the historical period (2019-2024), exhibiting a CAGR of XX%. This growth is projected to continue during the forecast period (2025-2033), with a projected CAGR of YY%. Market expansion is driven by increasing awareness of early cancer detection, technological advancements leading to more sensitive and specific biomarkers, and rising healthcare expenditure. The adoption rate of biomarker testing is steadily increasing, particularly in developed economies within the region. Technological disruptions, such as the integration of AI and machine learning in biomarker analysis, are further accelerating market growth. Consumer behavior is shifting towards personalized medicine, fueling demand for targeted therapies guided by biomarker information. Market penetration for specific biomarker tests varies across different cancer types and countries, with higher penetration observed in developed economies.
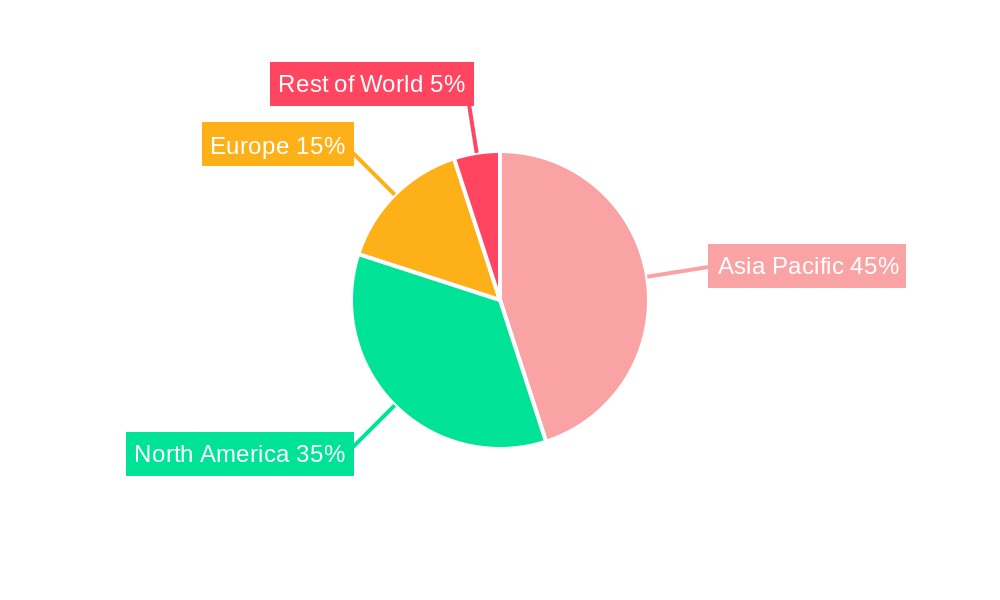
Dominant Regions, Countries, or Segments in Asia-Pacific Cancer Biomarkers Industry
Japan, Australia, and South Korea are currently the dominant markets within the Asia-Pacific region, exhibiting the highest market share and growth potential. Among cancer types, breast cancer and lung cancer currently drive significant demand for biomarkers. Protein biomarkers represent the largest segment by biomarker type, driven by established technologies and wide applications. OMICS technologies dominate the profiling technology segment due to their comprehensive nature.
- Key Drivers in Dominant Regions:
- Japan: Strong healthcare infrastructure, high healthcare expenditure, and advanced technological capabilities.
- Australia: Well-established research ecosystem, supportive government policies, and early adoption of new technologies.
- South Korea: Rapid technological advancements, increasing healthcare investment, and growing awareness about cancer biomarkers.
- Dominant Segments:
- Cancer Type: Breast Cancer and Lung Cancer due to high prevalence and research focus.
- Biomarker Type: Protein Biomarkers due to established testing methodologies.
- Profiling Technology: OMICS Technologies due to comprehensive data generation capabilities.
Asia-Pacific Cancer Biomarkers Industry Product Landscape
The Asia-Pacific cancer biomarkers market offers a diverse range of products, including assays, kits, and software for biomarker detection and analysis. These products vary in their sensitivity, specificity, and ease of use. Recent innovations focus on multiplexing capabilities, improved accuracy, and faster turnaround times. Key selling propositions include reduced cost, enhanced sensitivity, and ease of integration with existing clinical workflows. Technological advancements, including microfluidics and nanotechnology, are continuously improving the performance and capabilities of biomarker products.
Key Drivers, Barriers & Challenges in Asia-Pacific Cancer Biomarkers Industry
Key Drivers:
- Increasing prevalence of cancer.
- Growing demand for early and accurate diagnosis.
- Technological advancements in biomarker discovery and detection.
- Increasing healthcare expenditure.
- Government initiatives promoting cancer research and early detection.
Challenges and Restraints:
- High cost of biomarker testing can limit accessibility in certain regions.
- Regulatory hurdles and lengthy approval processes.
- Lack of skilled professionals and infrastructure in some developing countries.
- Ethical concerns related to data privacy and genetic information.
- Intense competition among various established and emerging players.
Emerging Opportunities in Asia-Pacific Cancer Biomarkers Industry
- Expansion into untapped markets within the Asia-Pacific region, focusing on developing economies.
- Development of novel biomarkers for early detection of prevalent cancers in the region.
- Increasing focus on personalized medicine and targeted therapies guided by biomarkers.
- Integration of AI and machine learning for improved biomarker analysis and interpretation.
- Strategic partnerships between research institutions and commercial entities for faster product development and market penetration.
Growth Accelerators in the Asia-Pacific Cancer Biomarkers Industry
The long-term growth of the Asia-Pacific cancer biomarkers market is significantly influenced by technological advancements, particularly in next-generation sequencing (NGS) and liquid biopsy techniques. Strategic partnerships between pharmaceutical companies and diagnostic providers further drive market expansion. The increasing prevalence of cancer, combined with growing government support for healthcare infrastructure development, particularly in emerging economies, will further stimulate growth.
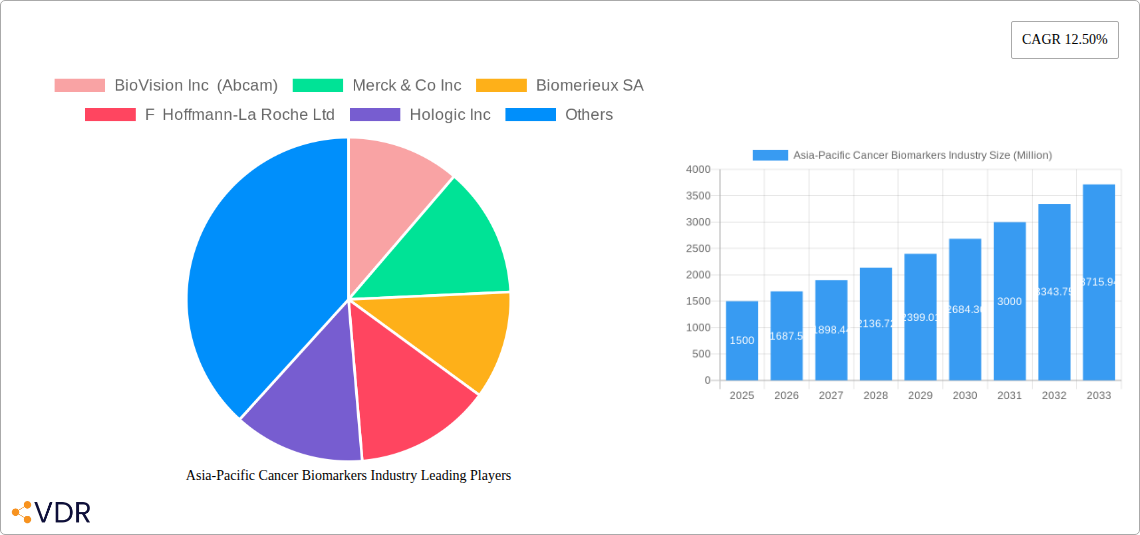
Key Players Shaping the Asia-Pacific Cancer Biomarkers Industry Market
- BioVision Inc (Abcam)
- Merck & Co Inc
- Biomerieux SA
- F Hoffmann-La Roche Ltd
- Hologic Inc
- Celera Corporation (Quest Diagnostics)
- ASURAGEN INC
- Qiagen NV
- Illumina Inc
- Abbott Laboratories Inc
- Thermo Fisher Scientific
- Agilent Technologies
Notable Milestones in Asia-Pacific Cancer Biomarkers Industry Sector
- February 2022: The University of South Australia used novel biomarkers to decode metastatic breast cancer, identifying a connection between aggressive breast cancer cells and dual CXCR4-CCR7 cell surface protein complexes. This discovery could lead to improved treatment strategies.
- October 2022: The Garvan Institute of Medical Research in Australia discovered a new biomarker for prostate cancer, potentially improving diagnosis and treatment for aggressive forms of the disease. This advancement highlights the ongoing innovation in biomarker research within the region.
In-Depth Asia-Pacific Cancer Biomarkers Industry Market Outlook
The Asia-Pacific cancer biomarkers market is poised for substantial growth in the coming years. Continued technological innovation, coupled with increasing healthcare investment and expanding awareness of early cancer detection, will fuel market expansion. Strategic partnerships, collaborations, and investments in research and development will further propel the market's growth trajectory. Opportunities exist for companies to develop novel biomarkers, improve testing methodologies, and expand access to diagnostic solutions across the diverse regions of Asia-Pacific. The focus on personalized medicine will continue to drive the demand for accurate and efficient biomarker testing.
Asia-Pacific Cancer Biomarkers Industry Segmentation
-
1. Cancer Type
- 1.1. Prostate Cancer
- 1.2. Breast Cancer
- 1.3. Lung Cancer
- 1.4. Colorectal Cancer
- 1.5. Cervical Cancer
- 1.6. Other Cancer Type
-
2. Type of Biomarker
- 2.1. Protein Biomarkers
- 2.2. Genetic Biomarkers
- 2.3. Other Types of Biomarkers
-
3. Profiling Technology
- 3.1. OMICS Technologies
- 3.2. Imaging Technologies
- 3.3. Immunoassays
- 3.4. Cytogenetics
-
4. Geography
- 4.1. China
- 4.2. Japan
- 4.3. India
- 4.4. Australia
- 4.5. South Korea
- 4.6. Rest of Asia-Pacific
Asia-Pacific Cancer Biomarkers Industry Segmentation By Geography
- 1. China
- 2. Japan
- 3. India
- 4. Australia
- 5. South Korea
- 6. Rest of Asia Pacific
Asia-Pacific Cancer Biomarkers Industry REPORT HIGHLIGHTS
| Aspects | Details |
|---|---|
| Study Period | 2019-2033 |
| Base Year | 2024 |
| Estimated Year | 2025 |
| Forecast Period | 2025-2033 |
| Historical Period | 2019-2024 |
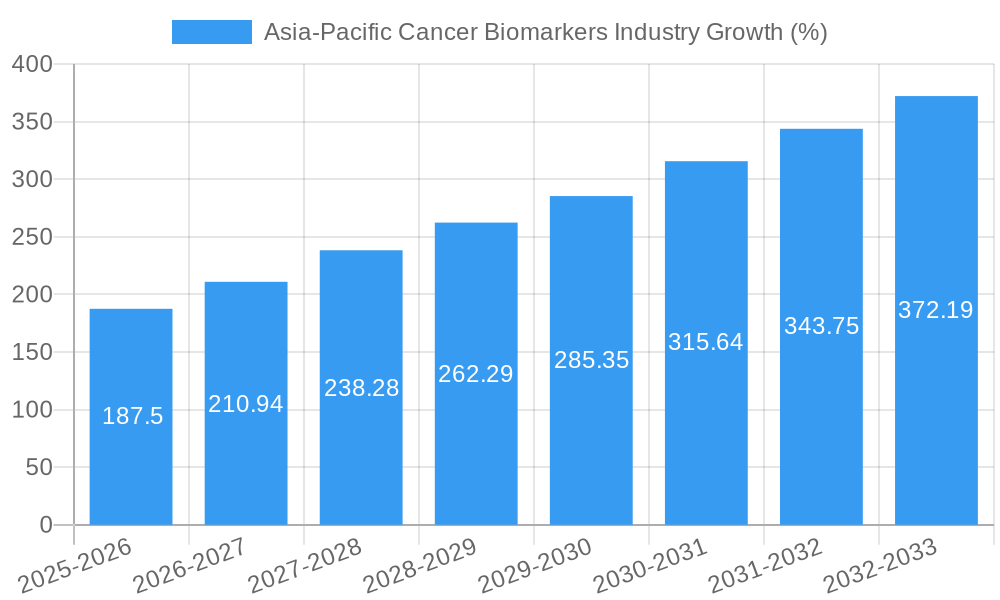
| Growth Rate | CAGR of 12.50% from 2019-2033 |
| Segmentation |
|
Table of Contents
- 1. Introduction
- 1.1. Research Scope
- 1.2. Market Segmentation
- 1.3. Research Methodology
- 1.4. Definitions and Assumptions
- 2. Executive Summary
- 2.1. Introduction
- 3. Market Dynamics
- 3.1. Introduction
- 3.2. Market Drivers
- 3.2.1. Rising Prevalence of Cancer; Increasing Research Activities and Growing Usage of Biomarkers in Drug Development
- 3.3. Market Restrains
- 3.3.1. High Cost of Diagnosis; Reimbursement Issues
- 3.4. Market Trends
- 3.4.1. Breast Cancer is Expected to Grow with a Significant CAGR in the Market Over the Forecast Period
- 4. Market Factor Analysis
- 4.1. Porters Five Forces
- 4.2. Supply/Value Chain
- 4.3. PESTEL analysis
- 4.4. Market Entropy
- 4.5. Patent/Trademark Analysis
- 5. Asia-Pacific Cancer Biomarkers Industry Analysis, Insights and Forecast, 2019-2031
- 5.1. Market Analysis, Insights and Forecast - by Cancer Type
- 5.1.1. Prostate Cancer
- 5.1.2. Breast Cancer
- 5.1.3. Lung Cancer
- 5.1.4. Colorectal Cancer
- 5.1.5. Cervical Cancer
- 5.1.6. Other Cancer Type
- 5.2. Market Analysis, Insights and Forecast - by Type of Biomarker
- 5.2.1. Protein Biomarkers
- 5.2.2. Genetic Biomarkers
- 5.2.3. Other Types of Biomarkers
- 5.3. Market Analysis, Insights and Forecast - by Profiling Technology
- 5.3.1. OMICS Technologies
- 5.3.2. Imaging Technologies
- 5.3.3. Immunoassays
- 5.3.4. Cytogenetics
- 5.4. Market Analysis, Insights and Forecast - by Geography
- 5.4.1. China
- 5.4.2. Japan
- 5.4.3. India
- 5.4.4. Australia
- 5.4.5. South Korea
- 5.4.6. Rest of Asia-Pacific
- 5.5. Market Analysis, Insights and Forecast - by Region
- 5.5.1. China
- 5.5.2. Japan
- 5.5.3. India
- 5.5.4. Australia
- 5.5.5. South Korea
- 5.5.6. Rest of Asia Pacific
- 5.1. Market Analysis, Insights and Forecast - by Cancer Type
- 6. China Asia-Pacific Cancer Biomarkers Industry Analysis, Insights and Forecast, 2019-2031
- 6.1. Market Analysis, Insights and Forecast - by Cancer Type
- 6.1.1. Prostate Cancer
- 6.1.2. Breast Cancer
- 6.1.3. Lung Cancer
- 6.1.4. Colorectal Cancer
- 6.1.5. Cervical Cancer
- 6.1.6. Other Cancer Type
- 6.2. Market Analysis, Insights and Forecast - by Type of Biomarker
- 6.2.1. Protein Biomarkers
- 6.2.2. Genetic Biomarkers
- 6.2.3. Other Types of Biomarkers
- 6.3. Market Analysis, Insights and Forecast - by Profiling Technology
- 6.3.1. OMICS Technologies
- 6.3.2. Imaging Technologies
- 6.3.3. Immunoassays
- 6.3.4. Cytogenetics
- 6.4. Market Analysis, Insights and Forecast - by Geography
- 6.4.1. China
- 6.4.2. Japan
- 6.4.3. India
- 6.4.4. Australia
- 6.4.5. South Korea
- 6.4.6. Rest of Asia-Pacific
- 6.1. Market Analysis, Insights and Forecast - by Cancer Type
- 7. Japan Asia-Pacific Cancer Biomarkers Industry Analysis, Insights and Forecast, 2019-2031
- 7.1. Market Analysis, Insights and Forecast - by Cancer Type
- 7.1.1. Prostate Cancer
- 7.1.2. Breast Cancer
- 7.1.3. Lung Cancer
- 7.1.4. Colorectal Cancer
- 7.1.5. Cervical Cancer
- 7.1.6. Other Cancer Type
- 7.2. Market Analysis, Insights and Forecast - by Type of Biomarker
- 7.2.1. Protein Biomarkers
- 7.2.2. Genetic Biomarkers
- 7.2.3. Other Types of Biomarkers
- 7.3. Market Analysis, Insights and Forecast - by Profiling Technology
- 7.3.1. OMICS Technologies
- 7.3.2. Imaging Technologies
- 7.3.3. Immunoassays
- 7.3.4. Cytogenetics
- 7.4. Market Analysis, Insights and Forecast - by Geography
- 7.4.1. China
- 7.4.2. Japan
- 7.4.3. India
- 7.4.4. Australia
- 7.4.5. South Korea
- 7.4.6. Rest of Asia-Pacific
- 7.1. Market Analysis, Insights and Forecast - by Cancer Type
- 8. India Asia-Pacific Cancer Biomarkers Industry Analysis, Insights and Forecast, 2019-2031
- 8.1. Market Analysis, Insights and Forecast - by Cancer Type
- 8.1.1. Prostate Cancer
- 8.1.2. Breast Cancer
- 8.1.3. Lung Cancer
- 8.1.4. Colorectal Cancer
- 8.1.5. Cervical Cancer
- 8.1.6. Other Cancer Type
- 8.2. Market Analysis, Insights and Forecast - by Type of Biomarker
- 8.2.1. Protein Biomarkers
- 8.2.2. Genetic Biomarkers
- 8.2.3. Other Types of Biomarkers
- 8.3. Market Analysis, Insights and Forecast - by Profiling Technology
- 8.3.1. OMICS Technologies
- 8.3.2. Imaging Technologies
- 8.3.3. Immunoassays
- 8.3.4. Cytogenetics
- 8.4. Market Analysis, Insights and Forecast - by Geography
- 8.4.1. China
- 8.4.2. Japan
- 8.4.3. India
- 8.4.4. Australia
- 8.4.5. South Korea
- 8.4.6. Rest of Asia-Pacific
- 8.1. Market Analysis, Insights and Forecast - by Cancer Type
- 9. Australia Asia-Pacific Cancer Biomarkers Industry Analysis, Insights and Forecast, 2019-2031
- 9.1. Market Analysis, Insights and Forecast - by Cancer Type
- 9.1.1. Prostate Cancer
- 9.1.2. Breast Cancer
- 9.1.3. Lung Cancer
- 9.1.4. Colorectal Cancer
- 9.1.5. Cervical Cancer
- 9.1.6. Other Cancer Type
- 9.2. Market Analysis, Insights and Forecast - by Type of Biomarker
- 9.2.1. Protein Biomarkers
- 9.2.2. Genetic Biomarkers
- 9.2.3. Other Types of Biomarkers
- 9.3. Market Analysis, Insights and Forecast - by Profiling Technology
- 9.3.1. OMICS Technologies
- 9.3.2. Imaging Technologies
- 9.3.3. Immunoassays
- 9.3.4. Cytogenetics
- 9.4. Market Analysis, Insights and Forecast - by Geography
- 9.4.1. China
- 9.4.2. Japan
- 9.4.3. India
- 9.4.4. Australia
- 9.4.5. South Korea
- 9.4.6. Rest of Asia-Pacific
- 9.1. Market Analysis, Insights and Forecast - by Cancer Type
- 10. South Korea Asia-Pacific Cancer Biomarkers Industry Analysis, Insights and Forecast, 2019-2031
- 10.1. Market Analysis, Insights and Forecast - by Cancer Type
- 10.1.1. Prostate Cancer
- 10.1.2. Breast Cancer
- 10.1.3. Lung Cancer
- 10.1.4. Colorectal Cancer
- 10.1.5. Cervical Cancer
- 10.1.6. Other Cancer Type
- 10.2. Market Analysis, Insights and Forecast - by Type of Biomarker
- 10.2.1. Protein Biomarkers
- 10.2.2. Genetic Biomarkers
- 10.2.3. Other Types of Biomarkers
- 10.3. Market Analysis, Insights and Forecast - by Profiling Technology
- 10.3.1. OMICS Technologies
- 10.3.2. Imaging Technologies
- 10.3.3. Immunoassays
- 10.3.4. Cytogenetics
- 10.4. Market Analysis, Insights and Forecast - by Geography
- 10.4.1. China
- 10.4.2. Japan
- 10.4.3. India
- 10.4.4. Australia
- 10.4.5. South Korea
- 10.4.6. Rest of Asia-Pacific
- 10.1. Market Analysis, Insights and Forecast - by Cancer Type
- 11. Rest of Asia Pacific Asia-Pacific Cancer Biomarkers Industry Analysis, Insights and Forecast, 2019-2031
- 11.1. Market Analysis, Insights and Forecast - by Cancer Type
- 11.1.1. Prostate Cancer
- 11.1.2. Breast Cancer
- 11.1.3. Lung Cancer
- 11.1.4. Colorectal Cancer
- 11.1.5. Cervical Cancer
- 11.1.6. Other Cancer Type
- 11.2. Market Analysis, Insights and Forecast - by Type of Biomarker
- 11.2.1. Protein Biomarkers
- 11.2.2. Genetic Biomarkers
- 11.2.3. Other Types of Biomarkers
- 11.3. Market Analysis, Insights and Forecast - by Profiling Technology
- 11.3.1. OMICS Technologies
- 11.3.2. Imaging Technologies
- 11.3.3. Immunoassays
- 11.3.4. Cytogenetics
- 11.4. Market Analysis, Insights and Forecast - by Geography
- 11.4.1. China
- 11.4.2. Japan
- 11.4.3. India
- 11.4.4. Australia
- 11.4.5. South Korea
- 11.4.6. Rest of Asia-Pacific
- 11.1. Market Analysis, Insights and Forecast - by Cancer Type
- 12. China Asia-Pacific Cancer Biomarkers Industry Analysis, Insights and Forecast, 2019-2031
- 13. Japan Asia-Pacific Cancer Biomarkers Industry Analysis, Insights and Forecast, 2019-2031
- 14. India Asia-Pacific Cancer Biomarkers Industry Analysis, Insights and Forecast, 2019-2031
- 15. South Korea Asia-Pacific Cancer Biomarkers Industry Analysis, Insights and Forecast, 2019-2031
- 16. Taiwan Asia-Pacific Cancer Biomarkers Industry Analysis, Insights and Forecast, 2019-2031
- 17. Australia Asia-Pacific Cancer Biomarkers Industry Analysis, Insights and Forecast, 2019-2031
- 18. Rest of Asia-Pacific Asia-Pacific Cancer Biomarkers Industry Analysis, Insights and Forecast, 2019-2031
- 19. Competitive Analysis
- 19.1. Market Share Analysis 2024
- 19.2. Company Profiles
- 19.2.1 BioVision Inc (Abcam)
- 19.2.1.1. Overview
- 19.2.1.2. Products
- 19.2.1.3. SWOT Analysis
- 19.2.1.4. Recent Developments
- 19.2.1.5. Financials (Based on Availability)
- 19.2.2 Merck & Co Inc
- 19.2.2.1. Overview
- 19.2.2.2. Products
- 19.2.2.3. SWOT Analysis
- 19.2.2.4. Recent Developments
- 19.2.2.5. Financials (Based on Availability)
- 19.2.3 Biomerieux SA
- 19.2.3.1. Overview
- 19.2.3.2. Products
- 19.2.3.3. SWOT Analysis
- 19.2.3.4. Recent Developments
- 19.2.3.5. Financials (Based on Availability)
- 19.2.4 F Hoffmann-La Roche Ltd
- 19.2.4.1. Overview
- 19.2.4.2. Products
- 19.2.4.3. SWOT Analysis
- 19.2.4.4. Recent Developments
- 19.2.4.5. Financials (Based on Availability)
- 19.2.5 Hologic Inc
- 19.2.5.1. Overview
- 19.2.5.2. Products
- 19.2.5.3. SWOT Analysis
- 19.2.5.4. Recent Developments
- 19.2.5.5. Financials (Based on Availability)
- 19.2.6 Celera Corporation (Quest Diagnostics)
- 19.2.6.1. Overview
- 19.2.6.2. Products
- 19.2.6.3. SWOT Analysis
- 19.2.6.4. Recent Developments
- 19.2.6.5. Financials (Based on Availability)
- 19.2.7 ASURAGEN INC
- 19.2.7.1. Overview
- 19.2.7.2. Products
- 19.2.7.3. SWOT Analysis
- 19.2.7.4. Recent Developments
- 19.2.7.5. Financials (Based on Availability)
- 19.2.8 Qiagen NV
- 19.2.8.1. Overview
- 19.2.8.2. Products
- 19.2.8.3. SWOT Analysis
- 19.2.8.4. Recent Developments
- 19.2.8.5. Financials (Based on Availability)
- 19.2.9 Illumina Inc
- 19.2.9.1. Overview
- 19.2.9.2. Products
- 19.2.9.3. SWOT Analysis
- 19.2.9.4. Recent Developments
- 19.2.9.5. Financials (Based on Availability)
- 19.2.10 Abbott Laboratories Inc
- 19.2.10.1. Overview
- 19.2.10.2. Products
- 19.2.10.3. SWOT Analysis
- 19.2.10.4. Recent Developments
- 19.2.10.5. Financials (Based on Availability)
- 19.2.11 Thermo Fisher Scientific
- 19.2.11.1. Overview
- 19.2.11.2. Products
- 19.2.11.3. SWOT Analysis
- 19.2.11.4. Recent Developments
- 19.2.11.5. Financials (Based on Availability)
- 19.2.12 Agilent Technologies
- 19.2.12.1. Overview
- 19.2.12.2. Products
- 19.2.12.3. SWOT Analysis
- 19.2.12.4. Recent Developments
- 19.2.12.5. Financials (Based on Availability)
- 19.2.1 BioVision Inc (Abcam)
List of Figures
- Figure 1: Asia-Pacific Cancer Biomarkers Industry Revenue Breakdown (Million, %) by Product 2024 & 2032
- Figure 2: Asia-Pacific Cancer Biomarkers Industry Share (%) by Company 2024
List of Tables
- Table 1: Asia-Pacific Cancer Biomarkers Industry Revenue Million Forecast, by Region 2019 & 2032
- Table 2: Asia-Pacific Cancer Biomarkers Industry Volume K Unit Forecast, by Region 2019 & 2032
- Table 3: Asia-Pacific Cancer Biomarkers Industry Revenue Million Forecast, by Cancer Type 2019 & 2032
- Table 4: Asia-Pacific Cancer Biomarkers Industry Volume K Unit Forecast, by Cancer Type 2019 & 2032
- Table 5: Asia-Pacific Cancer Biomarkers Industry Revenue Million Forecast, by Type of Biomarker 2019 & 2032
- Table 6: Asia-Pacific Cancer Biomarkers Industry Volume K Unit Forecast, by Type of Biomarker 2019 & 2032
- Table 7: Asia-Pacific Cancer Biomarkers Industry Revenue Million Forecast, by Profiling Technology 2019 & 2032
- Table 8: Asia-Pacific Cancer Biomarkers Industry Volume K Unit Forecast, by Profiling Technology 2019 & 2032
- Table 9: Asia-Pacific Cancer Biomarkers Industry Revenue Million Forecast, by Geography 2019 & 2032
- Table 10: Asia-Pacific Cancer Biomarkers Industry Volume K Unit Forecast, by Geography 2019 & 2032
- Table 11: Asia-Pacific Cancer Biomarkers Industry Revenue Million Forecast, by Region 2019 & 2032
- Table 12: Asia-Pacific Cancer Biomarkers Industry Volume K Unit Forecast, by Region 2019 & 2032
- Table 13: Asia-Pacific Cancer Biomarkers Industry Revenue Million Forecast, by Country 2019 & 2032
- Table 14: Asia-Pacific Cancer Biomarkers Industry Volume K Unit Forecast, by Country 2019 & 2032
- Table 15: China Asia-Pacific Cancer Biomarkers Industry Revenue (Million) Forecast, by Application 2019 & 2032
- Table 16: China Asia-Pacific Cancer Biomarkers Industry Volume (K Unit) Forecast, by Application 2019 & 2032
- Table 17: Japan Asia-Pacific Cancer Biomarkers Industry Revenue (Million) Forecast, by Application 2019 & 2032
- Table 18: Japan Asia-Pacific Cancer Biomarkers Industry Volume (K Unit) Forecast, by Application 2019 & 2032
- Table 19: India Asia-Pacific Cancer Biomarkers Industry Revenue (Million) Forecast, by Application 2019 & 2032
- Table 20: India Asia-Pacific Cancer Biomarkers Industry Volume (K Unit) Forecast, by Application 2019 & 2032
- Table 21: South Korea Asia-Pacific Cancer Biomarkers Industry Revenue (Million) Forecast, by Application 2019 & 2032
- Table 22: South Korea Asia-Pacific Cancer Biomarkers Industry Volume (K Unit) Forecast, by Application 2019 & 2032
- Table 23: Taiwan Asia-Pacific Cancer Biomarkers Industry Revenue (Million) Forecast, by Application 2019 & 2032
- Table 24: Taiwan Asia-Pacific Cancer Biomarkers Industry Volume (K Unit) Forecast, by Application 2019 & 2032
- Table 25: Australia Asia-Pacific Cancer Biomarkers Industry Revenue (Million) Forecast, by Application 2019 & 2032
- Table 26: Australia Asia-Pacific Cancer Biomarkers Industry Volume (K Unit) Forecast, by Application 2019 & 2032
- Table 27: Rest of Asia-Pacific Asia-Pacific Cancer Biomarkers Industry Revenue (Million) Forecast, by Application 2019 & 2032
- Table 28: Rest of Asia-Pacific Asia-Pacific Cancer Biomarkers Industry Volume (K Unit) Forecast, by Application 2019 & 2032
- Table 29: Asia-Pacific Cancer Biomarkers Industry Revenue Million Forecast, by Cancer Type 2019 & 2032
- Table 30: Asia-Pacific Cancer Biomarkers Industry Volume K Unit Forecast, by Cancer Type 2019 & 2032
- Table 31: Asia-Pacific Cancer Biomarkers Industry Revenue Million Forecast, by Type of Biomarker 2019 & 2032
- Table 32: Asia-Pacific Cancer Biomarkers Industry Volume K Unit Forecast, by Type of Biomarker 2019 & 2032
- Table 33: Asia-Pacific Cancer Biomarkers Industry Revenue Million Forecast, by Profiling Technology 2019 & 2032
- Table 34: Asia-Pacific Cancer Biomarkers Industry Volume K Unit Forecast, by Profiling Technology 2019 & 2032
- Table 35: Asia-Pacific Cancer Biomarkers Industry Revenue Million Forecast, by Geography 2019 & 2032
- Table 36: Asia-Pacific Cancer Biomarkers Industry Volume K Unit Forecast, by Geography 2019 & 2032
- Table 37: Asia-Pacific Cancer Biomarkers Industry Revenue Million Forecast, by Country 2019 & 2032
- Table 38: Asia-Pacific Cancer Biomarkers Industry Volume K Unit Forecast, by Country 2019 & 2032
- Table 39: Asia-Pacific Cancer Biomarkers Industry Revenue Million Forecast, by Cancer Type 2019 & 2032
- Table 40: Asia-Pacific Cancer Biomarkers Industry Volume K Unit Forecast, by Cancer Type 2019 & 2032
- Table 41: Asia-Pacific Cancer Biomarkers Industry Revenue Million Forecast, by Type of Biomarker 2019 & 2032
- Table 42: Asia-Pacific Cancer Biomarkers Industry Volume K Unit Forecast, by Type of Biomarker 2019 & 2032
- Table 43: Asia-Pacific Cancer Biomarkers Industry Revenue Million Forecast, by Profiling Technology 2019 & 2032
- Table 44: Asia-Pacific Cancer Biomarkers Industry Volume K Unit Forecast, by Profiling Technology 2019 & 2032
- Table 45: Asia-Pacific Cancer Biomarkers Industry Revenue Million Forecast, by Geography 2019 & 2032
- Table 46: Asia-Pacific Cancer Biomarkers Industry Volume K Unit Forecast, by Geography 2019 & 2032
- Table 47: Asia-Pacific Cancer Biomarkers Industry Revenue Million Forecast, by Country 2019 & 2032
- Table 48: Asia-Pacific Cancer Biomarkers Industry Volume K Unit Forecast, by Country 2019 & 2032
- Table 49: Asia-Pacific Cancer Biomarkers Industry Revenue Million Forecast, by Cancer Type 2019 & 2032
- Table 50: Asia-Pacific Cancer Biomarkers Industry Volume K Unit Forecast, by Cancer Type 2019 & 2032
- Table 51: Asia-Pacific Cancer Biomarkers Industry Revenue Million Forecast, by Type of Biomarker 2019 & 2032
- Table 52: Asia-Pacific Cancer Biomarkers Industry Volume K Unit Forecast, by Type of Biomarker 2019 & 2032
- Table 53: Asia-Pacific Cancer Biomarkers Industry Revenue Million Forecast, by Profiling Technology 2019 & 2032
- Table 54: Asia-Pacific Cancer Biomarkers Industry Volume K Unit Forecast, by Profiling Technology 2019 & 2032
- Table 55: Asia-Pacific Cancer Biomarkers Industry Revenue Million Forecast, by Geography 2019 & 2032
- Table 56: Asia-Pacific Cancer Biomarkers Industry Volume K Unit Forecast, by Geography 2019 & 2032
- Table 57: Asia-Pacific Cancer Biomarkers Industry Revenue Million Forecast, by Country 2019 & 2032
- Table 58: Asia-Pacific Cancer Biomarkers Industry Volume K Unit Forecast, by Country 2019 & 2032
- Table 59: Asia-Pacific Cancer Biomarkers Industry Revenue Million Forecast, by Cancer Type 2019 & 2032
- Table 60: Asia-Pacific Cancer Biomarkers Industry Volume K Unit Forecast, by Cancer Type 2019 & 2032
- Table 61: Asia-Pacific Cancer Biomarkers Industry Revenue Million Forecast, by Type of Biomarker 2019 & 2032
- Table 62: Asia-Pacific Cancer Biomarkers Industry Volume K Unit Forecast, by Type of Biomarker 2019 & 2032
- Table 63: Asia-Pacific Cancer Biomarkers Industry Revenue Million Forecast, by Profiling Technology 2019 & 2032
- Table 64: Asia-Pacific Cancer Biomarkers Industry Volume K Unit Forecast, by Profiling Technology 2019 & 2032
- Table 65: Asia-Pacific Cancer Biomarkers Industry Revenue Million Forecast, by Geography 2019 & 2032
- Table 66: Asia-Pacific Cancer Biomarkers Industry Volume K Unit Forecast, by Geography 2019 & 2032
- Table 67: Asia-Pacific Cancer Biomarkers Industry Revenue Million Forecast, by Country 2019 & 2032
- Table 68: Asia-Pacific Cancer Biomarkers Industry Volume K Unit Forecast, by Country 2019 & 2032
- Table 69: Asia-Pacific Cancer Biomarkers Industry Revenue Million Forecast, by Cancer Type 2019 & 2032
- Table 70: Asia-Pacific Cancer Biomarkers Industry Volume K Unit Forecast, by Cancer Type 2019 & 2032
- Table 71: Asia-Pacific Cancer Biomarkers Industry Revenue Million Forecast, by Type of Biomarker 2019 & 2032
- Table 72: Asia-Pacific Cancer Biomarkers Industry Volume K Unit Forecast, by Type of Biomarker 2019 & 2032
- Table 73: Asia-Pacific Cancer Biomarkers Industry Revenue Million Forecast, by Profiling Technology 2019 & 2032
- Table 74: Asia-Pacific Cancer Biomarkers Industry Volume K Unit Forecast, by Profiling Technology 2019 & 2032
- Table 75: Asia-Pacific Cancer Biomarkers Industry Revenue Million Forecast, by Geography 2019 & 2032
- Table 76: Asia-Pacific Cancer Biomarkers Industry Volume K Unit Forecast, by Geography 2019 & 2032
- Table 77: Asia-Pacific Cancer Biomarkers Industry Revenue Million Forecast, by Country 2019 & 2032
- Table 78: Asia-Pacific Cancer Biomarkers Industry Volume K Unit Forecast, by Country 2019 & 2032
- Table 79: Asia-Pacific Cancer Biomarkers Industry Revenue Million Forecast, by Cancer Type 2019 & 2032
- Table 80: Asia-Pacific Cancer Biomarkers Industry Volume K Unit Forecast, by Cancer Type 2019 & 2032
- Table 81: Asia-Pacific Cancer Biomarkers Industry Revenue Million Forecast, by Type of Biomarker 2019 & 2032
- Table 82: Asia-Pacific Cancer Biomarkers Industry Volume K Unit Forecast, by Type of Biomarker 2019 & 2032
- Table 83: Asia-Pacific Cancer Biomarkers Industry Revenue Million Forecast, by Profiling Technology 2019 & 2032
- Table 84: Asia-Pacific Cancer Biomarkers Industry Volume K Unit Forecast, by Profiling Technology 2019 & 2032
- Table 85: Asia-Pacific Cancer Biomarkers Industry Revenue Million Forecast, by Geography 2019 & 2032
- Table 86: Asia-Pacific Cancer Biomarkers Industry Volume K Unit Forecast, by Geography 2019 & 2032
- Table 87: Asia-Pacific Cancer Biomarkers Industry Revenue Million Forecast, by Country 2019 & 2032
- Table 88: Asia-Pacific Cancer Biomarkers Industry Volume K Unit Forecast, by Country 2019 & 2032
Frequently Asked Questions
1. What is the projected Compound Annual Growth Rate (CAGR) of the Asia-Pacific Cancer Biomarkers Industry?
The projected CAGR is approximately 12.50%.
2. Which companies are prominent players in the Asia-Pacific Cancer Biomarkers Industry?
Key companies in the market include BioVision Inc (Abcam), Merck & Co Inc, Biomerieux SA, F Hoffmann-La Roche Ltd, Hologic Inc, Celera Corporation (Quest Diagnostics), ASURAGEN INC, Qiagen NV, Illumina Inc, Abbott Laboratories Inc, Thermo Fisher Scientific, Agilent Technologies.
3. What are the main segments of the Asia-Pacific Cancer Biomarkers Industry?
The market segments include Cancer Type, Type of Biomarker, Profiling Technology, Geography.
4. Can you provide details about the market size?
The market size is estimated to be USD XX Million as of 2022.
5. What are some drivers contributing to market growth?
Rising Prevalence of Cancer; Increasing Research Activities and Growing Usage of Biomarkers in Drug Development.
6. What are the notable trends driving market growth?
Breast Cancer is Expected to Grow with a Significant CAGR in the Market Over the Forecast Period.
7. Are there any restraints impacting market growth?
High Cost of Diagnosis; Reimbursement Issues.
8. Can you provide examples of recent developments in the market?
October 2022: The Garvan Institute of Medical Research in Australia discovered a new biomarker for prostate cancer that could lead to better diagnosis and treatment for men with the aggressive form of this disease.
9. What pricing options are available for accessing the report?
Pricing options include single-user, multi-user, and enterprise licenses priced at USD 4750, USD 5250, and USD 8750 respectively.
10. Is the market size provided in terms of value or volume?
The market size is provided in terms of value, measured in Million and volume, measured in K Unit.
11. Are there any specific market keywords associated with the report?
Yes, the market keyword associated with the report is "Asia-Pacific Cancer Biomarkers Industry," which aids in identifying and referencing the specific market segment covered.
12. How do I determine which pricing option suits my needs best?
The pricing options vary based on user requirements and access needs. Individual users may opt for single-user licenses, while businesses requiring broader access may choose multi-user or enterprise licenses for cost-effective access to the report.
13. Are there any additional resources or data provided in the Asia-Pacific Cancer Biomarkers Industry report?
While the report offers comprehensive insights, it's advisable to review the specific contents or supplementary materials provided to ascertain if additional resources or data are available.
14. How can I stay updated on further developments or reports in the Asia-Pacific Cancer Biomarkers Industry?
To stay informed about further developments, trends, and reports in the Asia-Pacific Cancer Biomarkers Industry, consider subscribing to industry newsletters, following relevant companies and organizations, or regularly checking reputable industry news sources and publications.
Methodology
Step 1 - Identification of Relevant Samples Size from Population Database


Step 2 - Approaches for Defining Global Market Size (Value, Volume* & Price*)

Note*: In applicable scenarios
Step 3 - Data Sources
Primary Research
- Web Analytics
- Survey Reports
- Research Institute
- Latest Research Reports
- Opinion Leaders
Secondary Research
- Annual Reports
- White Paper
- Latest Press Release
- Industry Association
- Paid Database
- Investor Presentations

Step 4 - Data Triangulation
Involves using different sources of information in order to increase the validity of a study
These sources are likely to be stakeholders in a program - participants, other researchers, program staff, other community members, and so on.
Then we put all data in single framework & apply various statistical tools to find out the dynamic on the market.
During the analysis stage, feedback from the stakeholder groups would be compared to determine areas of agreement as well as areas of divergence


