

Key Insights
The Asia-Pacific Anti-Money Laundering (AML) solutions market is experiencing significant expansion, propelled by escalating financial crime, stringent regulatory compliance mandates, and the accelerating adoption of digital financial services. The market, valued at approximately $4.13 billion in 2025, is projected to grow at a compound annual growth rate (CAGR) of 17.8% from 2025 to 2033. Key growth drivers include the expanding digital economy, increasing cross-border transactions, and the evolving sophistication of financial crimes. The widespread adoption of cloud-based AML solutions, offering enhanced scalability, cost-efficiency, and advanced data analytics, is further stimulating market growth. Major economies such as China, India, and Japan are leading the market due to their robust financial sectors, while financial inclusion initiatives in other APAC nations present substantial growth opportunities. The market is segmented by solution type (Know Your Customer (KYC) systems, compliance reporting, transaction monitoring, auditing & reporting, and others), deployment (on-premise and cloud), and industry (BFSI, healthcare, retail, IT & telecom, and government). The competitive environment features a mix of established technology providers and specialized AML solution developers, fostering continuous innovation.
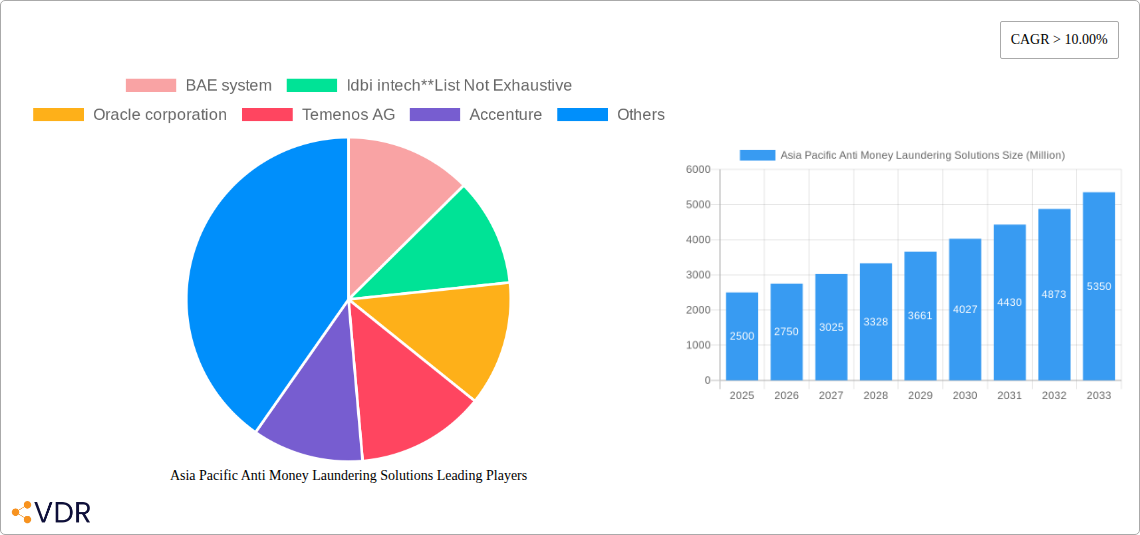
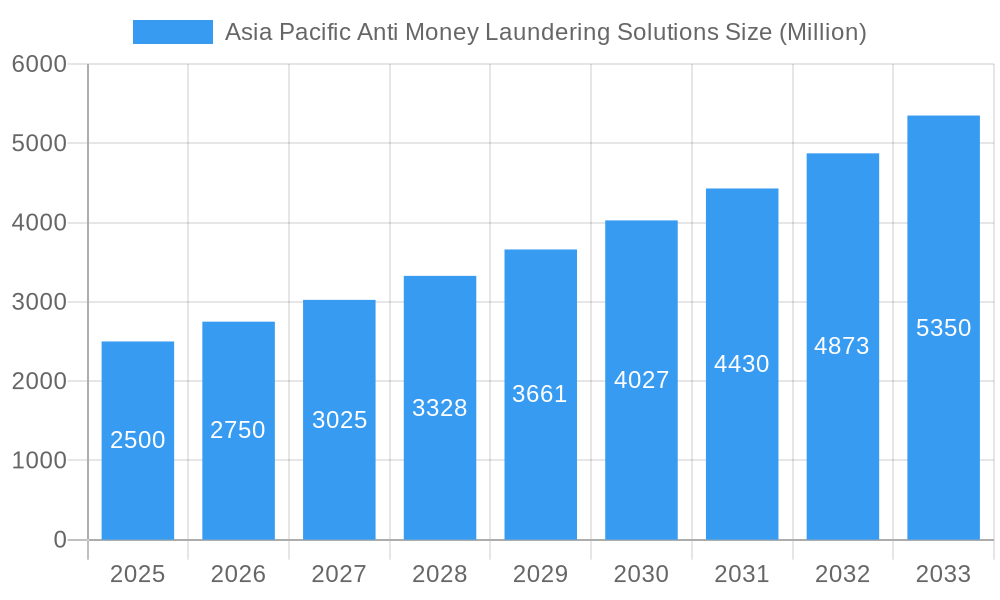
Asia Pacific Anti Money Laundering Solutions Market Size (In Billion)
The regulatory environment significantly influences market dynamics. Governments across the Asia-Pacific are consistently reinforcing AML regulations, implementing stricter penalties for non-compliance, and demanding more effective AML solutions, thereby driving market expansion. While challenges such as data privacy concerns, integration complexities, and the demand for skilled professionals exist, the overall market outlook is positive. The persistent rise in financial crime, coupled with increasingly stringent regulatory requirements and the integration of advanced technologies like artificial intelligence and machine learning, will sustain market growth throughout the forecast period, particularly within cloud-based AML solutions and advanced analytics segments.
Asia Pacific Anti Money Laundering Solutions Company Market Share
Asia Pacific Anti-Money Laundering (AML) Solutions Market Report: 2019-2033
This comprehensive report provides an in-depth analysis of the Asia Pacific Anti-Money Laundering (AML) Solutions market, offering invaluable insights for industry professionals, investors, and strategic decision-makers. The report covers the period from 2019 to 2033, with a focus on the estimated year 2025 and a forecast period spanning 2025-2033. The market is segmented by country (China, India, Australia, Japan, Singapore, South Korea, Rest of Asia-Pacific), type (Software, Services), deployment (On-premise, Cloud), solution (Know Your Customer (KYC) systems, Compliance reporting, Transaction monitoring, Auditing & reporting, Other solutions), and industry (Healthcare, BFSI, Retail, IT & Telecom, Government & others). Key players analyzed include BAE Systems, IDBI Intech, Oracle Corporation, Temenos AG, Accenture, Open Text Corporation, Eastnets, ACI Worldwide, IBM Corporation, SAS Institute, Fiserv, and NICE Systems (list not exhaustive). The market size is valued in million units.
Asia Pacific Anti-Money Laundering Solutions Market Dynamics & Structure
The Asia Pacific AML solutions market is characterized by a moderately concentrated landscape with a few major players holding significant market share, estimated at xx% in 2025. Technological innovation, driven by advancements in artificial intelligence (AI), machine learning (ML), and big data analytics, is a key growth driver. Stringent regulatory frameworks, such as those implemented by the Financial Action Task Force (FATF), are further propelling market expansion. However, challenges remain, including the high cost of implementation and integration, data privacy concerns, and the evolving nature of financial crimes. Mergers and acquisitions (M&A) activity is relatively high, with xx deals recorded in the historical period (2019-2024), indicating a consolidating market.
- Market Concentration: Moderately concentrated, with top 5 players holding xx% market share (2025).
- Technological Drivers: AI, ML, big data analytics driving innovation.
- Regulatory Framework: Stringent FATF guidelines and regional regulations.
- Competitive Substitutes: Limited, due to specialized nature of AML solutions.
- M&A Activity: xx deals recorded between 2019 and 2024.
- Innovation Barriers: High implementation costs, integration complexities, data security concerns.
Asia Pacific Anti-Money Laundering Solutions Growth Trends & Insights
The Asia Pacific AML solutions market experienced significant growth during the historical period (2019-2024), with a CAGR of xx%. This growth is attributed to increasing cross-border transactions, rising cybercrime, and stricter regulatory compliance requirements. The market is expected to continue its expansion during the forecast period (2025-2033), with a projected CAGR of xx%, driven by factors such as increasing adoption of cloud-based solutions, the growing need for real-time transaction monitoring, and the rising awareness of AML risks across various industries. The market penetration rate is estimated at xx% in 2025, with significant potential for future growth, particularly in emerging economies. Consumer behavior shifts toward digital financial services are also contributing factors. Technological disruptions, including the adoption of blockchain technology for enhanced transparency, will significantly influence market growth.
Dominant Regions, Countries, or Segments in Asia Pacific Anti-Money Laundering Solutions
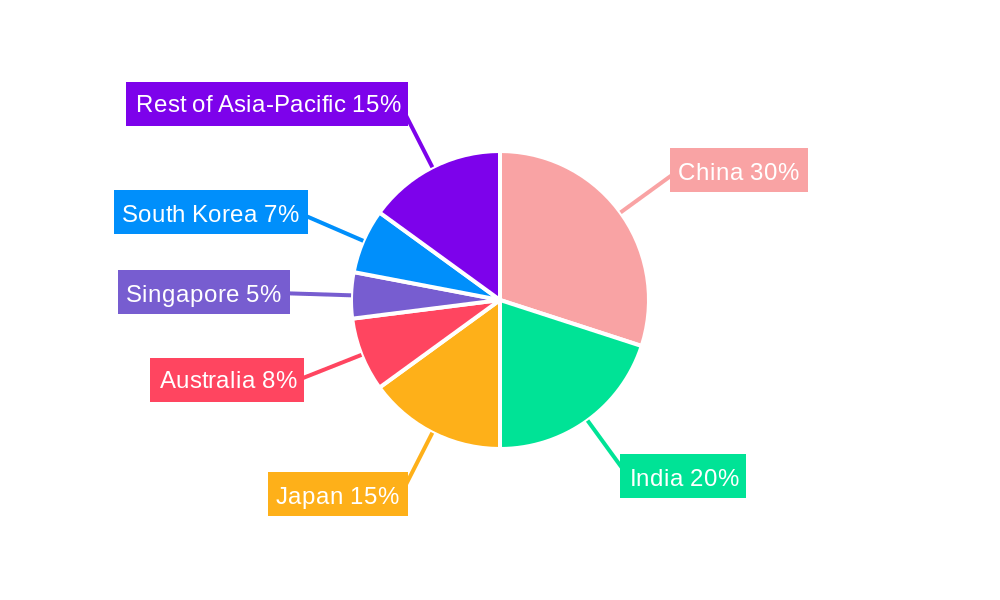
China and India are the dominant markets in the Asia Pacific region, accounting for a combined xx% of the market share in 2025. Their large populations, expanding financial sectors, and increasing adoption of digital technologies contribute to this dominance. The BFSI sector is the largest end-user industry, followed by the Government & others sector. Software solutions dominate the market by type, while cloud deployment is gaining traction. Transaction monitoring is the leading solution segment, driven by the need for real-time risk assessment.
- Leading Region: China and India
- Key Drivers in China: Strong economic growth, expanding financial sector, stringent regulations.
- Key Drivers in India: Digital India initiative, rising fintech adoption, government focus on financial inclusion.
- Dominant Segment (By Type): Software
- Dominant Segment (By Deployment): Cloud (growing rapidly)
- Dominant Segment (By Solution): Transaction Monitoring
Asia Pacific Anti-Money Laundering Solutions Product Landscape
The AML solutions landscape is evolving rapidly, with innovative products incorporating AI, ML, and blockchain technology. These advancements enhance the accuracy and efficiency of KYC processes, transaction monitoring, and compliance reporting. Key product innovations include advanced analytics for fraud detection, automated compliance workflows, and integrated solutions that streamline AML processes. Unique selling propositions focus on ease of use, scalability, and real-time risk assessment capabilities. These solutions provide improved accuracy, reduced false positives, and enhanced regulatory compliance.
Key Drivers, Barriers & Challenges in Asia Pacific Anti-Money Laundering Solutions
Key Drivers: Stringent AML regulations, rising financial crimes, increasing cross-border transactions, growing adoption of digital technologies, and government initiatives promoting financial stability.
Challenges: High implementation costs, integration complexities, lack of skilled professionals, data privacy concerns, and the evolving nature of financial crimes. For instance, the complexity of integrating legacy systems can pose a significant barrier for some organizations, leading to slower adoption rates. Furthermore, the constant need to adapt to evolving regulatory landscape and emerging fraud techniques also present challenges. These challenges, if not properly addressed, could hinder market growth.
Emerging Opportunities in Asia Pacific Anti-Money Laundering Solutions
Untapped markets in smaller economies within the Asia Pacific region present significant opportunities. Growth potential exists in integrating AML solutions with blockchain technology for increased transparency and efficiency. The demand for specialized AML solutions tailored to specific industries (e.g., fintech) is also rising. The focus is shifting towards AI-powered solutions to prevent and detect sophisticated fraud schemes, creating new growth avenues.
Growth Accelerators in the Asia Pacific Anti-Money Laundering Solutions Industry
Technological breakthroughs such as AI and ML are major catalysts. Strategic partnerships between technology providers and financial institutions are driving innovation and market penetration. Government initiatives promoting financial inclusion and digitalization are creating favorable conditions for market growth. Expansion into underserved markets and the development of more user-friendly solutions will further accelerate market expansion.
Key Players Shaping the Asia Pacific Anti-Money Laundering Solutions Market
Notable Milestones in Asia Pacific Anti-Money Laundering Solutions Sector
- 2021: Increased regulatory scrutiny leads to higher adoption of AML solutions in several Asia-Pacific countries.
- 2022: Launch of several AI-powered AML solutions by key players.
- 2023: Significant M&A activity among AML solution providers, leading to market consolidation.
- 2024: Growing adoption of cloud-based AML solutions.
In-Depth Asia Pacific Anti-Money Laundering Solutions Market Outlook
The Asia Pacific AML solutions market is poised for strong growth, driven by increasing regulatory pressure, rising financial crime, and the expanding digital economy. Strategic opportunities exist for companies focusing on AI-powered solutions, cloud-based deployments, and customized solutions for specific industries. The market will continue to see consolidation, with larger players acquiring smaller companies to enhance their product offerings and expand their market reach. The focus on enhancing accuracy, reducing false positives, and improving regulatory compliance will continue to shape the future of the market.
Asia Pacific Anti Money Laundering Solutions Segmentation
-
1. Type
- 1.1. Software
- 1.2. Services
-
2. Deployment
- 2.1. On-premise
- 2.2. cloud
-
3. Solution
- 3.1. Know your customer systems
- 3.2. Compliance reporting
- 3.3. Transaction monitoring
- 3.4. Auditing & reporting
- 3.5. Other solutions
-
4. Industry
- 4.1. Healthcare
- 4.2. BFSI
- 4.3. Retail
- 4.4. IT & telecom
- 4.5. Government & others
Asia Pacific Anti Money Laundering Solutions Segmentation By Geography
-
1. Asia Pacific
- 1.1. China
- 1.2. Japan
- 1.3. South Korea
- 1.4. India
- 1.5. Australia
- 1.6. New Zealand
- 1.7. Indonesia
- 1.8. Malaysia
- 1.9. Singapore
- 1.10. Thailand
- 1.11. Vietnam
- 1.12. Philippines
Asia Pacific Anti Money Laundering Solutions Regional Market Share
Geographic Coverage of Asia Pacific Anti Money Laundering Solutions
Asia Pacific Anti Money Laundering Solutions REPORT HIGHLIGHTS
| Aspects | Details |
|---|---|
| Study Period | 2020-2034 |
| Base Year | 2025 |
| Estimated Year | 2026 |
| Forecast Period | 2026-2034 |
| Historical Period | 2020-2025 |
| Growth Rate | CAGR of 17.8% from 2020-2034 |
| Segmentation |
|
Table of Contents
- 1. Introduction
- 1.1. Research Scope
- 1.2. Market Segmentation
- 1.3. Research Objective
- 1.4. Definitions and Assumptions
- 2. Executive Summary
- 2.1. Market Snapshot
- 3. Market Dynamics
- 3.1. Market Drivers
- 3.2. Market Restrains
- 3.3. Market Trends
- 3.4. Market Opportunities
- 4. Market Factor Analysis
- 4.1. Porters Five Forces
- 4.1.1. Bargaining Power of Suppliers
- 4.1.2. Bargaining Power of Buyers
- 4.1.3. Threat of New Entrants
- 4.1.4. Threat of Substitutes
- 4.1.5. Competitive Rivalry
- 4.2. PESTEL analysis
- 4.3. BCG Analysis
- 4.3.1. Stars (High Growth, High Market Share)
- 4.3.2. Cash Cows (Low Growth, High Market Share)
- 4.3.3. Question Mark (High Growth, Low Market Share)
- 4.3.4. Dogs (Low Growth, Low Market Share)
- 4.4. Ansoff Matrix Analysis
- 4.5. Supply Chain Analysis
- 4.6. Regulatory Landscape
- 4.7. Current Market Potential and Opportunity Assessment (TAM–SAM–SOM Framework)
- 4.8. VDR Analyst Note
- 4.1. Porters Five Forces
- 5. Market Analysis, Insights and Forecast 2021-2033
- 5.1. Market Analysis, Insights and Forecast - by Type
- 5.1.1. Software
- 5.1.2. Services
- 5.2. Market Analysis, Insights and Forecast - by Deployment
- 5.2.1. On-premise
- 5.2.2. cloud
- 5.3. Market Analysis, Insights and Forecast - by Solution
- 5.3.1. Know your customer systems
- 5.3.2. Compliance reporting
- 5.3.3. Transaction monitoring
- 5.3.4. Auditing & reporting
- 5.3.5. Other solutions
- 5.4. Market Analysis, Insights and Forecast - by Industry
- 5.4.1. Healthcare
- 5.4.2. BFSI
- 5.4.3. Retail
- 5.4.4. IT & telecom
- 5.4.5. Government & others
- 5.5. Market Analysis, Insights and Forecast - by Region
- 5.5.1. Asia Pacific
- 5.1. Market Analysis, Insights and Forecast - by Type
- 6. Asia Pacific Anti Money Laundering Solutions Analysis, Insights and Forecast, 2021-2033
- 6.1. Market Analysis, Insights and Forecast - by Type
- 6.1.1. Software
- 6.1.2. Services
- 6.2. Market Analysis, Insights and Forecast - by Deployment
- 6.2.1. On-premise
- 6.2.2. cloud
- 6.3. Market Analysis, Insights and Forecast - by Solution
- 6.3.1. Know your customer systems
- 6.3.2. Compliance reporting
- 6.3.3. Transaction monitoring
- 6.3.4. Auditing & reporting
- 6.3.5. Other solutions
- 6.4. Market Analysis, Insights and Forecast - by Industry
- 6.4.1. Healthcare
- 6.4.2. BFSI
- 6.4.3. Retail
- 6.4.4. IT & telecom
- 6.4.5. Government & others
- 6.1. Market Analysis, Insights and Forecast - by Type
- 7. Competitive Analysis
- 7.1. Company Profiles
- 7.1.1 BAE system
- 7.1.1.1. Company Overview
- 7.1.1.2. Products
- 7.1.1.3. Company Financials
- 7.1.1.4. SWOT Analysis
- 7.1.2 Idbi intech**List Not Exhaustive
- 7.1.2.1. Company Overview
- 7.1.2.2. Products
- 7.1.2.3. Company Financials
- 7.1.2.4. SWOT Analysis
- 7.1.3 Oracle corporation
- 7.1.3.1. Company Overview
- 7.1.3.2. Products
- 7.1.3.3. Company Financials
- 7.1.3.4. SWOT Analysis
- 7.1.4 Temenos AG
- 7.1.4.1. Company Overview
- 7.1.4.2. Products
- 7.1.4.3. Company Financials
- 7.1.4.4. SWOT Analysis
- 7.1.5 Accenture
- 7.1.5.1. Company Overview
- 7.1.5.2. Products
- 7.1.5.3. Company Financials
- 7.1.5.4. SWOT Analysis
- 7.1.6 Open text corporation
- 7.1.6.1. Company Overview
- 7.1.6.2. Products
- 7.1.6.3. Company Financials
- 7.1.6.4. SWOT Analysis
- 7.1.7 eastnets
- 7.1.7.1. Company Overview
- 7.1.7.2. Products
- 7.1.7.3. Company Financials
- 7.1.7.4. SWOT Analysis
- 7.1.8 ACI worldwide
- 7.1.8.1. Company Overview
- 7.1.8.2. Products
- 7.1.8.3. Company Financials
- 7.1.8.4. SWOT Analysis
- 7.1.9 IBM corporation
- 7.1.9.1. Company Overview
- 7.1.9.2. Products
- 7.1.9.3. Company Financials
- 7.1.9.4. SWOT Analysis
- 7.1.10 SAS Institute
- 7.1.10.1. Company Overview
- 7.1.10.2. Products
- 7.1.10.3. Company Financials
- 7.1.10.4. SWOT Analysis
- 7.1.11 Fiserv
- 7.1.11.1. Company Overview
- 7.1.11.2. Products
- 7.1.11.3. Company Financials
- 7.1.11.4. SWOT Analysis
- 7.1.12 NICE systems
- 7.1.12.1. Company Overview
- 7.1.12.2. Products
- 7.1.12.3. Company Financials
- 7.1.12.4. SWOT Analysis
- 7.1.1 BAE system
- 7.2. Market Entropy
- 7.2.1 Company's Key Areas Served
- 7.2.2 Recent Developments
- 7.3. Company Market Share Analysis 2025
- 7.3.1 Top 5 Companies Market Share Analysis
- 7.3.2 Top 3 Companies Market Share Analysis
- 7.4. List of Potential Customers
- 8. Research Methodology
List of Figures
- Figure 1: Asia Pacific Anti Money Laundering Solutions Revenue Breakdown (billion, %) by Product 2025 & 2033
- Figure 2: Asia Pacific Anti Money Laundering Solutions Share (%) by Company 2025
List of Tables
- Table 1: Asia Pacific Anti Money Laundering Solutions Revenue billion Forecast, by Type 2020 & 2033
- Table 2: Asia Pacific Anti Money Laundering Solutions Revenue billion Forecast, by Deployment 2020 & 2033
- Table 3: Asia Pacific Anti Money Laundering Solutions Revenue billion Forecast, by Solution 2020 & 2033
- Table 4: Asia Pacific Anti Money Laundering Solutions Revenue billion Forecast, by Industry 2020 & 2033
- Table 5: Asia Pacific Anti Money Laundering Solutions Revenue billion Forecast, by Region 2020 & 2033
- Table 6: Asia Pacific Anti Money Laundering Solutions Revenue billion Forecast, by Type 2020 & 2033
- Table 7: Asia Pacific Anti Money Laundering Solutions Revenue billion Forecast, by Deployment 2020 & 2033
- Table 8: Asia Pacific Anti Money Laundering Solutions Revenue billion Forecast, by Solution 2020 & 2033
- Table 9: Asia Pacific Anti Money Laundering Solutions Revenue billion Forecast, by Industry 2020 & 2033
- Table 10: Asia Pacific Anti Money Laundering Solutions Revenue billion Forecast, by Country 2020 & 2033
- Table 11: China Asia Pacific Anti Money Laundering Solutions Revenue (billion) Forecast, by Application 2020 & 2033
- Table 12: Japan Asia Pacific Anti Money Laundering Solutions Revenue (billion) Forecast, by Application 2020 & 2033
- Table 13: South Korea Asia Pacific Anti Money Laundering Solutions Revenue (billion) Forecast, by Application 2020 & 2033
- Table 14: India Asia Pacific Anti Money Laundering Solutions Revenue (billion) Forecast, by Application 2020 & 2033
- Table 15: Australia Asia Pacific Anti Money Laundering Solutions Revenue (billion) Forecast, by Application 2020 & 2033
- Table 16: New Zealand Asia Pacific Anti Money Laundering Solutions Revenue (billion) Forecast, by Application 2020 & 2033
- Table 17: Indonesia Asia Pacific Anti Money Laundering Solutions Revenue (billion) Forecast, by Application 2020 & 2033
- Table 18: Malaysia Asia Pacific Anti Money Laundering Solutions Revenue (billion) Forecast, by Application 2020 & 2033
- Table 19: Singapore Asia Pacific Anti Money Laundering Solutions Revenue (billion) Forecast, by Application 2020 & 2033
- Table 20: Thailand Asia Pacific Anti Money Laundering Solutions Revenue (billion) Forecast, by Application 2020 & 2033
- Table 21: Vietnam Asia Pacific Anti Money Laundering Solutions Revenue (billion) Forecast, by Application 2020 & 2033
- Table 22: Philippines Asia Pacific Anti Money Laundering Solutions Revenue (billion) Forecast, by Application 2020 & 2033
Frequently Asked Questions
1. What is the projected Compound Annual Growth Rate (CAGR) of the Asia Pacific Anti Money Laundering Solutions?
The projected CAGR is approximately 17.8%.
2. Which companies are prominent players in the Asia Pacific Anti Money Laundering Solutions?
Key companies in the market include BAE system, Idbi intech**List Not Exhaustive, Oracle corporation, Temenos AG, Accenture, Open text corporation, eastnets, ACI worldwide, IBM corporation, SAS Institute, Fiserv, NICE systems.
3. What are the main segments of the Asia Pacific Anti Money Laundering Solutions?
The market segments include Type, Deployment, Solution, Industry.
4. Can you provide details about the market size?
The market size is estimated to be USD 4.13 billion as of 2022.
5. What are some drivers contributing to market growth?
Embedded Insurance is Driving the Market.
6. What are the notable trends driving market growth?
Rise in the Volume of Wired Transactions Driving the Market.
7. Are there any restraints impacting market growth?
Inflation is Restraining the Property and Casualty Insurance Market of Singapore.
8. Can you provide examples of recent developments in the market?
N/A
9. What pricing options are available for accessing the report?
Pricing options include single-user, multi-user, and enterprise licenses priced at USD 3800, USD 4500, and USD 5800 respectively.
10. Is the market size provided in terms of value or volume?
The market size is provided in terms of value, measured in billion.
11. Are there any specific market keywords associated with the report?
Yes, the market keyword associated with the report is "Asia Pacific Anti Money Laundering Solutions," which aids in identifying and referencing the specific market segment covered.
12. How do I determine which pricing option suits my needs best?
The pricing options vary based on user requirements and access needs. Individual users may opt for single-user licenses, while businesses requiring broader access may choose multi-user or enterprise licenses for cost-effective access to the report.
13. Are there any additional resources or data provided in the Asia Pacific Anti Money Laundering Solutions report?
While the report offers comprehensive insights, it's advisable to review the specific contents or supplementary materials provided to ascertain if additional resources or data are available.
14. How can I stay updated on further developments or reports in the Asia Pacific Anti Money Laundering Solutions?
To stay informed about further developments, trends, and reports in the Asia Pacific Anti Money Laundering Solutions, consider subscribing to industry newsletters, following relevant companies and organizations, or regularly checking reputable industry news sources and publications.
Methodology
Step 1 - Identification of Relevant Samples Size from Population Database


Step 2 - Approaches for Defining Global Market Size (Value, Volume* & Price*)

Note*: In applicable scenarios
Step 3 - Data Sources
Primary Research
- Web Analytics
- Survey Reports
- Research Institute
- Latest Research Reports
- Opinion Leaders
Secondary Research
- Annual Reports
- White Paper
- Latest Press Release
- Industry Association
- Paid Database
- Investor Presentations

Step 4 - Data Triangulation
Involves using different sources of information in order to increase the validity of a study
These sources are likely to be stakeholders in a program - participants, other researchers, program staff, other community members, and so on.
Then we put all data in single framework & apply various statistical tools to find out the dynamic on the market.
During the analysis stage, feedback from the stakeholder groups would be compared to determine areas of agreement as well as areas of divergence