

Key Insights
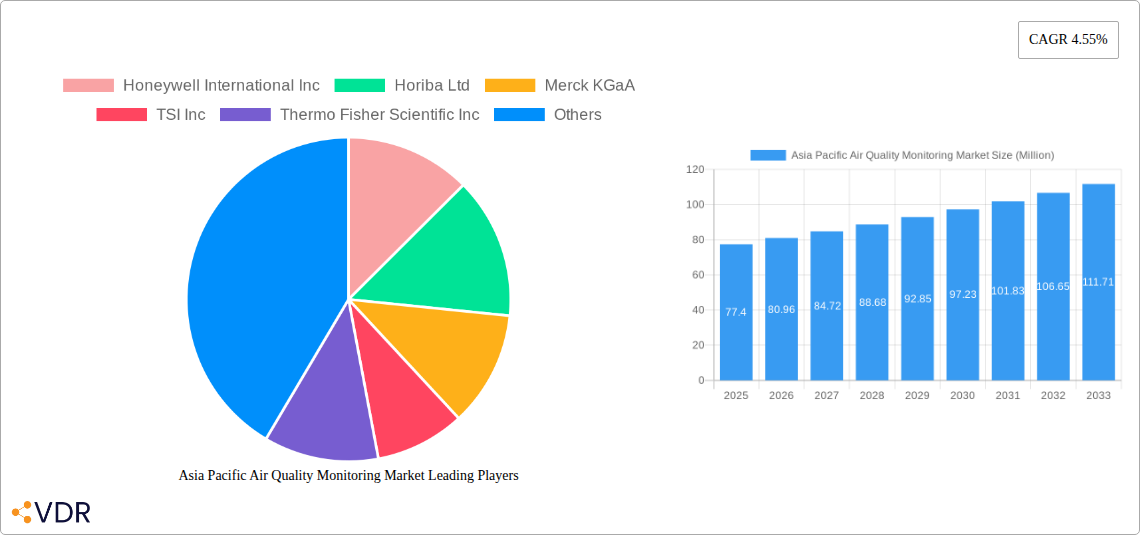
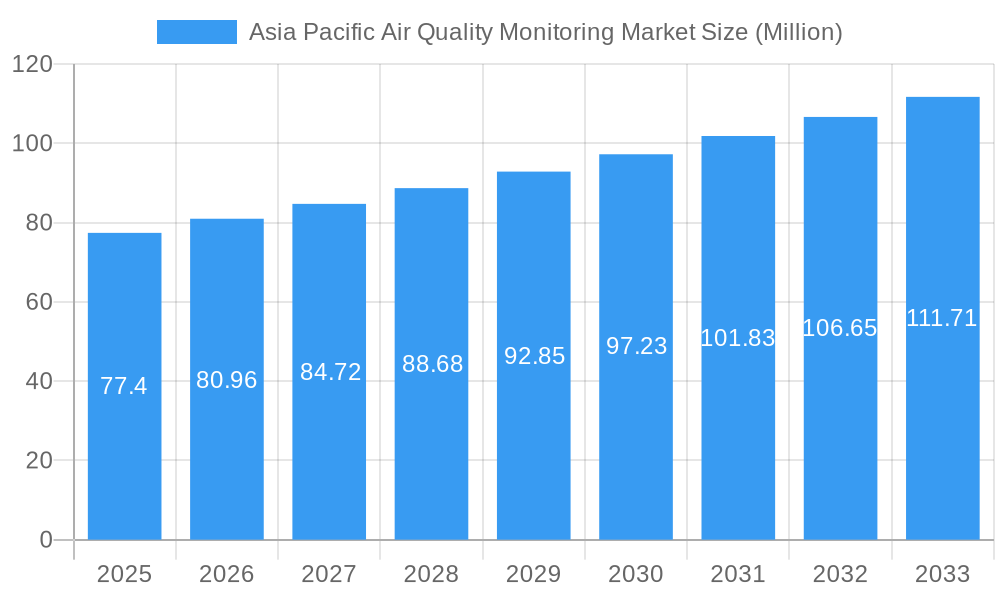
The Asia Pacific air quality monitoring market is experiencing robust growth, driven by increasing environmental concerns, stringent government regulations, and rising industrialization across the region. With a market size of $77.40 million in 2025 and a projected Compound Annual Growth Rate (CAGR) of 4.55% from 2025 to 2033, the market is poised for significant expansion. Key drivers include the escalating prevalence of respiratory illnesses linked to poor air quality, the growing demand for real-time air quality data for public health initiatives, and the increasing adoption of advanced monitoring technologies like IoT-enabled sensors. Furthermore, the expansion of industrial sectors, particularly in rapidly developing economies like China and India, fuels the need for effective air pollution control and monitoring. Market segmentation reveals strong growth in continuous sampling methods, owing to their ability to provide comprehensive and real-time data. Chemical pollutants constitute a significant portion of the monitored substances, followed by physical and biological pollutants. The end-user segments, namely power generation, petrochemicals, and residential & commercial sectors, are all contributing significantly to market growth, with the industrial sector expected to lead in terms of adoption of advanced monitoring systems. Competition is intense, with major players like Honeywell, Horiba, and Thermo Fisher Scientific vying for market share, alongside regional and specialized companies.
Asia Pacific Air Quality Monitoring Market Market Size (In Million)
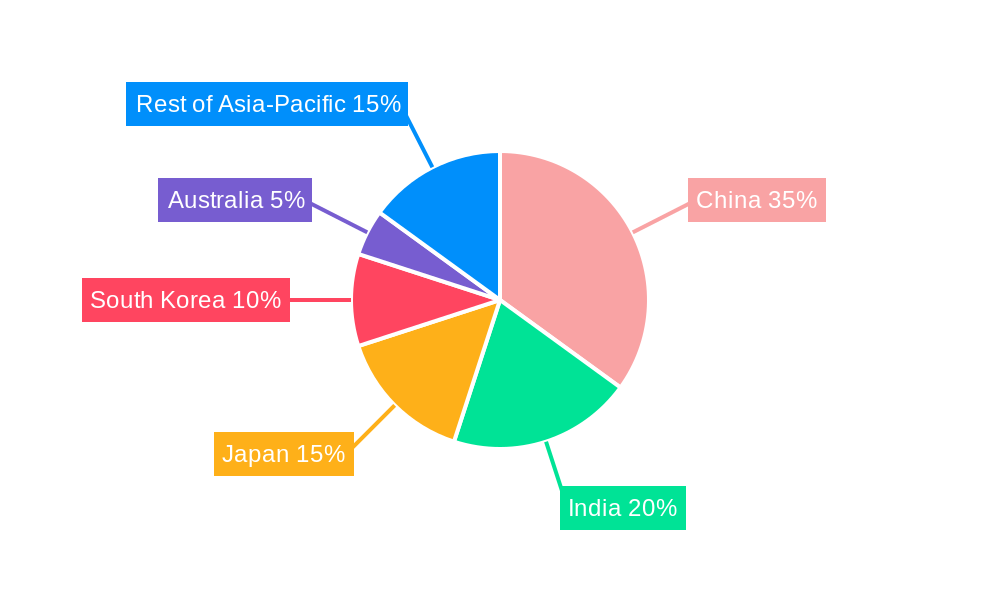
The Asia Pacific region's diverse geography and varying levels of economic development present both opportunities and challenges. While countries like China and India exhibit high growth potential due to rapid urbanization and industrialization, others like Japan and South Korea already have established air quality monitoring infrastructure, though ongoing upgrades and technology advancements present opportunities. The market's future growth will heavily depend on government initiatives promoting clean air, technological innovation driving cost reductions and enhanced monitoring capabilities, and an increasing public awareness of air pollution's health implications. The continuous sampling method and chemical pollutant monitoring segment are anticipated to maintain their strong lead, while the adoption of sophisticated outdoor monitors is likely to rise due to the broader application needs in public health and environmental monitoring.
Asia Pacific Air Quality Monitoring Market Company Market Share
Asia Pacific Air Quality Monitoring Market: A Comprehensive Report (2019-2033)
This comprehensive report provides an in-depth analysis of the Asia Pacific Air Quality Monitoring Market, covering the period from 2019 to 2033. It offers valuable insights into market dynamics, growth trends, dominant segments, key players, and emerging opportunities, empowering businesses to make informed strategic decisions. The market is segmented by sampling method (Continuous, Manual, Intermittent), pollutant type (Chemical, Physical, Biological), end-user (Residential & Commercial, Power Generation, Petrochemicals, Other), and product type (Indoor, Outdoor Monitor). The report projects a market valued at xx Million units by 2025 and forecasts robust growth until 2033.
Asia Pacific Air Quality Monitoring Market Dynamics & Structure
The Asia Pacific air quality monitoring market is characterized by a moderately concentrated landscape, with several multinational corporations and regional players competing for market share. Technological innovation, driven by advancements in sensor technology and data analytics, is a key driver. Stringent government regulations aimed at improving air quality across the region are further boosting market growth. However, high initial investment costs and the need for specialized expertise can present barriers to entry. The market is witnessing increasing M&A activity, with larger players acquiring smaller companies to expand their product portfolio and geographic reach.
- Market Concentration: Moderately concentrated, with a top 5 market share of approximately 60% in 2025.
- Technological Innovation: Advancements in sensor technology (e.g., miniaturization, improved accuracy), IoT integration, and AI-driven data analytics are key drivers.
- Regulatory Landscape: Stringent environmental regulations in countries like China, India, and South Korea are creating significant demand.
- Competitive Substitutes: Limited direct substitutes, but alternative methods for pollution control can indirectly impact market growth.
- End-User Demographics: Growing urbanization and industrialization are driving demand across various end-user segments.
- M&A Trends: A steady increase in mergers and acquisitions, with an estimated xx deals concluded between 2019 and 2024.
Asia Pacific Air Quality Monitoring Market Growth Trends & Insights
The Asia Pacific air quality monitoring market experienced significant growth during the historical period (2019-2024), driven by increasing environmental concerns, rising government investments in pollution control, and technological advancements. The market size is projected to expand at a Compound Annual Growth Rate (CAGR) of xx% during the forecast period (2025-2033), reaching xx Million units by 2033. This growth is fueled by increased adoption of continuous monitoring systems, expanding awareness of air pollution's health impacts, and the proliferation of smart city initiatives. Technological disruptions, such as the development of low-cost sensors and cloud-based data analytics platforms, are further accelerating market adoption. Consumer behavior shifts towards greater environmental consciousness are also contributing to the market's expansion. Market penetration is expected to increase significantly, especially in developing economies with rapidly growing industrial sectors. The continuous monitoring segment is expected to witness the highest growth, driven by its ability to provide real-time data for effective pollution management.
Dominant Regions, Countries, or Segments in Asia Pacific Air Quality Monitoring Market
China and India are currently the dominant markets, driven by high levels of air pollution and significant government investment in air quality improvement initiatives. The Continuous sampling method segment holds the largest market share, owing to its ability to provide real-time data and facilitate proactive measures. Chemical pollutants constitute the most significant segment within the pollutant type category, reflecting the prevalence of industrial emissions and vehicular exhaust. The Power Generation and Petrochemicals end-user segments are significant contributors to market growth, driven by regulatory requirements and the need for stringent emission monitoring.
- Key Drivers in China: Stringent environmental regulations, significant investments in infrastructure development, and a growing awareness of air pollution's health impacts.
- Key Drivers in India: Government initiatives like the National Clean Air Programme (NCAP), increasing industrialization, and rising environmental awareness.
- Continuous Sampling Method Dominance: Real-time monitoring capabilities, proactive pollution management, and improved data accuracy.
- Chemical Pollutants Segment: High prevalence of industrial emissions and vehicular exhaust, leading to a high demand for monitoring solutions.
- Power Generation and Petrochemicals End-User Growth: Stringent emission regulations and the need for continuous monitoring for compliance.
Asia Pacific Air Quality Monitoring Market Product Landscape
The Asia Pacific air quality monitoring market features a wide range of products, including portable and stationary monitors, network-enabled systems, and advanced analytical tools. Recent product innovations focus on enhancing sensor accuracy, improving data analysis capabilities, and developing more user-friendly interfaces. Many manufacturers are emphasizing the development of IoT-enabled devices for remote monitoring and data management. The unique selling propositions often revolve around ease of use, data accuracy, cost-effectiveness, and the integration of advanced analytical features.
Key Drivers, Barriers & Challenges in Asia Pacific Air Quality Monitoring Market
Key Drivers: Stringent government regulations, rising environmental awareness, increasing urbanization, technological advancements in sensor technology and data analytics, and growing investments in air quality infrastructure are driving market growth.
Key Challenges: High initial investment costs, the need for specialized expertise, data management complexities, and the lack of standardized monitoring protocols in some regions pose significant challenges. The inconsistent implementation of environmental regulations across different countries also creates complexities. Supply chain disruptions due to geopolitical factors can also affect market growth.
Emerging Opportunities in Asia Pacific Air Quality Monitoring Market
Emerging opportunities include the expansion into untapped markets in Southeast Asia, the development of integrated monitoring systems for smart cities, the application of AI and machine learning for predictive modeling, and the growth of subscription-based monitoring services. The rising adoption of IoT-enabled devices and cloud-based data platforms creates significant opportunities. The increasing demand for personalized air quality monitoring solutions for residential and commercial applications also presents a substantial growth avenue.
Growth Accelerators in the Asia Pacific Air Quality Monitoring Market Industry
Technological breakthroughs, such as the development of low-cost, high-accuracy sensors, are accelerating market growth. Strategic partnerships between sensor manufacturers, data analytics companies, and government agencies are fostering innovation and market expansion. Government incentives and subsidies are also stimulating market growth. The rising adoption of cloud-based data management solutions and the increasing investment in air quality research and development are further driving market expansion.
Key Players Shaping the Asia Pacific Air Quality Monitoring Market Market
- Honeywell International Inc
- Horiba Ltd
- Merck KGaA
- TSI Inc
- Thermo Fisher Scientific Inc
- Aeroqual Limited
- Emerson Electric Co
- Siemens AG
- Agilent Technologies Inc
- 3M Co
- Teledyne Technologies Inc
Notable Milestones in Asia Pacific Air Quality Monitoring Market Sector
- January 2023: India launched the Technology for Air Quality Monitoring System (AI-AQMS v1.0), significantly improving the country's monitoring capabilities.
- September 2022: The Asian Development Bank (ADB) launched the Asia Clean Blue Skies Program (ACBSP), boosting investments in air quality improvement projects across the region.
In-Depth Asia Pacific Air Quality Monitoring Market Outlook
The Asia Pacific air quality monitoring market is poised for significant growth, driven by ongoing technological advancements, increasing environmental regulations, and rising awareness of air pollution's health impacts. Strategic partnerships and government initiatives will continue to drive market expansion. The focus on developing cost-effective and user-friendly monitoring solutions will further broaden market access. This presents substantial opportunities for companies to capitalize on the growing demand for advanced air quality monitoring technologies.
Asia Pacific Air Quality Monitoring Market Segmentation
-
1. Product Type
- 1.1. Indoor Monitor
- 1.2. Outdoor Monitor
-
2. Sampling Method
- 2.1. Continuous
- 2.2. Manual
- 2.3. Intermittent
-
3. Pollutant Type
- 3.1. Chemical Pollutants
- 3.2. Physical Pollutants
- 3.3. Biological Pollutants
-
4. End User
- 4.1. Residential and Commercial
- 4.2. Power Generation
- 4.3. Petrochemicals
- 4.4. Other End Users
-
5. Geography
- 5.1. China
- 5.2. India
- 5.3. Japan
- 5.4. Singapore
- 5.5. Rest of Asia-Pacific
Asia Pacific Air Quality Monitoring Market Segmentation By Geography
- 1. China
- 2. India
- 3. Japan
- 4. Singapore
- 5. Rest of Asia Pacific
Asia Pacific Air Quality Monitoring Market Regional Market Share
Geographic Coverage of Asia Pacific Air Quality Monitoring Market
Asia Pacific Air Quality Monitoring Market REPORT HIGHLIGHTS
| Aspects | Details |
|---|---|
| Study Period | 2020-2034 |
| Base Year | 2025 |
| Estimated Year | 2026 |
| Forecast Period | 2026-2034 |
| Historical Period | 2020-2025 |
| Growth Rate | CAGR of 4.55% from 2020-2034 |
| Segmentation |
|
Table of Contents
- 1. Introduction
- 1.1. Research Scope
- 1.2. Market Segmentation
- 1.3. Research Objective
- 1.4. Definitions and Assumptions
- 2. Executive Summary
- 2.1. Market Snapshot
- 3. Market Dynamics
- 3.1. Market Drivers
- 3.2. Market Restrains
- 3.3. Market Trends
- 3.4. Market Opportunities
- 4. Market Factor Analysis
- 4.1. Porters Five Forces
- 4.1.1. Bargaining Power of Suppliers
- 4.1.2. Bargaining Power of Buyers
- 4.1.3. Threat of New Entrants
- 4.1.4. Threat of Substitutes
- 4.1.5. Competitive Rivalry
- 4.2. PESTEL analysis
- 4.3. BCG Analysis
- 4.3.1. Stars (High Growth, High Market Share)
- 4.3.2. Cash Cows (Low Growth, High Market Share)
- 4.3.3. Question Mark (High Growth, Low Market Share)
- 4.3.4. Dogs (Low Growth, Low Market Share)
- 4.4. Ansoff Matrix Analysis
- 4.5. Supply Chain Analysis
- 4.6. Regulatory Landscape
- 4.7. Current Market Potential and Opportunity Assessment (TAM–SAM–SOM Framework)
- 4.8. VDR Analyst Note
- 4.1. Porters Five Forces
- 5. Market Analysis, Insights and Forecast 2021-2033
- 5.1. Market Analysis, Insights and Forecast - by Product Type
- 5.1.1. Indoor Monitor
- 5.1.2. Outdoor Monitor
- 5.2. Market Analysis, Insights and Forecast - by Sampling Method
- 5.2.1. Continuous
- 5.2.2. Manual
- 5.2.3. Intermittent
- 5.3. Market Analysis, Insights and Forecast - by Pollutant Type
- 5.3.1. Chemical Pollutants
- 5.3.2. Physical Pollutants
- 5.3.3. Biological Pollutants
- 5.4. Market Analysis, Insights and Forecast - by End User
- 5.4.1. Residential and Commercial
- 5.4.2. Power Generation
- 5.4.3. Petrochemicals
- 5.4.4. Other End Users
- 5.5. Market Analysis, Insights and Forecast - by Geography
- 5.5.1. China
- 5.5.2. India
- 5.5.3. Japan
- 5.5.4. Singapore
- 5.5.5. Rest of Asia-Pacific
- 5.6. Market Analysis, Insights and Forecast - by Region
- 5.6.1. China
- 5.6.2. India
- 5.6.3. Japan
- 5.6.4. Singapore
- 5.6.5. Rest of Asia Pacific
- 5.1. Market Analysis, Insights and Forecast - by Product Type
- 6. Asia Pacific Air Quality Monitoring Market Analysis, Insights and Forecast, 2021-2033
- 6.1. Market Analysis, Insights and Forecast - by Product Type
- 6.1.1. Indoor Monitor
- 6.1.2. Outdoor Monitor
- 6.2. Market Analysis, Insights and Forecast - by Sampling Method
- 6.2.1. Continuous
- 6.2.2. Manual
- 6.2.3. Intermittent
- 6.3. Market Analysis, Insights and Forecast - by Pollutant Type
- 6.3.1. Chemical Pollutants
- 6.3.2. Physical Pollutants
- 6.3.3. Biological Pollutants
- 6.4. Market Analysis, Insights and Forecast - by End User
- 6.4.1. Residential and Commercial
- 6.4.2. Power Generation
- 6.4.3. Petrochemicals
- 6.4.4. Other End Users
- 6.5. Market Analysis, Insights and Forecast - by Geography
- 6.5.1. China
- 6.5.2. India
- 6.5.3. Japan
- 6.5.4. Singapore
- 6.5.5. Rest of Asia-Pacific
- 6.1. Market Analysis, Insights and Forecast - by Product Type
- 7. China Asia Pacific Air Quality Monitoring Market Analysis, Insights and Forecast, 2021-2033
- 7.1. Market Analysis, Insights and Forecast - by Product Type
- 7.1.1. Indoor Monitor
- 7.1.2. Outdoor Monitor
- 7.2. Market Analysis, Insights and Forecast - by Sampling Method
- 7.2.1. Continuous
- 7.2.2. Manual
- 7.2.3. Intermittent
- 7.3. Market Analysis, Insights and Forecast - by Pollutant Type
- 7.3.1. Chemical Pollutants
- 7.3.2. Physical Pollutants
- 7.3.3. Biological Pollutants
- 7.4. Market Analysis, Insights and Forecast - by End User
- 7.4.1. Residential and Commercial
- 7.4.2. Power Generation
- 7.4.3. Petrochemicals
- 7.4.4. Other End Users
- 7.5. Market Analysis, Insights and Forecast - by Geography
- 7.5.1. China
- 7.5.2. India
- 7.5.3. Japan
- 7.5.4. Singapore
- 7.5.5. Rest of Asia-Pacific
- 7.1. Market Analysis, Insights and Forecast - by Product Type
- 8. India Asia Pacific Air Quality Monitoring Market Analysis, Insights and Forecast, 2021-2033
- 8.1. Market Analysis, Insights and Forecast - by Product Type
- 8.1.1. Indoor Monitor
- 8.1.2. Outdoor Monitor
- 8.2. Market Analysis, Insights and Forecast - by Sampling Method
- 8.2.1. Continuous
- 8.2.2. Manual
- 8.2.3. Intermittent
- 8.3. Market Analysis, Insights and Forecast - by Pollutant Type
- 8.3.1. Chemical Pollutants
- 8.3.2. Physical Pollutants
- 8.3.3. Biological Pollutants
- 8.4. Market Analysis, Insights and Forecast - by End User
- 8.4.1. Residential and Commercial
- 8.4.2. Power Generation
- 8.4.3. Petrochemicals
- 8.4.4. Other End Users
- 8.5. Market Analysis, Insights and Forecast - by Geography
- 8.5.1. China
- 8.5.2. India
- 8.5.3. Japan
- 8.5.4. Singapore
- 8.5.5. Rest of Asia-Pacific
- 8.1. Market Analysis, Insights and Forecast - by Product Type
- 9. Japan Asia Pacific Air Quality Monitoring Market Analysis, Insights and Forecast, 2021-2033
- 9.1. Market Analysis, Insights and Forecast - by Product Type
- 9.1.1. Indoor Monitor
- 9.1.2. Outdoor Monitor
- 9.2. Market Analysis, Insights and Forecast - by Sampling Method
- 9.2.1. Continuous
- 9.2.2. Manual
- 9.2.3. Intermittent
- 9.3. Market Analysis, Insights and Forecast - by Pollutant Type
- 9.3.1. Chemical Pollutants
- 9.3.2. Physical Pollutants
- 9.3.3. Biological Pollutants
- 9.4. Market Analysis, Insights and Forecast - by End User
- 9.4.1. Residential and Commercial
- 9.4.2. Power Generation
- 9.4.3. Petrochemicals
- 9.4.4. Other End Users
- 9.5. Market Analysis, Insights and Forecast - by Geography
- 9.5.1. China
- 9.5.2. India
- 9.5.3. Japan
- 9.5.4. Singapore
- 9.5.5. Rest of Asia-Pacific
- 9.1. Market Analysis, Insights and Forecast - by Product Type
- 10. Singapore Asia Pacific Air Quality Monitoring Market Analysis, Insights and Forecast, 2021-2033
- 10.1. Market Analysis, Insights and Forecast - by Product Type
- 10.1.1. Indoor Monitor
- 10.1.2. Outdoor Monitor
- 10.2. Market Analysis, Insights and Forecast - by Sampling Method
- 10.2.1. Continuous
- 10.2.2. Manual
- 10.2.3. Intermittent
- 10.3. Market Analysis, Insights and Forecast - by Pollutant Type
- 10.3.1. Chemical Pollutants
- 10.3.2. Physical Pollutants
- 10.3.3. Biological Pollutants
- 10.4. Market Analysis, Insights and Forecast - by End User
- 10.4.1. Residential and Commercial
- 10.4.2. Power Generation
- 10.4.3. Petrochemicals
- 10.4.4. Other End Users
- 10.5. Market Analysis, Insights and Forecast - by Geography
- 10.5.1. China
- 10.5.2. India
- 10.5.3. Japan
- 10.5.4. Singapore
- 10.5.5. Rest of Asia-Pacific
- 10.1. Market Analysis, Insights and Forecast - by Product Type
- 11. Rest of Asia Pacific Asia Pacific Air Quality Monitoring Market Analysis, Insights and Forecast, 2021-2033
- 11.1. Market Analysis, Insights and Forecast - by Product Type
- 11.1.1. Indoor Monitor
- 11.1.2. Outdoor Monitor
- 11.2. Market Analysis, Insights and Forecast - by Sampling Method
- 11.2.1. Continuous
- 11.2.2. Manual
- 11.2.3. Intermittent
- 11.3. Market Analysis, Insights and Forecast - by Pollutant Type
- 11.3.1. Chemical Pollutants
- 11.3.2. Physical Pollutants
- 11.3.3. Biological Pollutants
- 11.4. Market Analysis, Insights and Forecast - by End User
- 11.4.1. Residential and Commercial
- 11.4.2. Power Generation
- 11.4.3. Petrochemicals
- 11.4.4. Other End Users
- 11.5. Market Analysis, Insights and Forecast - by Geography
- 11.5.1. China
- 11.5.2. India
- 11.5.3. Japan
- 11.5.4. Singapore
- 11.5.5. Rest of Asia-Pacific
- 11.1. Market Analysis, Insights and Forecast - by Product Type
- 12. Competitive Analysis
- 12.1. Company Profiles
- 12.1.1 Honeywell International Inc
- 12.1.1.1. Company Overview
- 12.1.1.2. Products
- 12.1.1.3. Company Financials
- 12.1.1.4. SWOT Analysis
- 12.1.2 Horiba Ltd
- 12.1.2.1. Company Overview
- 12.1.2.2. Products
- 12.1.2.3. Company Financials
- 12.1.2.4. SWOT Analysis
- 12.1.3 Merck KGaA
- 12.1.3.1. Company Overview
- 12.1.3.2. Products
- 12.1.3.3. Company Financials
- 12.1.3.4. SWOT Analysis
- 12.1.4 TSI Inc
- 12.1.4.1. Company Overview
- 12.1.4.2. Products
- 12.1.4.3. Company Financials
- 12.1.4.4. SWOT Analysis
- 12.1.5 Thermo Fisher Scientific Inc
- 12.1.5.1. Company Overview
- 12.1.5.2. Products
- 12.1.5.3. Company Financials
- 12.1.5.4. SWOT Analysis
- 12.1.6 Aeroqual Limited*List Not Exhaustive
- 12.1.6.1. Company Overview
- 12.1.6.2. Products
- 12.1.6.3. Company Financials
- 12.1.6.4. SWOT Analysis
- 12.1.7 Emerson Electric Co
- 12.1.7.1. Company Overview
- 12.1.7.2. Products
- 12.1.7.3. Company Financials
- 12.1.7.4. SWOT Analysis
- 12.1.8 Siemens AG
- 12.1.8.1. Company Overview
- 12.1.8.2. Products
- 12.1.8.3. Company Financials
- 12.1.8.4. SWOT Analysis
- 12.1.9 Agilent Technologies Inc
- 12.1.9.1. Company Overview
- 12.1.9.2. Products
- 12.1.9.3. Company Financials
- 12.1.9.4. SWOT Analysis
- 12.1.10 3M Co
- 12.1.10.1. Company Overview
- 12.1.10.2. Products
- 12.1.10.3. Company Financials
- 12.1.10.4. SWOT Analysis
- 12.1.11 Teledyne Technologies Inc
- 12.1.11.1. Company Overview
- 12.1.11.2. Products
- 12.1.11.3. Company Financials
- 12.1.11.4. SWOT Analysis
- 12.1.1 Honeywell International Inc
- 12.2. Market Entropy
- 12.2.1 Company's Key Areas Served
- 12.2.2 Recent Developments
- 12.3. Company Market Share Analysis 2025
- 12.3.1 Top 5 Companies Market Share Analysis
- 12.3.2 Top 3 Companies Market Share Analysis
- 12.4. List of Potential Customers
- 13. Research Methodology
List of Figures
- Figure 1: Asia Pacific Air Quality Monitoring Market Revenue Breakdown (Million, %) by Product 2025 & 2033
- Figure 2: Asia Pacific Air Quality Monitoring Market Share (%) by Company 2025
List of Tables
- Table 1: Asia Pacific Air Quality Monitoring Market Revenue Million Forecast, by Product Type 2020 & 2033
- Table 2: Asia Pacific Air Quality Monitoring Market Revenue Million Forecast, by Sampling Method 2020 & 2033
- Table 3: Asia Pacific Air Quality Monitoring Market Revenue Million Forecast, by Pollutant Type 2020 & 2033
- Table 4: Asia Pacific Air Quality Monitoring Market Revenue Million Forecast, by End User 2020 & 2033
- Table 5: Asia Pacific Air Quality Monitoring Market Revenue Million Forecast, by Geography 2020 & 2033
- Table 6: Asia Pacific Air Quality Monitoring Market Revenue Million Forecast, by Region 2020 & 2033
- Table 7: Asia Pacific Air Quality Monitoring Market Revenue Million Forecast, by Product Type 2020 & 2033
- Table 8: Asia Pacific Air Quality Monitoring Market Revenue Million Forecast, by Sampling Method 2020 & 2033
- Table 9: Asia Pacific Air Quality Monitoring Market Revenue Million Forecast, by Pollutant Type 2020 & 2033
- Table 10: Asia Pacific Air Quality Monitoring Market Revenue Million Forecast, by End User 2020 & 2033
- Table 11: Asia Pacific Air Quality Monitoring Market Revenue Million Forecast, by Geography 2020 & 2033
- Table 12: Asia Pacific Air Quality Monitoring Market Revenue Million Forecast, by Country 2020 & 2033
- Table 13: Asia Pacific Air Quality Monitoring Market Revenue Million Forecast, by Product Type 2020 & 2033
- Table 14: Asia Pacific Air Quality Monitoring Market Revenue Million Forecast, by Sampling Method 2020 & 2033
- Table 15: Asia Pacific Air Quality Monitoring Market Revenue Million Forecast, by Pollutant Type 2020 & 2033
- Table 16: Asia Pacific Air Quality Monitoring Market Revenue Million Forecast, by End User 2020 & 2033
- Table 17: Asia Pacific Air Quality Monitoring Market Revenue Million Forecast, by Geography 2020 & 2033
- Table 18: Asia Pacific Air Quality Monitoring Market Revenue Million Forecast, by Country 2020 & 2033
- Table 19: Asia Pacific Air Quality Monitoring Market Revenue Million Forecast, by Product Type 2020 & 2033
- Table 20: Asia Pacific Air Quality Monitoring Market Revenue Million Forecast, by Sampling Method 2020 & 2033
- Table 21: Asia Pacific Air Quality Monitoring Market Revenue Million Forecast, by Pollutant Type 2020 & 2033
- Table 22: Asia Pacific Air Quality Monitoring Market Revenue Million Forecast, by End User 2020 & 2033
- Table 23: Asia Pacific Air Quality Monitoring Market Revenue Million Forecast, by Geography 2020 & 2033
- Table 24: Asia Pacific Air Quality Monitoring Market Revenue Million Forecast, by Country 2020 & 2033
- Table 25: Asia Pacific Air Quality Monitoring Market Revenue Million Forecast, by Product Type 2020 & 2033
- Table 26: Asia Pacific Air Quality Monitoring Market Revenue Million Forecast, by Sampling Method 2020 & 2033
- Table 27: Asia Pacific Air Quality Monitoring Market Revenue Million Forecast, by Pollutant Type 2020 & 2033
- Table 28: Asia Pacific Air Quality Monitoring Market Revenue Million Forecast, by End User 2020 & 2033
- Table 29: Asia Pacific Air Quality Monitoring Market Revenue Million Forecast, by Geography 2020 & 2033
- Table 30: Asia Pacific Air Quality Monitoring Market Revenue Million Forecast, by Country 2020 & 2033
- Table 31: Asia Pacific Air Quality Monitoring Market Revenue Million Forecast, by Product Type 2020 & 2033
- Table 32: Asia Pacific Air Quality Monitoring Market Revenue Million Forecast, by Sampling Method 2020 & 2033
- Table 33: Asia Pacific Air Quality Monitoring Market Revenue Million Forecast, by Pollutant Type 2020 & 2033
- Table 34: Asia Pacific Air Quality Monitoring Market Revenue Million Forecast, by End User 2020 & 2033
- Table 35: Asia Pacific Air Quality Monitoring Market Revenue Million Forecast, by Geography 2020 & 2033
- Table 36: Asia Pacific Air Quality Monitoring Market Revenue Million Forecast, by Country 2020 & 2033
Frequently Asked Questions
1. What is the projected Compound Annual Growth Rate (CAGR) of the Asia Pacific Air Quality Monitoring Market?
The projected CAGR is approximately 4.55%.
2. Which companies are prominent players in the Asia Pacific Air Quality Monitoring Market?
Key companies in the market include Honeywell International Inc, Horiba Ltd, Merck KGaA, TSI Inc, Thermo Fisher Scientific Inc, Aeroqual Limited*List Not Exhaustive, Emerson Electric Co, Siemens AG, Agilent Technologies Inc, 3M Co, Teledyne Technologies Inc.
3. What are the main segments of the Asia Pacific Air Quality Monitoring Market?
The market segments include Product Type, Sampling Method, Pollutant Type, End User, Geography.
4. Can you provide details about the market size?
The market size is estimated to be USD 77.40 Million as of 2022.
5. What are some drivers contributing to market growth?
4.; Increasing Awareness and Favorable Government Policies and Non-government Initiatives for Curbing Air Pollution.
6. What are the notable trends driving market growth?
Outdoor Segment to Witness Significant Growth.
7. Are there any restraints impacting market growth?
4.; High Costs of Air Quality Monitoring Systems.
8. Can you provide examples of recent developments in the market?
Januaru 2023: The government of India launched the Technology for Air Quality Monitoring System (AI-AQMS v1.0) developed under MeitY-supported projects. The Centre for Development of Advanced Computing (C-DAC), Kolkata, in partnership with TeXMIN, ISM, Dhanbad under the ‘National program on Electronics and ICT applications in Agriculture and Environment (AgriEnIcs)’ has developed an outdoor air quality monitoring station to monitor environmental pollutants which includes parameters like PM 1.0, PM 2.5, PM 10.0, SO2, NO2, CO, O2, ambient temperature, relative humidity etc., for continuous air quality analysis of the environment.
9. What pricing options are available for accessing the report?
Pricing options include single-user, multi-user, and enterprise licenses priced at USD 4750, USD 5250, and USD 8750 respectively.
10. Is the market size provided in terms of value or volume?
The market size is provided in terms of value, measured in Million.
11. Are there any specific market keywords associated with the report?
Yes, the market keyword associated with the report is "Asia Pacific Air Quality Monitoring Market," which aids in identifying and referencing the specific market segment covered.
12. How do I determine which pricing option suits my needs best?
The pricing options vary based on user requirements and access needs. Individual users may opt for single-user licenses, while businesses requiring broader access may choose multi-user or enterprise licenses for cost-effective access to the report.
13. Are there any additional resources or data provided in the Asia Pacific Air Quality Monitoring Market report?
While the report offers comprehensive insights, it's advisable to review the specific contents or supplementary materials provided to ascertain if additional resources or data are available.
14. How can I stay updated on further developments or reports in the Asia Pacific Air Quality Monitoring Market?
To stay informed about further developments, trends, and reports in the Asia Pacific Air Quality Monitoring Market, consider subscribing to industry newsletters, following relevant companies and organizations, or regularly checking reputable industry news sources and publications.
Methodology
Step 1 - Identification of Relevant Samples Size from Population Database


Step 2 - Approaches for Defining Global Market Size (Value, Volume* & Price*)

Note*: In applicable scenarios
Step 3 - Data Sources
Primary Research
- Web Analytics
- Survey Reports
- Research Institute
- Latest Research Reports
- Opinion Leaders
Secondary Research
- Annual Reports
- White Paper
- Latest Press Release
- Industry Association
- Paid Database
- Investor Presentations

Step 4 - Data Triangulation
Involves using different sources of information in order to increase the validity of a study
These sources are likely to be stakeholders in a program - participants, other researchers, program staff, other community members, and so on.
Then we put all data in single framework & apply various statistical tools to find out the dynamic on the market.
During the analysis stage, feedback from the stakeholder groups would be compared to determine areas of agreement as well as areas of divergence