

Key Insights
The ASEAN energy storage market, encompassing countries like Indonesia, Singapore, Thailand, the Philippines, and others, presents a significant growth opportunity. Driven by increasing electricity demand, renewable energy integration (solar and wind power), and the need for grid stabilization, the market is projected to experience robust expansion. The rising adoption of electric vehicles (EVs) further fuels this demand, necessitating efficient energy storage solutions for both residential and commercial applications. While battery energy storage systems (BESS) currently dominate the market due to their scalability and technological advancements, pumped-hydro storage remains a significant player, particularly in projects with large-scale energy storage requirements. The region's diverse geographical landscape and varying energy mixes influence the specific technologies adopted across different countries. For example, island nations might favor BESS for their grid resilience, while larger countries with suitable geography might prioritize pumped hydro.
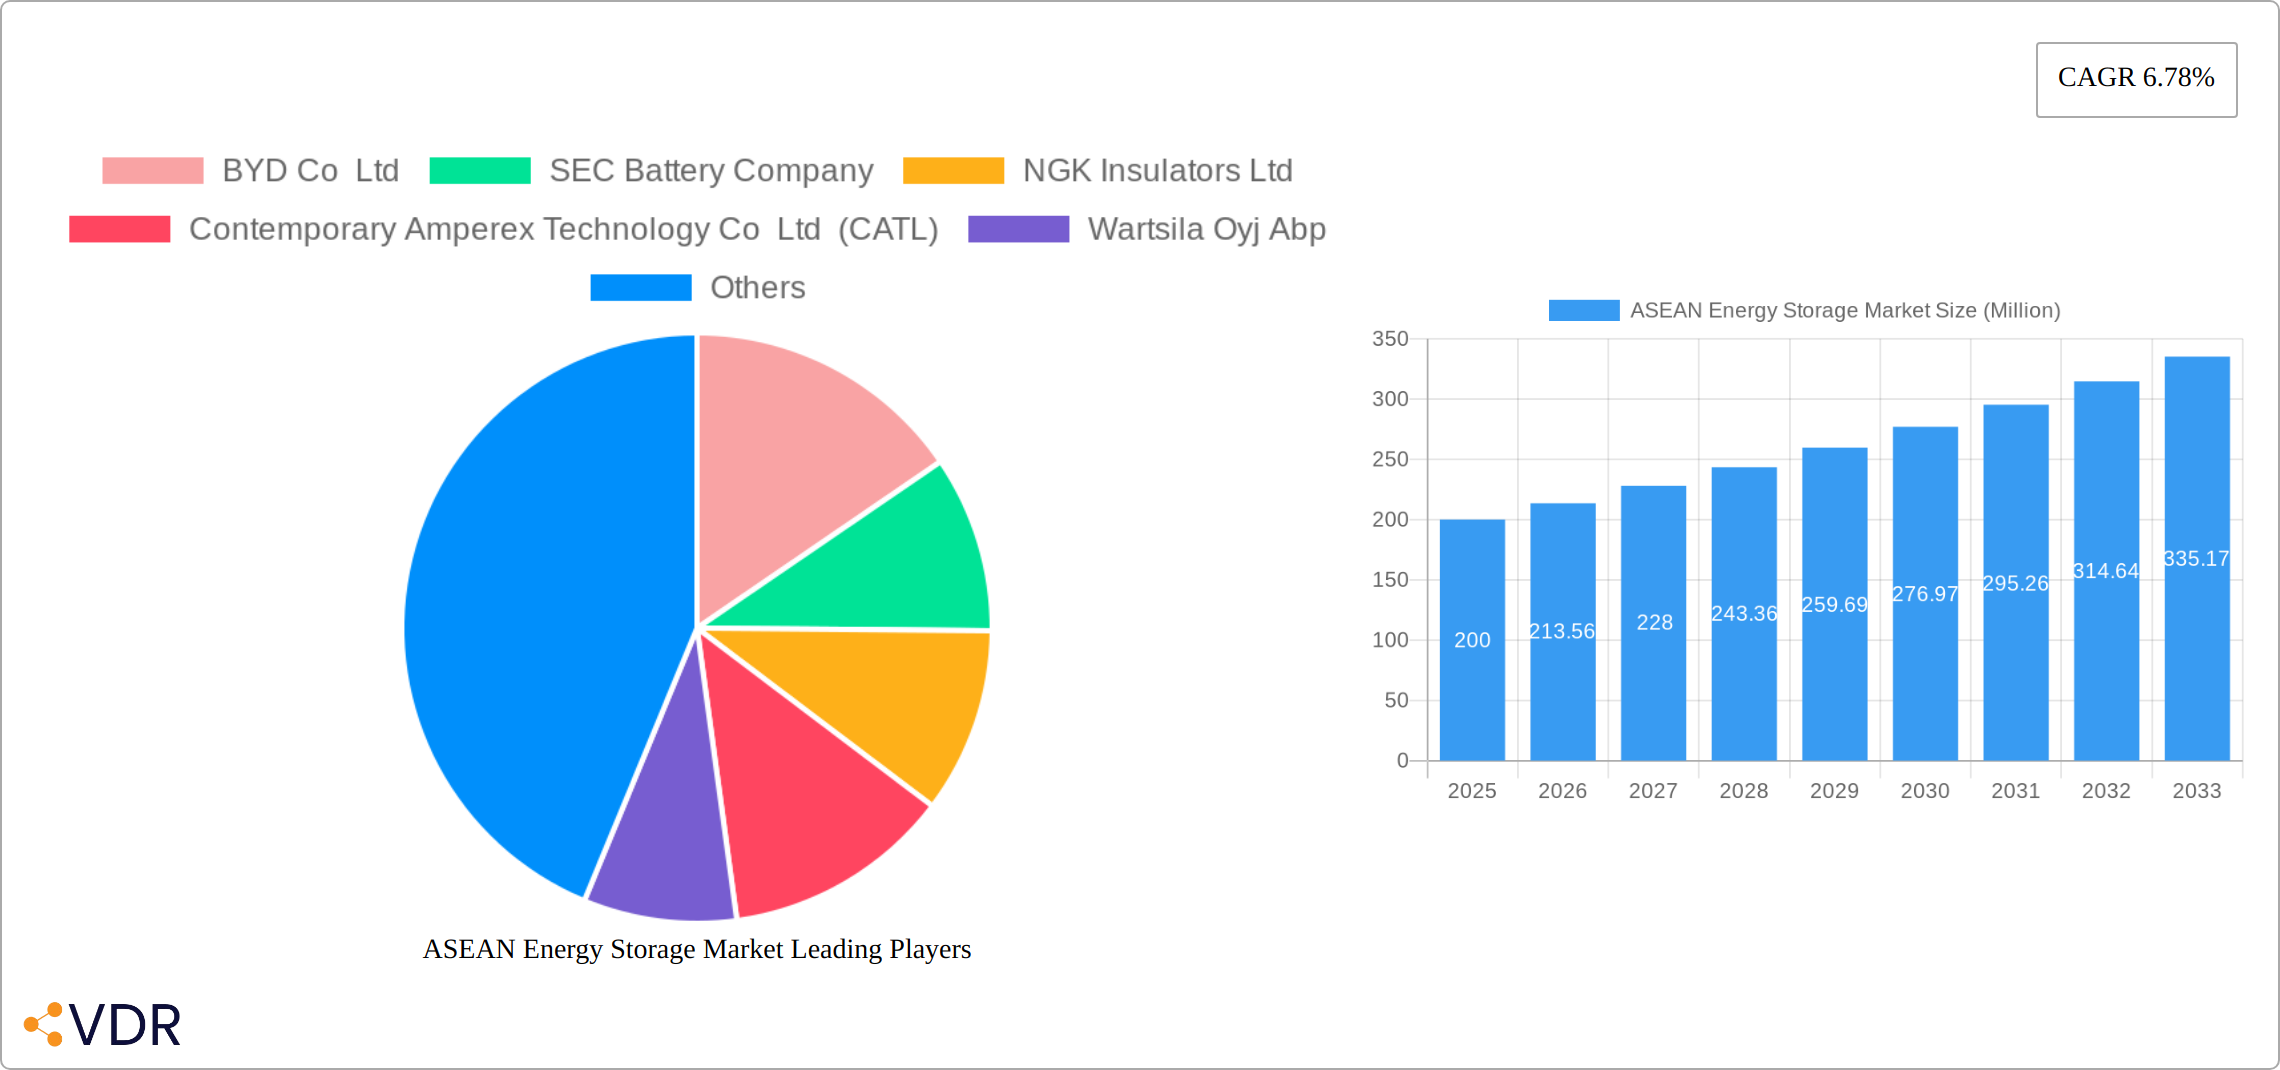
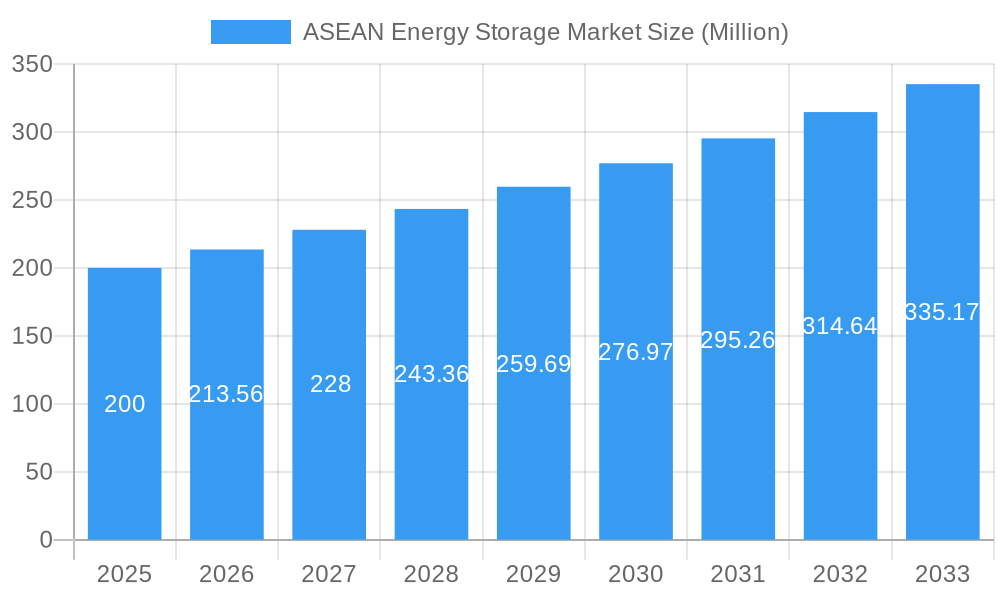
ASEAN Energy Storage Market Market Size (In Million)
Government initiatives promoting renewable energy adoption and energy efficiency are key drivers. However, challenges remain, including high initial capital costs for energy storage technologies, the need for improved grid infrastructure to accommodate the integration of these systems, and the development of a robust regulatory framework to manage the growing energy storage sector. Despite these challenges, the long-term outlook for the ASEAN energy storage market remains positive, with a projected CAGR exceeding the global average, indicating a significant untapped potential for investment and growth. The presence of major global players like CATL, BYD, and LG Chem, alongside regional companies, demonstrates the growing interest and competitiveness of the ASEAN market.
ASEAN Energy Storage Market Company Market Share
ASEAN Energy Storage Market: A Comprehensive Market Report (2019-2033)
This in-depth report provides a comprehensive analysis of the ASEAN energy storage market, covering market dynamics, growth trends, key players, and future outlook. With a focus on both the parent market (Energy Storage) and child markets (Pumped-Hydro Storage, Battery Energy Storage Systems, Other Types; Residential, Commercial & Industrial Applications), this report is an invaluable resource for industry professionals, investors, and policymakers. The study period spans from 2019 to 2033, with 2025 serving as the base and estimated year. The report quantifies the market in Million Units.
Study Period: 2019–2033 Base Year: 2025 Estimated Year: 2025 Forecast Period: 2025–2033 Historical Period: 2019–2024
ASEAN Energy Storage Market Dynamics & Structure
This section delves into the intricate structure of the ASEAN energy storage market, analyzing market concentration, technological innovation drivers, regulatory frameworks, competitive product substitutes, end-user demographics, and M&A trends.
The ASEAN energy storage market exhibits a moderately concentrated structure with several key players holding significant market share. The market is characterized by intense competition, driven by technological advancements and evolving regulatory landscapes across different ASEAN nations. While Battery Energy Storage Systems (BESS) currently dominate, Pumped-Hydro Storage retains a significant share, particularly in countries with suitable geographical conditions. Other types of energy storage are also emerging, albeit at a smaller scale.
- Market Concentration: xx% held by top 5 players (estimated).
- Technological Innovation: Focus on improving energy density, reducing costs, and enhancing lifespan of battery technologies. Significant R&D investments in solid-state batteries and advanced pumped-hydro solutions.
- Regulatory Frameworks: Vary significantly across ASEAN nations, influencing investment decisions and market growth trajectories. Incentives for renewable energy integration are driving demand for energy storage.
- Competitive Product Substitutes: Traditional grid infrastructure and fossil fuel-based power generation remain dominant competitors. However, the increasing costs associated with these solutions are fostering the adoption of energy storage.
- End-User Demographics: Commercial and Industrial sectors are primary drivers, with residential applications showing increasing adoption. Government initiatives are creating significant demand from the public sector.
- M&A Trends: Moderate M&A activity observed, primarily focused on strategic partnerships and technology acquisitions. Estimated xx M&A deals in the past 5 years.
ASEAN Energy Storage Market Growth Trends & Insights
The ASEAN energy storage market is experiencing explosive growth, driven by a confluence of factors including the rapid integration of renewable energy sources, ambitious grid modernization plans, and supportive government policies across the region. Market projections indicate a robust Compound Annual Growth Rate (CAGR) exceeding [Insert Updated CAGR Percentage]% during the forecast period (2025-2033), significantly outpacing global averages. This surge is fueled by several key factors: soaring electricity demand, escalating concerns over energy security and resilience, and the urgent need to mitigate climate change impacts. Furthermore, continuous technological advancements, particularly in battery storage technology (e.g., lithium-ion, flow batteries), are dramatically reducing costs and improving performance, accelerating market expansion. Increasing consumer awareness of sustainability and the decreasing cost of energy storage solutions are also pivotal contributors to this growth trajectory.
The adoption rate of energy storage systems is accelerating across diverse sectors, including residential, commercial, and industrial applications, propelled by government incentives (tax breaks, subsidies), declining battery prices, and improved grid infrastructure. The market penetration rate is projected to reach [Insert Updated Penetration Percentage]% by 2033. Disruptive technological innovations, such as advancements in battery chemistries (solid-state, next-generation lithium-ion), improved energy management systems (smart grids, AI-powered optimization), and the development of hybrid energy storage solutions, are reshaping the market landscape and fostering wider adoption. A significant shift in consumer behavior towards renewable energy sources and energy efficiency practices further reinforces this positive growth trend, creating a virtuous cycle of demand and innovation.
Dominant Regions, Countries, or Segments in ASEAN Energy Storage Market
Within the ASEAN region, Indonesia, Vietnam, and Singapore are leading the energy storage market expansion. Among the segments, Battery Energy Storage Systems (BESS) holds the dominant market share, driven by falling battery costs and technological advancements. The Commercial and Industrial (C&I) sector is the largest application segment, followed by the residential sector, which is growing rapidly.
- Indonesia: Strong government support for renewable energy and grid modernization projects, coupled with the "de-dieselization" program, is driving significant demand.
- Vietnam: Government plans to double power generation capacity by 2030 necessitate large-scale energy storage investments.
- Singapore: Focus on grid stability and energy security is fueling the adoption of energy storage solutions.
- BESS Dominance: Cost reductions and technological advancements make BESS the preferred choice in many applications.
- C&I Sector Leadership: Larger-scale deployment compared to residential applications.
- Residential Sector Growth: Driven by increasing energy costs and rising awareness of sustainable living.
ASEAN Energy Storage Market Product Landscape
The ASEAN energy storage market features a diverse product landscape encompassing various technologies and applications. Key advancements include improved battery chemistries (e.g., lithium-ion, flow batteries), higher energy density, longer lifespans, and enhanced safety features. The market also witnesses the emergence of integrated energy storage systems incorporating smart grid technologies and advanced energy management capabilities. These systems provide optimized energy utilization, reducing costs and improving grid stability. Unique selling propositions are centered around cost-effectiveness, enhanced efficiency, and improved grid integration capabilities.
Key Drivers, Barriers & Challenges in ASEAN Energy Storage Market
Key Drivers:
- Renewable Energy Integration: The increasing penetration of intermittent renewable energy sources (solar, wind) necessitates reliable and efficient energy storage solutions to ensure grid stability and power supply consistency.
- Government Support: Numerous ASEAN governments are implementing supportive policies and financial incentives (e.g., feed-in tariffs, tax credits, grants) to promote the adoption of renewable energy and energy storage technologies.
- Rising Electricity Demand: Rapid economic growth and population increase are driving significant increases in electricity demand across ASEAN, necessitating the expansion of grid infrastructure, including energy storage capabilities.
- Energy Security and Resilience: Energy storage offers enhanced grid resilience and security against disruptions caused by extreme weather events or geopolitical instability.
Challenges and Restraints:
- High Initial Investment Costs: The high upfront capital costs of energy storage systems can be a barrier to wider adoption, especially in the residential sector. However, ongoing cost reductions are mitigating this challenge.
- Grid Infrastructure Limitations: Inadequate grid infrastructure in certain regions poses challenges to the effective integration and deployment of energy storage systems.
- Supply Chain Vulnerabilities: The reliance on global supply chains for key components (batteries, inverters) makes the ASEAN market susceptible to supply chain disruptions and price volatility.
- Regulatory Uncertainty: Inconsistent regulatory frameworks and policies across different ASEAN countries create uncertainty for investors and hinder large-scale deployment.
- Technical Expertise Gap: A shortage of skilled workforce in areas like installation, maintenance, and operation of energy storage systems can hamper market growth.
Emerging Opportunities in ASEAN Energy Storage Market
Untapped potential exists in the rural electrification sector using decentralized energy storage systems. The integration of energy storage with electric vehicles and microgrids presents significant opportunities. The growing demand for energy efficiency and smart grid technologies creates new markets for advanced energy storage solutions. Further research and development into cost-effective and high-performance battery technologies is needed to drive even faster adoption.
Growth Accelerators in the ASEAN Energy Storage Market Industry
Several key factors are accelerating the growth of the ASEAN energy storage market: breakthroughs in battery technology are driving down costs and improving performance; strategic collaborations between energy storage providers, renewable energy developers, and grid operators are fostering market expansion; supportive government policies and regulatory frameworks are creating a favorable investment climate; and the increasing emphasis on energy security and climate change mitigation is providing a powerful impetus for market growth. Furthermore, the emergence of innovative financing models (e.g., power purchase agreements, leasing) is making energy storage solutions more accessible.
Key Players Shaping the ASEAN Energy Storage Market Market
- BYD Co Ltd
- SEC Battery Company
- NGK Insulators Ltd
- Contemporary Amperex Technology Co Ltd (CATL)
- Wartsila Oyj Abp
- LG Chem Ltd
- GS Yuasa Corporation
- List Not Exhaustive
Notable Milestones in ASEAN Energy Storage Market Sector
- March 2022: Indonesian government launches a 5MW battery energy storage system (BESS) pilot project as part of its "de-dieselization" program.
- May 2022: Vietnam's government announces plans to double its power generation capacity by 2030, requiring significant energy storage investments.
In-Depth ASEAN Energy Storage Market Market Outlook
The ASEAN energy storage market is poised for robust growth driven by technological advancements, supportive government policies, and increasing demand for renewable energy integration. Strategic partnerships, investments in R&D, and the exploration of innovative applications will further shape the market landscape. The focus on sustainable energy solutions and the need for grid modernization will create significant opportunities for industry players in the coming years. The market is expected to see continued expansion across all segments, with BESS technologies continuing to lead.
ASEAN Energy Storage Market Segmentation
-
1. Type
- 1.1. Pumped-Hydro Storage
- 1.2. Battery Energy Storage Systems
- 1.3. Other Types
-
2. Application
- 2.1. Residential
- 2.2. Commercial and Industrial
-
3. Geography
- 3.1. Indonesia
- 3.2. Vietnam
- 3.3. Phillipines
- 3.4. Malaysia
- 3.5. Rest of ASEAN
ASEAN Energy Storage Market Segmentation By Geography
- 1. Indonesia
- 2. Vietnam
- 3. Phillipines
- 4. Malaysia
- 5. Rest of ASEAN
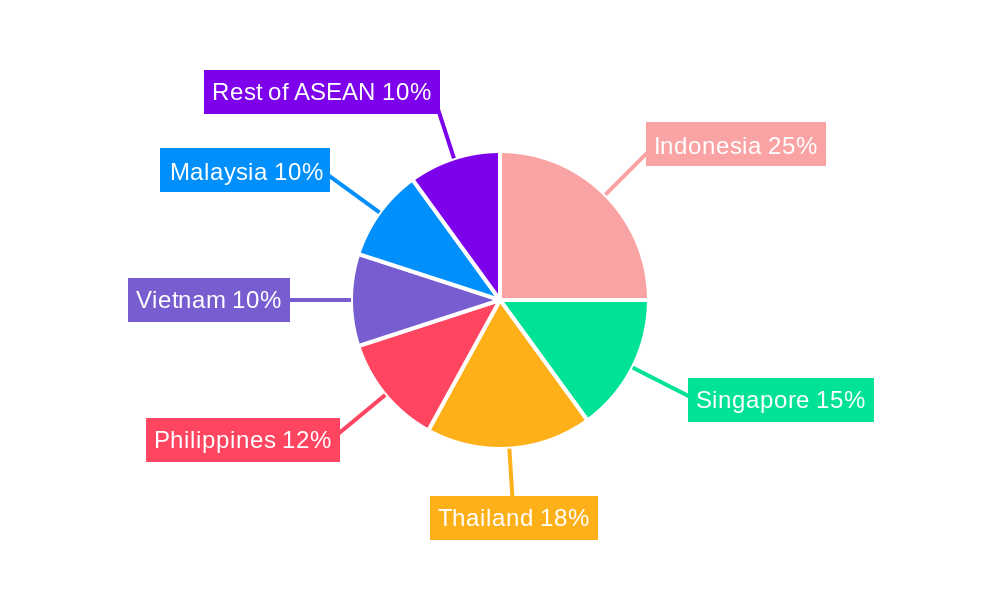
ASEAN Energy Storage Market Regional Market Share
Geographic Coverage of ASEAN Energy Storage Market
ASEAN Energy Storage Market REPORT HIGHLIGHTS
| Aspects | Details |
|---|---|
| Study Period | 2020-2034 |
| Base Year | 2025 |
| Estimated Year | 2026 |
| Forecast Period | 2026-2034 |
| Historical Period | 2020-2025 |
| Growth Rate | CAGR of 6.78% from 2020-2034 |
| Segmentation |
|
Table of Contents
- 1. Introduction
- 1.1. Research Scope
- 1.2. Market Segmentation
- 1.3. Research Objective
- 1.4. Definitions and Assumptions
- 2. Executive Summary
- 2.1. Market Snapshot
- 3. Market Dynamics
- 3.1. Market Drivers
- 3.2. Market Restrains
- 3.3. Market Trends
- 3.4. Market Opportunities
- 4. Market Factor Analysis
- 4.1. Porters Five Forces
- 4.1.1. Bargaining Power of Suppliers
- 4.1.2. Bargaining Power of Buyers
- 4.1.3. Threat of New Entrants
- 4.1.4. Threat of Substitutes
- 4.1.5. Competitive Rivalry
- 4.2. PESTEL analysis
- 4.3. BCG Analysis
- 4.3.1. Stars (High Growth, High Market Share)
- 4.3.2. Cash Cows (Low Growth, High Market Share)
- 4.3.3. Question Mark (High Growth, Low Market Share)
- 4.3.4. Dogs (Low Growth, Low Market Share)
- 4.4. Ansoff Matrix Analysis
- 4.5. Supply Chain Analysis
- 4.6. Regulatory Landscape
- 4.7. Current Market Potential and Opportunity Assessment (TAM–SAM–SOM Framework)
- 4.8. VDR Analyst Note
- 4.1. Porters Five Forces
- 5. Market Analysis, Insights and Forecast 2021-2033
- 5.1. Market Analysis, Insights and Forecast - by Type
- 5.1.1. Pumped-Hydro Storage
- 5.1.2. Battery Energy Storage Systems
- 5.1.3. Other Types
- 5.2. Market Analysis, Insights and Forecast - by Application
- 5.2.1. Residential
- 5.2.2. Commercial and Industrial
- 5.3. Market Analysis, Insights and Forecast - by Geography
- 5.3.1. Indonesia
- 5.3.2. Vietnam
- 5.3.3. Phillipines
- 5.3.4. Malaysia
- 5.3.5. Rest of ASEAN
- 5.4. Market Analysis, Insights and Forecast - by Region
- 5.4.1. Indonesia
- 5.4.2. Vietnam
- 5.4.3. Phillipines
- 5.4.4. Malaysia
- 5.4.5. Rest of ASEAN
- 5.1. Market Analysis, Insights and Forecast - by Type
- 6. Global ASEAN Energy Storage Market Analysis, Insights and Forecast, 2021-2033
- 6.1. Market Analysis, Insights and Forecast - by Type
- 6.1.1. Pumped-Hydro Storage
- 6.1.2. Battery Energy Storage Systems
- 6.1.3. Other Types
- 6.2. Market Analysis, Insights and Forecast - by Application
- 6.2.1. Residential
- 6.2.2. Commercial and Industrial
- 6.3. Market Analysis, Insights and Forecast - by Geography
- 6.3.1. Indonesia
- 6.3.2. Vietnam
- 6.3.3. Phillipines
- 6.3.4. Malaysia
- 6.3.5. Rest of ASEAN
- 6.1. Market Analysis, Insights and Forecast - by Type
- 7. Indonesia ASEAN Energy Storage Market Analysis, Insights and Forecast, 2021-2033
- 7.1. Market Analysis, Insights and Forecast - by Type
- 7.1.1. Pumped-Hydro Storage
- 7.1.2. Battery Energy Storage Systems
- 7.1.3. Other Types
- 7.2. Market Analysis, Insights and Forecast - by Application
- 7.2.1. Residential
- 7.2.2. Commercial and Industrial
- 7.3. Market Analysis, Insights and Forecast - by Geography
- 7.3.1. Indonesia
- 7.3.2. Vietnam
- 7.3.3. Phillipines
- 7.3.4. Malaysia
- 7.3.5. Rest of ASEAN
- 7.1. Market Analysis, Insights and Forecast - by Type
- 8. Vietnam ASEAN Energy Storage Market Analysis, Insights and Forecast, 2021-2033
- 8.1. Market Analysis, Insights and Forecast - by Type
- 8.1.1. Pumped-Hydro Storage
- 8.1.2. Battery Energy Storage Systems
- 8.1.3. Other Types
- 8.2. Market Analysis, Insights and Forecast - by Application
- 8.2.1. Residential
- 8.2.2. Commercial and Industrial
- 8.3. Market Analysis, Insights and Forecast - by Geography
- 8.3.1. Indonesia
- 8.3.2. Vietnam
- 8.3.3. Phillipines
- 8.3.4. Malaysia
- 8.3.5. Rest of ASEAN
- 8.1. Market Analysis, Insights and Forecast - by Type
- 9. Phillipines ASEAN Energy Storage Market Analysis, Insights and Forecast, 2021-2033
- 9.1. Market Analysis, Insights and Forecast - by Type
- 9.1.1. Pumped-Hydro Storage
- 9.1.2. Battery Energy Storage Systems
- 9.1.3. Other Types
- 9.2. Market Analysis, Insights and Forecast - by Application
- 9.2.1. Residential
- 9.2.2. Commercial and Industrial
- 9.3. Market Analysis, Insights and Forecast - by Geography
- 9.3.1. Indonesia
- 9.3.2. Vietnam
- 9.3.3. Phillipines
- 9.3.4. Malaysia
- 9.3.5. Rest of ASEAN
- 9.1. Market Analysis, Insights and Forecast - by Type
- 10. Malaysia ASEAN Energy Storage Market Analysis, Insights and Forecast, 2021-2033
- 10.1. Market Analysis, Insights and Forecast - by Type
- 10.1.1. Pumped-Hydro Storage
- 10.1.2. Battery Energy Storage Systems
- 10.1.3. Other Types
- 10.2. Market Analysis, Insights and Forecast - by Application
- 10.2.1. Residential
- 10.2.2. Commercial and Industrial
- 10.3. Market Analysis, Insights and Forecast - by Geography
- 10.3.1. Indonesia
- 10.3.2. Vietnam
- 10.3.3. Phillipines
- 10.3.4. Malaysia
- 10.3.5. Rest of ASEAN
- 10.1. Market Analysis, Insights and Forecast - by Type
- 11. Rest of ASEAN ASEAN Energy Storage Market Analysis, Insights and Forecast, 2021-2033
- 11.1. Market Analysis, Insights and Forecast - by Type
- 11.1.1. Pumped-Hydro Storage
- 11.1.2. Battery Energy Storage Systems
- 11.1.3. Other Types
- 11.2. Market Analysis, Insights and Forecast - by Application
- 11.2.1. Residential
- 11.2.2. Commercial and Industrial
- 11.3. Market Analysis, Insights and Forecast - by Geography
- 11.3.1. Indonesia
- 11.3.2. Vietnam
- 11.3.3. Phillipines
- 11.3.4. Malaysia
- 11.3.5. Rest of ASEAN
- 11.1. Market Analysis, Insights and Forecast - by Type
- 12. Competitive Analysis
- 12.1. Company Profiles
- 12.1.1 BYD Co Ltd
- 12.1.1.1. Company Overview
- 12.1.1.2. Products
- 12.1.1.3. Company Financials
- 12.1.1.4. SWOT Analysis
- 12.1.2 SEC Battery Company
- 12.1.2.1. Company Overview
- 12.1.2.2. Products
- 12.1.2.3. Company Financials
- 12.1.2.4. SWOT Analysis
- 12.1.3 NGK Insulators Ltd
- 12.1.3.1. Company Overview
- 12.1.3.2. Products
- 12.1.3.3. Company Financials
- 12.1.3.4. SWOT Analysis
- 12.1.4 Contemporary Amperex Technology Co Ltd (CATL)
- 12.1.4.1. Company Overview
- 12.1.4.2. Products
- 12.1.4.3. Company Financials
- 12.1.4.4. SWOT Analysis
- 12.1.5 Wartsila Oyj Abp
- 12.1.5.1. Company Overview
- 12.1.5.2. Products
- 12.1.5.3. Company Financials
- 12.1.5.4. SWOT Analysis
- 12.1.6 LG Chem Ltd *List Not Exhaustive
- 12.1.6.1. Company Overview
- 12.1.6.2. Products
- 12.1.6.3. Company Financials
- 12.1.6.4. SWOT Analysis
- 12.1.7 GS Yuasa Corporation
- 12.1.7.1. Company Overview
- 12.1.7.2. Products
- 12.1.7.3. Company Financials
- 12.1.7.4. SWOT Analysis
- 12.1.1 BYD Co Ltd
- 12.2. Market Entropy
- 12.2.1 Company's Key Areas Served
- 12.2.2 Recent Developments
- 12.3. Company Market Share Analysis 2025
- 12.3.1 Top 5 Companies Market Share Analysis
- 12.3.2 Top 3 Companies Market Share Analysis
- 12.4. List of Potential Customers
- 13. Research Methodology
List of Figures
- Figure 1: Global ASEAN Energy Storage Market Revenue Breakdown (Million, %) by Region 2025 & 2033
- Figure 2: Global ASEAN Energy Storage Market Volume Breakdown (K Unit, %) by Region 2025 & 2033
- Figure 3: Indonesia ASEAN Energy Storage Market Revenue (Million), by Type 2025 & 2033
- Figure 4: Indonesia ASEAN Energy Storage Market Volume (K Unit), by Type 2025 & 2033
- Figure 5: Indonesia ASEAN Energy Storage Market Revenue Share (%), by Type 2025 & 2033
- Figure 6: Indonesia ASEAN Energy Storage Market Volume Share (%), by Type 2025 & 2033
- Figure 7: Indonesia ASEAN Energy Storage Market Revenue (Million), by Application 2025 & 2033
- Figure 8: Indonesia ASEAN Energy Storage Market Volume (K Unit), by Application 2025 & 2033
- Figure 9: Indonesia ASEAN Energy Storage Market Revenue Share (%), by Application 2025 & 2033
- Figure 10: Indonesia ASEAN Energy Storage Market Volume Share (%), by Application 2025 & 2033
- Figure 11: Indonesia ASEAN Energy Storage Market Revenue (Million), by Geography 2025 & 2033
- Figure 12: Indonesia ASEAN Energy Storage Market Volume (K Unit), by Geography 2025 & 2033
- Figure 13: Indonesia ASEAN Energy Storage Market Revenue Share (%), by Geography 2025 & 2033
- Figure 14: Indonesia ASEAN Energy Storage Market Volume Share (%), by Geography 2025 & 2033
- Figure 15: Indonesia ASEAN Energy Storage Market Revenue (Million), by Country 2025 & 2033
- Figure 16: Indonesia ASEAN Energy Storage Market Volume (K Unit), by Country 2025 & 2033
- Figure 17: Indonesia ASEAN Energy Storage Market Revenue Share (%), by Country 2025 & 2033
- Figure 18: Indonesia ASEAN Energy Storage Market Volume Share (%), by Country 2025 & 2033
- Figure 19: Vietnam ASEAN Energy Storage Market Revenue (Million), by Type 2025 & 2033
- Figure 20: Vietnam ASEAN Energy Storage Market Volume (K Unit), by Type 2025 & 2033
- Figure 21: Vietnam ASEAN Energy Storage Market Revenue Share (%), by Type 2025 & 2033
- Figure 22: Vietnam ASEAN Energy Storage Market Volume Share (%), by Type 2025 & 2033
- Figure 23: Vietnam ASEAN Energy Storage Market Revenue (Million), by Application 2025 & 2033
- Figure 24: Vietnam ASEAN Energy Storage Market Volume (K Unit), by Application 2025 & 2033
- Figure 25: Vietnam ASEAN Energy Storage Market Revenue Share (%), by Application 2025 & 2033
- Figure 26: Vietnam ASEAN Energy Storage Market Volume Share (%), by Application 2025 & 2033
- Figure 27: Vietnam ASEAN Energy Storage Market Revenue (Million), by Geography 2025 & 2033
- Figure 28: Vietnam ASEAN Energy Storage Market Volume (K Unit), by Geography 2025 & 2033
- Figure 29: Vietnam ASEAN Energy Storage Market Revenue Share (%), by Geography 2025 & 2033
- Figure 30: Vietnam ASEAN Energy Storage Market Volume Share (%), by Geography 2025 & 2033
- Figure 31: Vietnam ASEAN Energy Storage Market Revenue (Million), by Country 2025 & 2033
- Figure 32: Vietnam ASEAN Energy Storage Market Volume (K Unit), by Country 2025 & 2033
- Figure 33: Vietnam ASEAN Energy Storage Market Revenue Share (%), by Country 2025 & 2033
- Figure 34: Vietnam ASEAN Energy Storage Market Volume Share (%), by Country 2025 & 2033
- Figure 35: Phillipines ASEAN Energy Storage Market Revenue (Million), by Type 2025 & 2033
- Figure 36: Phillipines ASEAN Energy Storage Market Volume (K Unit), by Type 2025 & 2033
- Figure 37: Phillipines ASEAN Energy Storage Market Revenue Share (%), by Type 2025 & 2033
- Figure 38: Phillipines ASEAN Energy Storage Market Volume Share (%), by Type 2025 & 2033
- Figure 39: Phillipines ASEAN Energy Storage Market Revenue (Million), by Application 2025 & 2033
- Figure 40: Phillipines ASEAN Energy Storage Market Volume (K Unit), by Application 2025 & 2033
- Figure 41: Phillipines ASEAN Energy Storage Market Revenue Share (%), by Application 2025 & 2033
- Figure 42: Phillipines ASEAN Energy Storage Market Volume Share (%), by Application 2025 & 2033
- Figure 43: Phillipines ASEAN Energy Storage Market Revenue (Million), by Geography 2025 & 2033
- Figure 44: Phillipines ASEAN Energy Storage Market Volume (K Unit), by Geography 2025 & 2033
- Figure 45: Phillipines ASEAN Energy Storage Market Revenue Share (%), by Geography 2025 & 2033
- Figure 46: Phillipines ASEAN Energy Storage Market Volume Share (%), by Geography 2025 & 2033
- Figure 47: Phillipines ASEAN Energy Storage Market Revenue (Million), by Country 2025 & 2033
- Figure 48: Phillipines ASEAN Energy Storage Market Volume (K Unit), by Country 2025 & 2033
- Figure 49: Phillipines ASEAN Energy Storage Market Revenue Share (%), by Country 2025 & 2033
- Figure 50: Phillipines ASEAN Energy Storage Market Volume Share (%), by Country 2025 & 2033
- Figure 51: Malaysia ASEAN Energy Storage Market Revenue (Million), by Type 2025 & 2033
- Figure 52: Malaysia ASEAN Energy Storage Market Volume (K Unit), by Type 2025 & 2033
- Figure 53: Malaysia ASEAN Energy Storage Market Revenue Share (%), by Type 2025 & 2033
- Figure 54: Malaysia ASEAN Energy Storage Market Volume Share (%), by Type 2025 & 2033
- Figure 55: Malaysia ASEAN Energy Storage Market Revenue (Million), by Application 2025 & 2033
- Figure 56: Malaysia ASEAN Energy Storage Market Volume (K Unit), by Application 2025 & 2033
- Figure 57: Malaysia ASEAN Energy Storage Market Revenue Share (%), by Application 2025 & 2033
- Figure 58: Malaysia ASEAN Energy Storage Market Volume Share (%), by Application 2025 & 2033
- Figure 59: Malaysia ASEAN Energy Storage Market Revenue (Million), by Geography 2025 & 2033
- Figure 60: Malaysia ASEAN Energy Storage Market Volume (K Unit), by Geography 2025 & 2033
- Figure 61: Malaysia ASEAN Energy Storage Market Revenue Share (%), by Geography 2025 & 2033
- Figure 62: Malaysia ASEAN Energy Storage Market Volume Share (%), by Geography 2025 & 2033
- Figure 63: Malaysia ASEAN Energy Storage Market Revenue (Million), by Country 2025 & 2033
- Figure 64: Malaysia ASEAN Energy Storage Market Volume (K Unit), by Country 2025 & 2033
- Figure 65: Malaysia ASEAN Energy Storage Market Revenue Share (%), by Country 2025 & 2033
- Figure 66: Malaysia ASEAN Energy Storage Market Volume Share (%), by Country 2025 & 2033
- Figure 67: Rest of ASEAN ASEAN Energy Storage Market Revenue (Million), by Type 2025 & 2033
- Figure 68: Rest of ASEAN ASEAN Energy Storage Market Volume (K Unit), by Type 2025 & 2033
- Figure 69: Rest of ASEAN ASEAN Energy Storage Market Revenue Share (%), by Type 2025 & 2033
- Figure 70: Rest of ASEAN ASEAN Energy Storage Market Volume Share (%), by Type 2025 & 2033
- Figure 71: Rest of ASEAN ASEAN Energy Storage Market Revenue (Million), by Application 2025 & 2033
- Figure 72: Rest of ASEAN ASEAN Energy Storage Market Volume (K Unit), by Application 2025 & 2033
- Figure 73: Rest of ASEAN ASEAN Energy Storage Market Revenue Share (%), by Application 2025 & 2033
- Figure 74: Rest of ASEAN ASEAN Energy Storage Market Volume Share (%), by Application 2025 & 2033
- Figure 75: Rest of ASEAN ASEAN Energy Storage Market Revenue (Million), by Geography 2025 & 2033
- Figure 76: Rest of ASEAN ASEAN Energy Storage Market Volume (K Unit), by Geography 2025 & 2033
- Figure 77: Rest of ASEAN ASEAN Energy Storage Market Revenue Share (%), by Geography 2025 & 2033
- Figure 78: Rest of ASEAN ASEAN Energy Storage Market Volume Share (%), by Geography 2025 & 2033
- Figure 79: Rest of ASEAN ASEAN Energy Storage Market Revenue (Million), by Country 2025 & 2033
- Figure 80: Rest of ASEAN ASEAN Energy Storage Market Volume (K Unit), by Country 2025 & 2033
- Figure 81: Rest of ASEAN ASEAN Energy Storage Market Revenue Share (%), by Country 2025 & 2033
- Figure 82: Rest of ASEAN ASEAN Energy Storage Market Volume Share (%), by Country 2025 & 2033
List of Tables
- Table 1: Global ASEAN Energy Storage Market Revenue Million Forecast, by Type 2020 & 2033
- Table 2: Global ASEAN Energy Storage Market Volume K Unit Forecast, by Type 2020 & 2033
- Table 3: Global ASEAN Energy Storage Market Revenue Million Forecast, by Application 2020 & 2033
- Table 4: Global ASEAN Energy Storage Market Volume K Unit Forecast, by Application 2020 & 2033
- Table 5: Global ASEAN Energy Storage Market Revenue Million Forecast, by Geography 2020 & 2033
- Table 6: Global ASEAN Energy Storage Market Volume K Unit Forecast, by Geography 2020 & 2033
- Table 7: Global ASEAN Energy Storage Market Revenue Million Forecast, by Region 2020 & 2033
- Table 8: Global ASEAN Energy Storage Market Volume K Unit Forecast, by Region 2020 & 2033
- Table 9: Global ASEAN Energy Storage Market Revenue Million Forecast, by Type 2020 & 2033
- Table 10: Global ASEAN Energy Storage Market Volume K Unit Forecast, by Type 2020 & 2033
- Table 11: Global ASEAN Energy Storage Market Revenue Million Forecast, by Application 2020 & 2033
- Table 12: Global ASEAN Energy Storage Market Volume K Unit Forecast, by Application 2020 & 2033
- Table 13: Global ASEAN Energy Storage Market Revenue Million Forecast, by Geography 2020 & 2033
- Table 14: Global ASEAN Energy Storage Market Volume K Unit Forecast, by Geography 2020 & 2033
- Table 15: Global ASEAN Energy Storage Market Revenue Million Forecast, by Country 2020 & 2033
- Table 16: Global ASEAN Energy Storage Market Volume K Unit Forecast, by Country 2020 & 2033
- Table 17: Global ASEAN Energy Storage Market Revenue Million Forecast, by Type 2020 & 2033
- Table 18: Global ASEAN Energy Storage Market Volume K Unit Forecast, by Type 2020 & 2033
- Table 19: Global ASEAN Energy Storage Market Revenue Million Forecast, by Application 2020 & 2033
- Table 20: Global ASEAN Energy Storage Market Volume K Unit Forecast, by Application 2020 & 2033
- Table 21: Global ASEAN Energy Storage Market Revenue Million Forecast, by Geography 2020 & 2033
- Table 22: Global ASEAN Energy Storage Market Volume K Unit Forecast, by Geography 2020 & 2033
- Table 23: Global ASEAN Energy Storage Market Revenue Million Forecast, by Country 2020 & 2033
- Table 24: Global ASEAN Energy Storage Market Volume K Unit Forecast, by Country 2020 & 2033
- Table 25: Global ASEAN Energy Storage Market Revenue Million Forecast, by Type 2020 & 2033
- Table 26: Global ASEAN Energy Storage Market Volume K Unit Forecast, by Type 2020 & 2033
- Table 27: Global ASEAN Energy Storage Market Revenue Million Forecast, by Application 2020 & 2033
- Table 28: Global ASEAN Energy Storage Market Volume K Unit Forecast, by Application 2020 & 2033
- Table 29: Global ASEAN Energy Storage Market Revenue Million Forecast, by Geography 2020 & 2033
- Table 30: Global ASEAN Energy Storage Market Volume K Unit Forecast, by Geography 2020 & 2033
- Table 31: Global ASEAN Energy Storage Market Revenue Million Forecast, by Country 2020 & 2033
- Table 32: Global ASEAN Energy Storage Market Volume K Unit Forecast, by Country 2020 & 2033
- Table 33: Global ASEAN Energy Storage Market Revenue Million Forecast, by Type 2020 & 2033
- Table 34: Global ASEAN Energy Storage Market Volume K Unit Forecast, by Type 2020 & 2033
- Table 35: Global ASEAN Energy Storage Market Revenue Million Forecast, by Application 2020 & 2033
- Table 36: Global ASEAN Energy Storage Market Volume K Unit Forecast, by Application 2020 & 2033
- Table 37: Global ASEAN Energy Storage Market Revenue Million Forecast, by Geography 2020 & 2033
- Table 38: Global ASEAN Energy Storage Market Volume K Unit Forecast, by Geography 2020 & 2033
- Table 39: Global ASEAN Energy Storage Market Revenue Million Forecast, by Country 2020 & 2033
- Table 40: Global ASEAN Energy Storage Market Volume K Unit Forecast, by Country 2020 & 2033
- Table 41: Global ASEAN Energy Storage Market Revenue Million Forecast, by Type 2020 & 2033
- Table 42: Global ASEAN Energy Storage Market Volume K Unit Forecast, by Type 2020 & 2033
- Table 43: Global ASEAN Energy Storage Market Revenue Million Forecast, by Application 2020 & 2033
- Table 44: Global ASEAN Energy Storage Market Volume K Unit Forecast, by Application 2020 & 2033
- Table 45: Global ASEAN Energy Storage Market Revenue Million Forecast, by Geography 2020 & 2033
- Table 46: Global ASEAN Energy Storage Market Volume K Unit Forecast, by Geography 2020 & 2033
- Table 47: Global ASEAN Energy Storage Market Revenue Million Forecast, by Country 2020 & 2033
- Table 48: Global ASEAN Energy Storage Market Volume K Unit Forecast, by Country 2020 & 2033
Frequently Asked Questions
1. What is the projected Compound Annual Growth Rate (CAGR) of the ASEAN Energy Storage Market?
The projected CAGR is approximately 6.78%.
2. Which companies are prominent players in the ASEAN Energy Storage Market?
Key companies in the market include BYD Co Ltd, SEC Battery Company, NGK Insulators Ltd, Contemporary Amperex Technology Co Ltd (CATL), Wartsila Oyj Abp, LG Chem Ltd *List Not Exhaustive, GS Yuasa Corporation.
3. What are the main segments of the ASEAN Energy Storage Market?
The market segments include Type, Application, Geography.
4. Can you provide details about the market size?
The market size is estimated to be USD 3.32 Million as of 2022.
5. What are some drivers contributing to market growth?
Growth in Power Demand from Residential. Commercial and Industrial Consumers4.; Unscheduled Power Outages and Grid Instability would Demand Energy Storage Solutions.
6. What are the notable trends driving market growth?
Battery Energy Storage Segment Expected to Witness Significant Growth.
7. Are there any restraints impacting market growth?
Lack of Investments could Hamper the Growth of Energy Storage Market.
8. Can you provide examples of recent developments in the market?
In March 2022, the Indonesian government launched a 5MW battery energy storage system (BESS) pilot project as it aims to move away from diesel-generated power. Perusahaan Listrik Negara (PLN) 'de-dieselization' program will involve 5,200 units of new renewable energy generation with a total power of 2GW by 2024 and is a potential application for battery storage.
9. What pricing options are available for accessing the report?
Pricing options include single-user, multi-user, and enterprise licenses priced at USD 4750, USD 5250, and USD 8750 respectively.
10. Is the market size provided in terms of value or volume?
The market size is provided in terms of value, measured in Million and volume, measured in K Unit.
11. Are there any specific market keywords associated with the report?
Yes, the market keyword associated with the report is "ASEAN Energy Storage Market," which aids in identifying and referencing the specific market segment covered.
12. How do I determine which pricing option suits my needs best?
The pricing options vary based on user requirements and access needs. Individual users may opt for single-user licenses, while businesses requiring broader access may choose multi-user or enterprise licenses for cost-effective access to the report.
13. Are there any additional resources or data provided in the ASEAN Energy Storage Market report?
While the report offers comprehensive insights, it's advisable to review the specific contents or supplementary materials provided to ascertain if additional resources or data are available.
14. How can I stay updated on further developments or reports in the ASEAN Energy Storage Market?
To stay informed about further developments, trends, and reports in the ASEAN Energy Storage Market, consider subscribing to industry newsletters, following relevant companies and organizations, or regularly checking reputable industry news sources and publications.
Methodology
Step 1 - Identification of Relevant Samples Size from Population Database


Step 2 - Approaches for Defining Global Market Size (Value, Volume* & Price*)

Note*: In applicable scenarios
Step 3 - Data Sources
Primary Research
- Web Analytics
- Survey Reports
- Research Institute
- Latest Research Reports
- Opinion Leaders
Secondary Research
- Annual Reports
- White Paper
- Latest Press Release
- Industry Association
- Paid Database
- Investor Presentations

Step 4 - Data Triangulation
Involves using different sources of information in order to increase the validity of a study
These sources are likely to be stakeholders in a program - participants, other researchers, program staff, other community members, and so on.
Then we put all data in single framework & apply various statistical tools to find out the dynamic on the market.
During the analysis stage, feedback from the stakeholder groups would be compared to determine areas of agreement as well as areas of divergence