

Key Insights
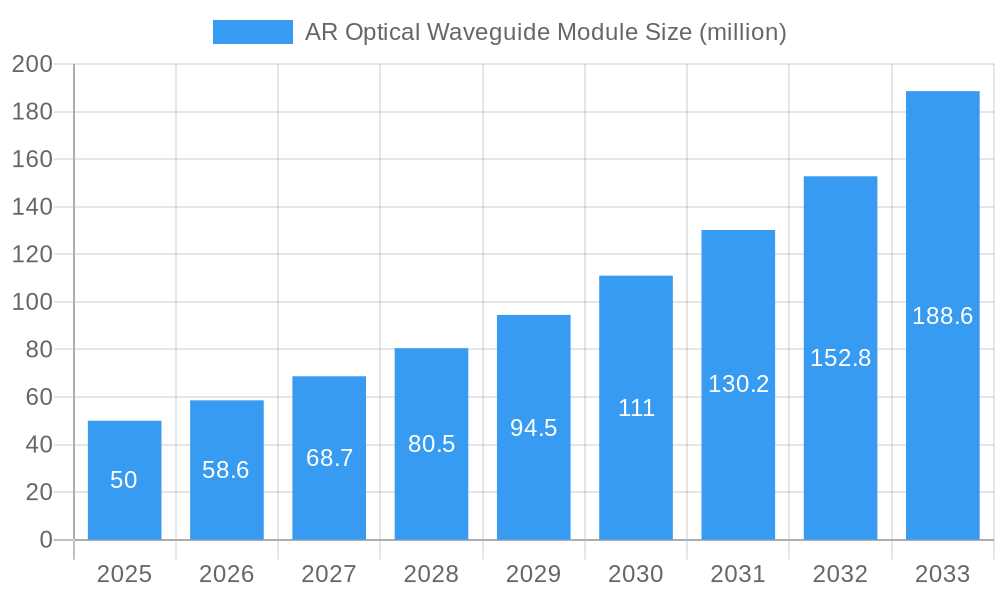
The global AR Optical Waveguide Module market is poised for substantial growth, projected to reach an impressive $188.6 million by 2033, driven by a remarkable Compound Annual Growth Rate (CAGR) of 17.1%. This robust expansion is fueled by the escalating demand for immersive and interactive experiences across various sectors. Key growth engines include the burgeoning use of AR in industrial maintenance for real-time diagnostics and remote assistance, revolutionizing operational efficiency. Furthermore, the education and training sector is increasingly adopting AR optical waveguide modules to create engaging and hands-on learning environments, enhancing knowledge retention. The gaming entertainment industry also represents a significant driver, as consumers seek more realistic and interactive gaming experiences. Avionics are leveraging these advanced optics for enhanced situational awareness and pilot training. While the market is expanding rapidly, it is also characterized by evolving technological advancements, particularly in the development of more efficient and lightweight waveguide designs, such as reflective and diffractive waveguides, aiming to improve visual fidelity and user comfort.
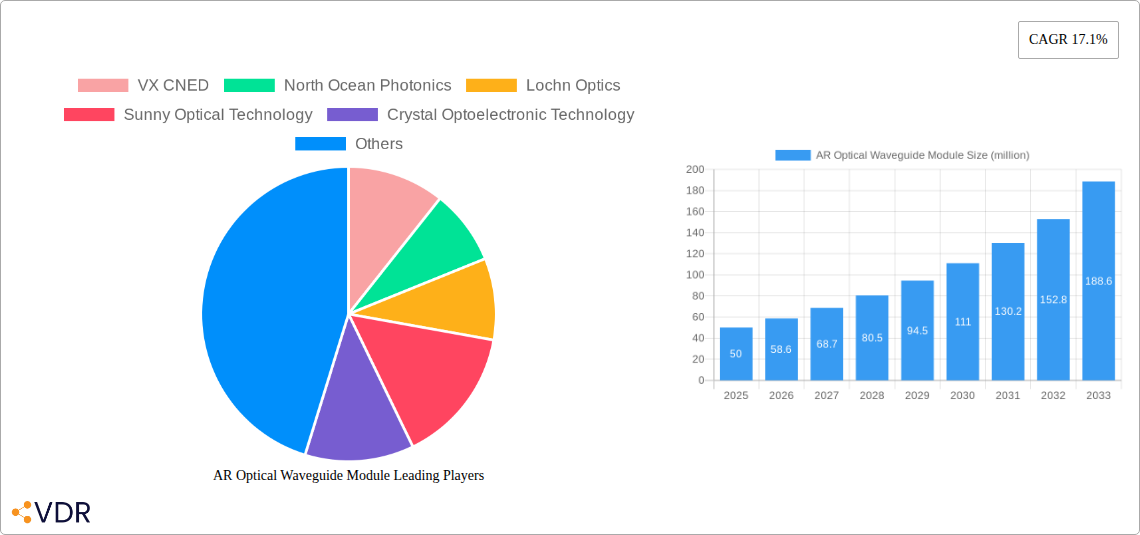
AR Optical Waveguide Module Market Size (In Million)
The market dynamics are shaped by both opportunities and challenges. The increasing adoption of augmented reality in consumer electronics and enterprise solutions, coupled with ongoing research and development to miniaturize and enhance the performance of AR optical waveguide modules, are key growth facilitators. Innovations in display technology and optical engineering are continuously pushing the boundaries of what is possible in AR. However, certain restraints, such as the high cost of advanced optical components and the current limitations in battery life and processing power for mobile AR devices, could temper immediate widespread adoption in some segments. Despite these hurdles, the strong underlying demand for AR integration across industries, supported by a growing ecosystem of AR content developers and hardware manufacturers, indicates a promising future. The competitive landscape features prominent players like Sunny Optical Technology and Crystal Optoelectronic Technology, actively investing in R&D to capture market share and drive innovation in this dynamic and rapidly evolving technology.
AR Optical Waveguide Module Company Market Share
AR Optical Waveguide Module Market: Comprehensive Growth & Technology Outlook 2025-2033
This in-depth report provides an exhaustive analysis of the global AR Optical Waveguide Module market, covering its intricate dynamics, growth trajectories, dominant segments, and future potential. Targeting industry professionals, this report offers critical insights for strategic decision-making within the burgeoning augmented reality ecosystem. Delve into the market's evolution, technological advancements, and competitive landscape from 2019 to 2033, with a focused base and estimated year of 2025 and forecast period of 2025-2033.
AR Optical Waveguide Module Market Dynamics & Structure
The AR Optical Waveguide Module market is characterized by a moderate concentration, with key players investing heavily in research and development to drive technological innovation. The primary drivers of technological innovation stem from the demand for lighter, more energy-efficient, and higher-resolution waveguide displays, crucial for immersive AR experiences. Regulatory frameworks, while still evolving, are generally supportive of AR technology adoption, particularly in industrial and educational sectors. Competitive product substitutes include other display technologies like LCoS and micro-LEDs, but waveguide modules offer distinct advantages in terms of field of view and form factor. End-user demographics are expanding from early adopters in enterprise and gaming to broader consumer markets as costs decrease and performance improves. Mergers and acquisitions (M&A) trends are active, indicating industry consolidation and strategic expansion. For instance, there were approximately 5-8 significant M&A deals within the broader AR display component market between 2019 and 2024. Innovation barriers include the high cost of manufacturing complex optical structures and the need for precise alignment of optical components.
- Market Concentration: Dominated by a few key technology providers with proprietary waveguide designs.
- Technological Innovation Drivers: Miniaturization, increased brightness, wider field-of-view, and reduced power consumption.
- Regulatory Frameworks: Generally supportive, with potential for standardization in the future.
- Competitive Product Substitutes: LCoS, Micro-LEDs, and Diffractive Optical Elements (DOEs).
- End-User Demographics: Enterprise, gaming, defense, and increasingly, consumer AR applications.
- M&A Trends: Strategic acquisitions of smaller component suppliers and R&D firms.
- Innovation Barriers: Manufacturing complexity, material science limitations, and cost reduction.
AR Optical Waveguide Module Growth Trends & Insights
The AR Optical Waveguide Module market is poised for significant expansion, driven by accelerating adoption rates across various applications. The market size, which was approximately $150 million in 2019, is projected to reach an estimated $950 million by 2025, showcasing a robust Compound Annual Growth Rate (CAGR) of around 35-40%. This growth is fueled by relentless technological disruptions, including advancements in material science for improved optical efficiency and the development of advanced manufacturing techniques for mass production. Consumer behavior shifts are also playing a pivotal role, with a growing demand for seamless integration of digital information into the physical world, evident in the increasing popularity of AR gaming and entertainment. The market penetration of AR optical waveguide modules is still in its nascent stages, presenting substantial headroom for future growth. By 2025, we anticipate a market penetration of approximately 5-7% in the enterprise AR headset market and 1-2% in the consumer AR segment. The integration of AI and computer vision further enhances the utility and appeal of AR devices, directly impacting waveguide module demand. The forecast period (2025-2033) is expected to witness sustained high growth as AR technology matures and becomes more accessible. Emerging use cases in augmented reality surgery, advanced diagnostics in healthcare, and highly interactive educational simulations will continue to broaden the market's scope. Furthermore, the development of lighter, more comfortable, and stylish AR glasses will drive consumer adoption, transforming how individuals interact with digital content and their surroundings. The investment by major tech companies in AR hardware and software ecosystems, including the development of sophisticated waveguide displays, will be a critical catalyst for market expansion. The continuous improvement in display resolution and color accuracy will also be key factors in driving demand for advanced AR optical waveguide modules. The growth trajectory is not linear; it will likely see periods of rapid acceleration as major product launches and technological breakthroughs occur. The increasing availability of affordable and high-performance AR headsets will democratize access to AR experiences, further propelling market growth.
Dominant Regions, Countries, or Segments in AR Optical Waveguide Module
North America currently leads the AR Optical Waveguide Module market, primarily driven by strong government initiatives in defense and avionics, alongside significant private sector investment in R&D and widespread adoption in industrial maintenance applications. The United States, in particular, dominates due to the presence of leading AR technology developers and a robust ecosystem for technology innovation. For instance, AR optical waveguide module sales in North America are estimated to have accounted for approximately 35% of the global market in 2024. The Application: Industrial Maintenance segment is a significant growth driver, projected to capture around 25% of the market share by 2025. This is attributed to the efficiency gains and safety improvements offered by AR in complex repair and assembly tasks, leading to a substantial increase in demand for AR optical waveguide modules in this sector.
- Leading Region: North America, owing to strong R&D, defense applications, and industrial adoption.
- Dominant Country: United States, with its concentrated technology hubs and early adoption of AR solutions.
- Key Application Segment Driving Growth: Industrial Maintenance, expected to hold a substantial market share due to productivity enhancements.
- Market Share in Industrial Maintenance: Projected to reach 25% of the total AR optical waveguide module market by 2025.
- Key Drivers: Enhanced worker safety, reduced downtime, improved accuracy in complex tasks, and remote expert assistance.
- Economic Policies & Infrastructure: Supportive venture capital funding, strong IT infrastructure, and a skilled workforce.
The Type: Diffractive Waveguides segment is also exhibiting strong growth, expected to command over 60% of the market by 2025. Their superior optical performance, including wider field of view and higher efficiency, makes them the preferred choice for advanced AR devices.
- Dominant Type Segment: Diffractive Waveguides, due to their advanced optical capabilities.
- Market Share in Diffractive Waveguides: Estimated to reach over 60% of the total AR optical waveguide module market by 2025.
- Key Drivers: Wider field of view, higher optical efficiency, potential for miniaturization, and compatibility with advanced display technologies.
- Technological Advancements: Progress in nano-fabrication techniques and material science enabling complex diffractive structures.
Asia Pacific is emerging as a significant contender, driven by substantial investments in AR technology from countries like China and South Korea, and a burgeoning consumer market for gaming and entertainment.
AR Optical Waveguide Module Product Landscape
The AR Optical Waveguide Module product landscape is defined by rapid innovation in optical design and manufacturing. Companies are focusing on developing ultra-thin, lightweight, and high-efficiency waveguide modules that can deliver bright, clear, and wide field-of-view images. Key product innovations include the development of advanced grating structures in diffractive waveguides for improved light coupling and reduced chromatic aberration. Reflective waveguides are also seeing advancements in multi-layer designs to increase brightness and optical efficiency. Applications are expanding beyond traditional enterprise use cases into consumer electronics, gaming, and even personal navigation. Performance metrics such as waveguide efficiency, optical distortion, and color fidelity are critical differentiators.
Key Drivers, Barriers & Challenges in AR Optical Waveguide Module
The AR Optical Waveguide Module market is propelled by several key drivers, including the increasing demand for immersive AR experiences across various sectors, continuous advancements in display technology, and the growing adoption of AR in enterprise for training, maintenance, and remote assistance. The need for lighter and more compact AR devices also fuels innovation in waveguide design.
- Key Drivers:
- Growing demand for immersive AR experiences.
- Advancements in display technology (e.g., micro-OLED).
- Increased AR adoption in enterprise (training, maintenance).
- Need for lighter and more compact AR hardware.
- Supportive government initiatives for XR technologies.
Conversely, the market faces significant barriers and challenges. High manufacturing costs for complex optical components, the need for precise alignment, and the development of robust and reliable AR operating systems are critical hurdles. Supply chain issues related to specialized optical materials and components can also impact production volumes and costs. Intense competition from alternative display technologies and the slow pace of consumer adoption in certain segments also present challenges.
- Key Barriers & Challenges:
- High manufacturing costs of optical components.
- Need for precise optical alignment.
- Development of user-friendly AR software.
- Supply chain complexities for specialized materials.
- Competition from alternative display technologies.
- Slow consumer adoption in some demographics.
Emerging Opportunities in AR Optical Waveguide Module
Emerging opportunities in the AR Optical Waveguide Module sector are abundant, particularly in the development of personalized AR experiences and the integration of advanced AI capabilities. Untapped markets in healthcare for surgical guidance and remote diagnostics present significant potential. The evolution of consumer AR glasses, aiming for a more fashionable and discreet form factor, will unlock broader consumer adoption. Furthermore, the increasing use of AR in education and remote collaboration tools offers substantial growth avenues.
Growth Accelerators in the AR Optical Waveguide Module Industry
Technological breakthroughs in material science, such as the development of new polymers and coatings for enhanced optical performance, are key growth accelerators. Strategic partnerships between waveguide manufacturers and leading AR headset brands are crucial for driving mass production and market penetration. Expansion into new geographic regions and the development of specialized waveguide solutions for niche applications like automotive HUDs will further accelerate industry growth.
Key Players Shaping the AR Optical Waveguide Module Market
- VX CNED
- North Ocean Photonics
- Lochn Optics
- Sunny Optical Technology
- Crystal Optoelectronic Technology
- Lingxi-AR Technology Co.,Ltd
- Beijing NED Display Technology Co.,LTD
Notable Milestones in AR Optical Waveguide Module Sector
- 2023 (H1): Sunny Optical Technology announces significant advancements in high-efficiency diffractive waveguide manufacturing, improving brightness by 15%.
- 2023 (Q4): Lochn Optics secures Series B funding to scale production of their advanced reflective waveguide technology.
- 2024 (Q1): VX CNED showcases a new generation of ultra-thin AR waveguide modules with a 50-degree field of view.
- 2024 (Q2): North Ocean Photonics partners with a major AR headset manufacturer for OEM supply of their custom waveguides.
- 2024 (H2): Crystal Optoelectronic Technology introduces a cost-effective manufacturing process for diffractive waveguides, aiming to reduce AR device prices.
In-Depth AR Optical Waveguide Module Market Outlook
The AR Optical Waveguide Module market is set for sustained and significant growth, driven by ongoing technological innovation and expanding application scope. Future market potential lies in achieving higher levels of optical efficiency, reducing manufacturing costs, and improving the overall user experience. Strategic opportunities include deeper integration with AI for more responsive and intelligent AR applications, and the development of interoperable waveguide standards. The continued investment in AR hardware by major technology companies will act as a powerful catalyst, paving the way for widespread adoption and transforming various industries.
AR Optical Waveguide Module Segmentation
-
1. Application
- 1.1. Industrial Maintenance
- 1.2. Education and Training
- 1.3. Game Entertainment
- 1.4. Avionics
- 1.5. Others
-
2. Types
- 2.1. Reflective Waveguides
- 2.2. Diffractive Waveguides
- 2.3. Others
AR Optical Waveguide Module Segmentation By Geography
-
1. North America
- 1.1. United States
- 1.2. Canada
- 1.3. Mexico
-
2. South America
- 2.1. Brazil
- 2.2. Argentina
- 2.3. Rest of South America
-
3. Europe
- 3.1. United Kingdom
- 3.2. Germany
- 3.3. France
- 3.4. Italy
- 3.5. Spain
- 3.6. Russia
- 3.7. Benelux
- 3.8. Nordics
- 3.9. Rest of Europe
-
4. Middle East & Africa
- 4.1. Turkey
- 4.2. Israel
- 4.3. GCC
- 4.4. North Africa
- 4.5. South Africa
- 4.6. Rest of Middle East & Africa
-
5. Asia Pacific
- 5.1. China
- 5.2. India
- 5.3. Japan
- 5.4. South Korea
- 5.5. ASEAN
- 5.6. Oceania
- 5.7. Rest of Asia Pacific
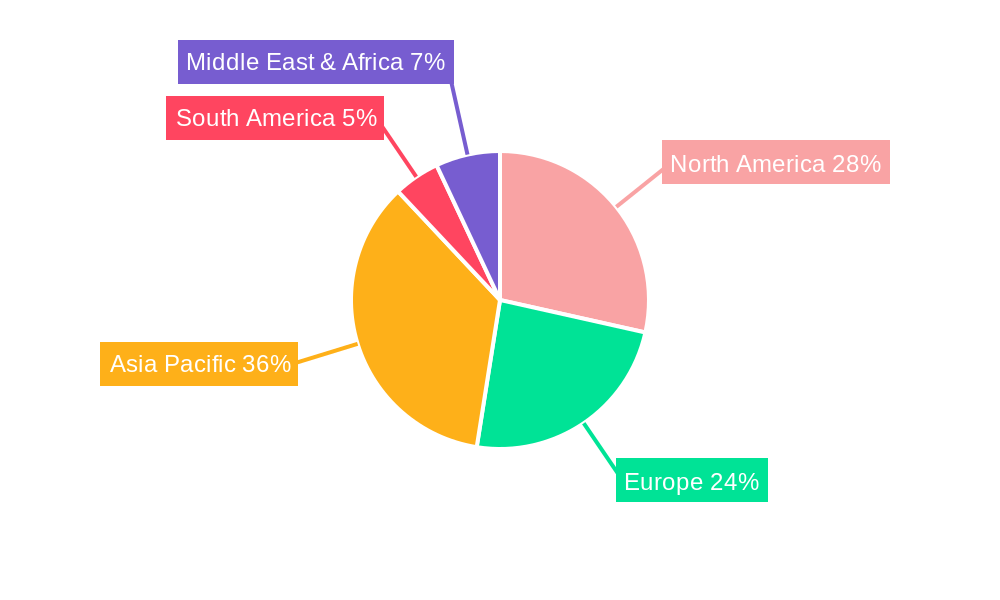
AR Optical Waveguide Module Regional Market Share
Geographic Coverage of AR Optical Waveguide Module
AR Optical Waveguide Module REPORT HIGHLIGHTS
| Aspects | Details |
|---|---|
| Study Period | 2020-2034 |
| Base Year | 2025 |
| Estimated Year | 2026 |
| Forecast Period | 2026-2034 |
| Historical Period | 2020-2025 |
| Growth Rate | CAGR of 37.08% from 2020-2034 |
| Segmentation |
|
Table of Contents
- 1. Introduction
- 1.1. Research Scope
- 1.2. Market Segmentation
- 1.3. Research Objective
- 1.4. Definitions and Assumptions
- 2. Executive Summary
- 2.1. Market Snapshot
- 3. Market Dynamics
- 3.1. Market Drivers
- 3.2. Market Restrains
- 3.3. Market Trends
- 3.4. Market Opportunities
- 4. Market Factor Analysis
- 4.1. Porters Five Forces
- 4.1.1. Bargaining Power of Suppliers
- 4.1.2. Bargaining Power of Buyers
- 4.1.3. Threat of New Entrants
- 4.1.4. Threat of Substitutes
- 4.1.5. Competitive Rivalry
- 4.2. PESTEL analysis
- 4.3. BCG Analysis
- 4.3.1. Stars (High Growth, High Market Share)
- 4.3.2. Cash Cows (Low Growth, High Market Share)
- 4.3.3. Question Mark (High Growth, Low Market Share)
- 4.3.4. Dogs (Low Growth, Low Market Share)
- 4.4. Ansoff Matrix Analysis
- 4.5. Supply Chain Analysis
- 4.6. Regulatory Landscape
- 4.7. Current Market Potential and Opportunity Assessment (TAM–SAM–SOM Framework)
- 4.8. VDR Analyst Note
- 4.1. Porters Five Forces
- 5. Market Analysis, Insights and Forecast 2021-2033
- 5.1. Market Analysis, Insights and Forecast - by Application
- 5.1.1. Industrial Maintenance
- 5.1.2. Education and Training
- 5.1.3. Game Entertainment
- 5.1.4. Avionics
- 5.1.5. Others
- 5.2. Market Analysis, Insights and Forecast - by Types
- 5.2.1. Reflective Waveguides
- 5.2.2. Diffractive Waveguides
- 5.2.3. Others
- 5.3. Market Analysis, Insights and Forecast - by Region
- 5.3.1. North America
- 5.3.2. South America
- 5.3.3. Europe
- 5.3.4. Middle East & Africa
- 5.3.5. Asia Pacific
- 5.1. Market Analysis, Insights and Forecast - by Application
- 6. Global AR Optical Waveguide Module Analysis, Insights and Forecast, 2021-2033
- 6.1. Market Analysis, Insights and Forecast - by Application
- 6.1.1. Industrial Maintenance
- 6.1.2. Education and Training
- 6.1.3. Game Entertainment
- 6.1.4. Avionics
- 6.1.5. Others
- 6.2. Market Analysis, Insights and Forecast - by Types
- 6.2.1. Reflective Waveguides
- 6.2.2. Diffractive Waveguides
- 6.2.3. Others
- 6.1. Market Analysis, Insights and Forecast - by Application
- 7. North America AR Optical Waveguide Module Analysis, Insights and Forecast, 2021-2033
- 7.1. Market Analysis, Insights and Forecast - by Application
- 7.1.1. Industrial Maintenance
- 7.1.2. Education and Training
- 7.1.3. Game Entertainment
- 7.1.4. Avionics
- 7.1.5. Others
- 7.2. Market Analysis, Insights and Forecast - by Types
- 7.2.1. Reflective Waveguides
- 7.2.2. Diffractive Waveguides
- 7.2.3. Others
- 7.1. Market Analysis, Insights and Forecast - by Application
- 8. South America AR Optical Waveguide Module Analysis, Insights and Forecast, 2021-2033
- 8.1. Market Analysis, Insights and Forecast - by Application
- 8.1.1. Industrial Maintenance
- 8.1.2. Education and Training
- 8.1.3. Game Entertainment
- 8.1.4. Avionics
- 8.1.5. Others
- 8.2. Market Analysis, Insights and Forecast - by Types
- 8.2.1. Reflective Waveguides
- 8.2.2. Diffractive Waveguides
- 8.2.3. Others
- 8.1. Market Analysis, Insights and Forecast - by Application
- 9. Europe AR Optical Waveguide Module Analysis, Insights and Forecast, 2021-2033
- 9.1. Market Analysis, Insights and Forecast - by Application
- 9.1.1. Industrial Maintenance
- 9.1.2. Education and Training
- 9.1.3. Game Entertainment
- 9.1.4. Avionics
- 9.1.5. Others
- 9.2. Market Analysis, Insights and Forecast - by Types
- 9.2.1. Reflective Waveguides
- 9.2.2. Diffractive Waveguides
- 9.2.3. Others
- 9.1. Market Analysis, Insights and Forecast - by Application
- 10. Middle East & Africa AR Optical Waveguide Module Analysis, Insights and Forecast, 2021-2033
- 10.1. Market Analysis, Insights and Forecast - by Application
- 10.1.1. Industrial Maintenance
- 10.1.2. Education and Training
- 10.1.3. Game Entertainment
- 10.1.4. Avionics
- 10.1.5. Others
- 10.2. Market Analysis, Insights and Forecast - by Types
- 10.2.1. Reflective Waveguides
- 10.2.2. Diffractive Waveguides
- 10.2.3. Others
- 10.1. Market Analysis, Insights and Forecast - by Application
- 11. Asia Pacific AR Optical Waveguide Module Analysis, Insights and Forecast, 2021-2033
- 11.1. Market Analysis, Insights and Forecast - by Application
- 11.1.1. Industrial Maintenance
- 11.1.2. Education and Training
- 11.1.3. Game Entertainment
- 11.1.4. Avionics
- 11.1.5. Others
- 11.2. Market Analysis, Insights and Forecast - by Types
- 11.2.1. Reflective Waveguides
- 11.2.2. Diffractive Waveguides
- 11.2.3. Others
- 11.1. Market Analysis, Insights and Forecast - by Application
- 12. Competitive Analysis
- 12.1. Company Profiles
- 12.1.1 VX CNED
- 12.1.1.1. Company Overview
- 12.1.1.2. Products
- 12.1.1.3. Company Financials
- 12.1.1.4. SWOT Analysis
- 12.1.2 North Ocean Photonics
- 12.1.2.1. Company Overview
- 12.1.2.2. Products
- 12.1.2.3. Company Financials
- 12.1.2.4. SWOT Analysis
- 12.1.3 Lochn Optics
- 12.1.3.1. Company Overview
- 12.1.3.2. Products
- 12.1.3.3. Company Financials
- 12.1.3.4. SWOT Analysis
- 12.1.4 Sunny Optical Technology
- 12.1.4.1. Company Overview
- 12.1.4.2. Products
- 12.1.4.3. Company Financials
- 12.1.4.4. SWOT Analysis
- 12.1.5 Crystal Optoelectronic Technology
- 12.1.5.1. Company Overview
- 12.1.5.2. Products
- 12.1.5.3. Company Financials
- 12.1.5.4. SWOT Analysis
- 12.1.6 Lingxi-AR Technology Co.
- 12.1.6.1. Company Overview
- 12.1.6.2. Products
- 12.1.6.3. Company Financials
- 12.1.6.4. SWOT Analysis
- 12.1.7 Ltd
- 12.1.7.1. Company Overview
- 12.1.7.2. Products
- 12.1.7.3. Company Financials
- 12.1.7.4. SWOT Analysis
- 12.1.8 Beijing NED Display Technology Co.
- 12.1.8.1. Company Overview
- 12.1.8.2. Products
- 12.1.8.3. Company Financials
- 12.1.8.4. SWOT Analysis
- 12.1.9 LTD
- 12.1.9.1. Company Overview
- 12.1.9.2. Products
- 12.1.9.3. Company Financials
- 12.1.9.4. SWOT Analysis
- 12.1.1 VX CNED
- 12.2. Market Entropy
- 12.2.1 Company's Key Areas Served
- 12.2.2 Recent Developments
- 12.3. Company Market Share Analysis 2025
- 12.3.1 Top 5 Companies Market Share Analysis
- 12.3.2 Top 3 Companies Market Share Analysis
- 12.4. List of Potential Customers
- 13. Research Methodology
List of Figures
- Figure 1: Global AR Optical Waveguide Module Revenue Breakdown (undefined, %) by Region 2025 & 2033
- Figure 2: Global AR Optical Waveguide Module Volume Breakdown (K, %) by Region 2025 & 2033
- Figure 3: North America AR Optical Waveguide Module Revenue (undefined), by Application 2025 & 2033
- Figure 4: North America AR Optical Waveguide Module Volume (K), by Application 2025 & 2033
- Figure 5: North America AR Optical Waveguide Module Revenue Share (%), by Application 2025 & 2033
- Figure 6: North America AR Optical Waveguide Module Volume Share (%), by Application 2025 & 2033
- Figure 7: North America AR Optical Waveguide Module Revenue (undefined), by Types 2025 & 2033
- Figure 8: North America AR Optical Waveguide Module Volume (K), by Types 2025 & 2033
- Figure 9: North America AR Optical Waveguide Module Revenue Share (%), by Types 2025 & 2033
- Figure 10: North America AR Optical Waveguide Module Volume Share (%), by Types 2025 & 2033
- Figure 11: North America AR Optical Waveguide Module Revenue (undefined), by Country 2025 & 2033
- Figure 12: North America AR Optical Waveguide Module Volume (K), by Country 2025 & 2033
- Figure 13: North America AR Optical Waveguide Module Revenue Share (%), by Country 2025 & 2033
- Figure 14: North America AR Optical Waveguide Module Volume Share (%), by Country 2025 & 2033
- Figure 15: South America AR Optical Waveguide Module Revenue (undefined), by Application 2025 & 2033
- Figure 16: South America AR Optical Waveguide Module Volume (K), by Application 2025 & 2033
- Figure 17: South America AR Optical Waveguide Module Revenue Share (%), by Application 2025 & 2033
- Figure 18: South America AR Optical Waveguide Module Volume Share (%), by Application 2025 & 2033
- Figure 19: South America AR Optical Waveguide Module Revenue (undefined), by Types 2025 & 2033
- Figure 20: South America AR Optical Waveguide Module Volume (K), by Types 2025 & 2033
- Figure 21: South America AR Optical Waveguide Module Revenue Share (%), by Types 2025 & 2033
- Figure 22: South America AR Optical Waveguide Module Volume Share (%), by Types 2025 & 2033
- Figure 23: South America AR Optical Waveguide Module Revenue (undefined), by Country 2025 & 2033
- Figure 24: South America AR Optical Waveguide Module Volume (K), by Country 2025 & 2033
- Figure 25: South America AR Optical Waveguide Module Revenue Share (%), by Country 2025 & 2033
- Figure 26: South America AR Optical Waveguide Module Volume Share (%), by Country 2025 & 2033
- Figure 27: Europe AR Optical Waveguide Module Revenue (undefined), by Application 2025 & 2033
- Figure 28: Europe AR Optical Waveguide Module Volume (K), by Application 2025 & 2033
- Figure 29: Europe AR Optical Waveguide Module Revenue Share (%), by Application 2025 & 2033
- Figure 30: Europe AR Optical Waveguide Module Volume Share (%), by Application 2025 & 2033
- Figure 31: Europe AR Optical Waveguide Module Revenue (undefined), by Types 2025 & 2033
- Figure 32: Europe AR Optical Waveguide Module Volume (K), by Types 2025 & 2033
- Figure 33: Europe AR Optical Waveguide Module Revenue Share (%), by Types 2025 & 2033
- Figure 34: Europe AR Optical Waveguide Module Volume Share (%), by Types 2025 & 2033
- Figure 35: Europe AR Optical Waveguide Module Revenue (undefined), by Country 2025 & 2033
- Figure 36: Europe AR Optical Waveguide Module Volume (K), by Country 2025 & 2033
- Figure 37: Europe AR Optical Waveguide Module Revenue Share (%), by Country 2025 & 2033
- Figure 38: Europe AR Optical Waveguide Module Volume Share (%), by Country 2025 & 2033
- Figure 39: Middle East & Africa AR Optical Waveguide Module Revenue (undefined), by Application 2025 & 2033
- Figure 40: Middle East & Africa AR Optical Waveguide Module Volume (K), by Application 2025 & 2033
- Figure 41: Middle East & Africa AR Optical Waveguide Module Revenue Share (%), by Application 2025 & 2033
- Figure 42: Middle East & Africa AR Optical Waveguide Module Volume Share (%), by Application 2025 & 2033
- Figure 43: Middle East & Africa AR Optical Waveguide Module Revenue (undefined), by Types 2025 & 2033
- Figure 44: Middle East & Africa AR Optical Waveguide Module Volume (K), by Types 2025 & 2033
- Figure 45: Middle East & Africa AR Optical Waveguide Module Revenue Share (%), by Types 2025 & 2033
- Figure 46: Middle East & Africa AR Optical Waveguide Module Volume Share (%), by Types 2025 & 2033
- Figure 47: Middle East & Africa AR Optical Waveguide Module Revenue (undefined), by Country 2025 & 2033
- Figure 48: Middle East & Africa AR Optical Waveguide Module Volume (K), by Country 2025 & 2033
- Figure 49: Middle East & Africa AR Optical Waveguide Module Revenue Share (%), by Country 2025 & 2033
- Figure 50: Middle East & Africa AR Optical Waveguide Module Volume Share (%), by Country 2025 & 2033
- Figure 51: Asia Pacific AR Optical Waveguide Module Revenue (undefined), by Application 2025 & 2033
- Figure 52: Asia Pacific AR Optical Waveguide Module Volume (K), by Application 2025 & 2033
- Figure 53: Asia Pacific AR Optical Waveguide Module Revenue Share (%), by Application 2025 & 2033
- Figure 54: Asia Pacific AR Optical Waveguide Module Volume Share (%), by Application 2025 & 2033
- Figure 55: Asia Pacific AR Optical Waveguide Module Revenue (undefined), by Types 2025 & 2033
- Figure 56: Asia Pacific AR Optical Waveguide Module Volume (K), by Types 2025 & 2033
- Figure 57: Asia Pacific AR Optical Waveguide Module Revenue Share (%), by Types 2025 & 2033
- Figure 58: Asia Pacific AR Optical Waveguide Module Volume Share (%), by Types 2025 & 2033
- Figure 59: Asia Pacific AR Optical Waveguide Module Revenue (undefined), by Country 2025 & 2033
- Figure 60: Asia Pacific AR Optical Waveguide Module Volume (K), by Country 2025 & 2033
- Figure 61: Asia Pacific AR Optical Waveguide Module Revenue Share (%), by Country 2025 & 2033
- Figure 62: Asia Pacific AR Optical Waveguide Module Volume Share (%), by Country 2025 & 2033
List of Tables
- Table 1: Global AR Optical Waveguide Module Revenue undefined Forecast, by Application 2020 & 2033
- Table 2: Global AR Optical Waveguide Module Volume K Forecast, by Application 2020 & 2033
- Table 3: Global AR Optical Waveguide Module Revenue undefined Forecast, by Types 2020 & 2033
- Table 4: Global AR Optical Waveguide Module Volume K Forecast, by Types 2020 & 2033
- Table 5: Global AR Optical Waveguide Module Revenue undefined Forecast, by Region 2020 & 2033
- Table 6: Global AR Optical Waveguide Module Volume K Forecast, by Region 2020 & 2033
- Table 7: Global AR Optical Waveguide Module Revenue undefined Forecast, by Application 2020 & 2033
- Table 8: Global AR Optical Waveguide Module Volume K Forecast, by Application 2020 & 2033
- Table 9: Global AR Optical Waveguide Module Revenue undefined Forecast, by Types 2020 & 2033
- Table 10: Global AR Optical Waveguide Module Volume K Forecast, by Types 2020 & 2033
- Table 11: Global AR Optical Waveguide Module Revenue undefined Forecast, by Country 2020 & 2033
- Table 12: Global AR Optical Waveguide Module Volume K Forecast, by Country 2020 & 2033
- Table 13: United States AR Optical Waveguide Module Revenue (undefined) Forecast, by Application 2020 & 2033
- Table 14: United States AR Optical Waveguide Module Volume (K) Forecast, by Application 2020 & 2033
- Table 15: Canada AR Optical Waveguide Module Revenue (undefined) Forecast, by Application 2020 & 2033
- Table 16: Canada AR Optical Waveguide Module Volume (K) Forecast, by Application 2020 & 2033
- Table 17: Mexico AR Optical Waveguide Module Revenue (undefined) Forecast, by Application 2020 & 2033
- Table 18: Mexico AR Optical Waveguide Module Volume (K) Forecast, by Application 2020 & 2033
- Table 19: Global AR Optical Waveguide Module Revenue undefined Forecast, by Application 2020 & 2033
- Table 20: Global AR Optical Waveguide Module Volume K Forecast, by Application 2020 & 2033
- Table 21: Global AR Optical Waveguide Module Revenue undefined Forecast, by Types 2020 & 2033
- Table 22: Global AR Optical Waveguide Module Volume K Forecast, by Types 2020 & 2033
- Table 23: Global AR Optical Waveguide Module Revenue undefined Forecast, by Country 2020 & 2033
- Table 24: Global AR Optical Waveguide Module Volume K Forecast, by Country 2020 & 2033
- Table 25: Brazil AR Optical Waveguide Module Revenue (undefined) Forecast, by Application 2020 & 2033
- Table 26: Brazil AR Optical Waveguide Module Volume (K) Forecast, by Application 2020 & 2033
- Table 27: Argentina AR Optical Waveguide Module Revenue (undefined) Forecast, by Application 2020 & 2033
- Table 28: Argentina AR Optical Waveguide Module Volume (K) Forecast, by Application 2020 & 2033
- Table 29: Rest of South America AR Optical Waveguide Module Revenue (undefined) Forecast, by Application 2020 & 2033
- Table 30: Rest of South America AR Optical Waveguide Module Volume (K) Forecast, by Application 2020 & 2033
- Table 31: Global AR Optical Waveguide Module Revenue undefined Forecast, by Application 2020 & 2033
- Table 32: Global AR Optical Waveguide Module Volume K Forecast, by Application 2020 & 2033
- Table 33: Global AR Optical Waveguide Module Revenue undefined Forecast, by Types 2020 & 2033
- Table 34: Global AR Optical Waveguide Module Volume K Forecast, by Types 2020 & 2033
- Table 35: Global AR Optical Waveguide Module Revenue undefined Forecast, by Country 2020 & 2033
- Table 36: Global AR Optical Waveguide Module Volume K Forecast, by Country 2020 & 2033
- Table 37: United Kingdom AR Optical Waveguide Module Revenue (undefined) Forecast, by Application 2020 & 2033
- Table 38: United Kingdom AR Optical Waveguide Module Volume (K) Forecast, by Application 2020 & 2033
- Table 39: Germany AR Optical Waveguide Module Revenue (undefined) Forecast, by Application 2020 & 2033
- Table 40: Germany AR Optical Waveguide Module Volume (K) Forecast, by Application 2020 & 2033
- Table 41: France AR Optical Waveguide Module Revenue (undefined) Forecast, by Application 2020 & 2033
- Table 42: France AR Optical Waveguide Module Volume (K) Forecast, by Application 2020 & 2033
- Table 43: Italy AR Optical Waveguide Module Revenue (undefined) Forecast, by Application 2020 & 2033
- Table 44: Italy AR Optical Waveguide Module Volume (K) Forecast, by Application 2020 & 2033
- Table 45: Spain AR Optical Waveguide Module Revenue (undefined) Forecast, by Application 2020 & 2033
- Table 46: Spain AR Optical Waveguide Module Volume (K) Forecast, by Application 2020 & 2033
- Table 47: Russia AR Optical Waveguide Module Revenue (undefined) Forecast, by Application 2020 & 2033
- Table 48: Russia AR Optical Waveguide Module Volume (K) Forecast, by Application 2020 & 2033
- Table 49: Benelux AR Optical Waveguide Module Revenue (undefined) Forecast, by Application 2020 & 2033
- Table 50: Benelux AR Optical Waveguide Module Volume (K) Forecast, by Application 2020 & 2033
- Table 51: Nordics AR Optical Waveguide Module Revenue (undefined) Forecast, by Application 2020 & 2033
- Table 52: Nordics AR Optical Waveguide Module Volume (K) Forecast, by Application 2020 & 2033
- Table 53: Rest of Europe AR Optical Waveguide Module Revenue (undefined) Forecast, by Application 2020 & 2033
- Table 54: Rest of Europe AR Optical Waveguide Module Volume (K) Forecast, by Application 2020 & 2033
- Table 55: Global AR Optical Waveguide Module Revenue undefined Forecast, by Application 2020 & 2033
- Table 56: Global AR Optical Waveguide Module Volume K Forecast, by Application 2020 & 2033
- Table 57: Global AR Optical Waveguide Module Revenue undefined Forecast, by Types 2020 & 2033
- Table 58: Global AR Optical Waveguide Module Volume K Forecast, by Types 2020 & 2033
- Table 59: Global AR Optical Waveguide Module Revenue undefined Forecast, by Country 2020 & 2033
- Table 60: Global AR Optical Waveguide Module Volume K Forecast, by Country 2020 & 2033
- Table 61: Turkey AR Optical Waveguide Module Revenue (undefined) Forecast, by Application 2020 & 2033
- Table 62: Turkey AR Optical Waveguide Module Volume (K) Forecast, by Application 2020 & 2033
- Table 63: Israel AR Optical Waveguide Module Revenue (undefined) Forecast, by Application 2020 & 2033
- Table 64: Israel AR Optical Waveguide Module Volume (K) Forecast, by Application 2020 & 2033
- Table 65: GCC AR Optical Waveguide Module Revenue (undefined) Forecast, by Application 2020 & 2033
- Table 66: GCC AR Optical Waveguide Module Volume (K) Forecast, by Application 2020 & 2033
- Table 67: North Africa AR Optical Waveguide Module Revenue (undefined) Forecast, by Application 2020 & 2033
- Table 68: North Africa AR Optical Waveguide Module Volume (K) Forecast, by Application 2020 & 2033
- Table 69: South Africa AR Optical Waveguide Module Revenue (undefined) Forecast, by Application 2020 & 2033
- Table 70: South Africa AR Optical Waveguide Module Volume (K) Forecast, by Application 2020 & 2033
- Table 71: Rest of Middle East & Africa AR Optical Waveguide Module Revenue (undefined) Forecast, by Application 2020 & 2033
- Table 72: Rest of Middle East & Africa AR Optical Waveguide Module Volume (K) Forecast, by Application 2020 & 2033
- Table 73: Global AR Optical Waveguide Module Revenue undefined Forecast, by Application 2020 & 2033
- Table 74: Global AR Optical Waveguide Module Volume K Forecast, by Application 2020 & 2033
- Table 75: Global AR Optical Waveguide Module Revenue undefined Forecast, by Types 2020 & 2033
- Table 76: Global AR Optical Waveguide Module Volume K Forecast, by Types 2020 & 2033
- Table 77: Global AR Optical Waveguide Module Revenue undefined Forecast, by Country 2020 & 2033
- Table 78: Global AR Optical Waveguide Module Volume K Forecast, by Country 2020 & 2033
- Table 79: China AR Optical Waveguide Module Revenue (undefined) Forecast, by Application 2020 & 2033
- Table 80: China AR Optical Waveguide Module Volume (K) Forecast, by Application 2020 & 2033
- Table 81: India AR Optical Waveguide Module Revenue (undefined) Forecast, by Application 2020 & 2033
- Table 82: India AR Optical Waveguide Module Volume (K) Forecast, by Application 2020 & 2033
- Table 83: Japan AR Optical Waveguide Module Revenue (undefined) Forecast, by Application 2020 & 2033
- Table 84: Japan AR Optical Waveguide Module Volume (K) Forecast, by Application 2020 & 2033
- Table 85: South Korea AR Optical Waveguide Module Revenue (undefined) Forecast, by Application 2020 & 2033
- Table 86: South Korea AR Optical Waveguide Module Volume (K) Forecast, by Application 2020 & 2033
- Table 87: ASEAN AR Optical Waveguide Module Revenue (undefined) Forecast, by Application 2020 & 2033
- Table 88: ASEAN AR Optical Waveguide Module Volume (K) Forecast, by Application 2020 & 2033
- Table 89: Oceania AR Optical Waveguide Module Revenue (undefined) Forecast, by Application 2020 & 2033
- Table 90: Oceania AR Optical Waveguide Module Volume (K) Forecast, by Application 2020 & 2033
- Table 91: Rest of Asia Pacific AR Optical Waveguide Module Revenue (undefined) Forecast, by Application 2020 & 2033
- Table 92: Rest of Asia Pacific AR Optical Waveguide Module Volume (K) Forecast, by Application 2020 & 2033
Frequently Asked Questions
1. What is the projected Compound Annual Growth Rate (CAGR) of the AR Optical Waveguide Module?
The projected CAGR is approximately 37.08%.
2. Which companies are prominent players in the AR Optical Waveguide Module?
Key companies in the market include VX CNED, North Ocean Photonics, Lochn Optics, Sunny Optical Technology, Crystal Optoelectronic Technology, Lingxi-AR Technology Co., Ltd, Beijing NED Display Technology Co., LTD.
3. What are the main segments of the AR Optical Waveguide Module?
The market segments include Application, Types.
4. Can you provide details about the market size?
The market size is estimated to be USD XXX N/A as of 2022.
5. What are some drivers contributing to market growth?
N/A
6. What are the notable trends driving market growth?
N/A
7. Are there any restraints impacting market growth?
N/A
8. Can you provide examples of recent developments in the market?
N/A
9. What pricing options are available for accessing the report?
Pricing options include single-user, multi-user, and enterprise licenses priced at USD 3350.00, USD 5025.00, and USD 6700.00 respectively.
10. Is the market size provided in terms of value or volume?
The market size is provided in terms of value, measured in N/A and volume, measured in K.
11. Are there any specific market keywords associated with the report?
Yes, the market keyword associated with the report is "AR Optical Waveguide Module," which aids in identifying and referencing the specific market segment covered.
12. How do I determine which pricing option suits my needs best?
The pricing options vary based on user requirements and access needs. Individual users may opt for single-user licenses, while businesses requiring broader access may choose multi-user or enterprise licenses for cost-effective access to the report.
13. Are there any additional resources or data provided in the AR Optical Waveguide Module report?
While the report offers comprehensive insights, it's advisable to review the specific contents or supplementary materials provided to ascertain if additional resources or data are available.
14. How can I stay updated on further developments or reports in the AR Optical Waveguide Module?
To stay informed about further developments, trends, and reports in the AR Optical Waveguide Module, consider subscribing to industry newsletters, following relevant companies and organizations, or regularly checking reputable industry news sources and publications.
Methodology
Step 1 - Identification of Relevant Samples Size from Population Database


Step 2 - Approaches for Defining Global Market Size (Value, Volume* & Price*)

Note*: In applicable scenarios
Step 3 - Data Sources
Primary Research
- Web Analytics
- Survey Reports
- Research Institute
- Latest Research Reports
- Opinion Leaders
Secondary Research
- Annual Reports
- White Paper
- Latest Press Release
- Industry Association
- Paid Database
- Investor Presentations

Step 4 - Data Triangulation
Involves using different sources of information in order to increase the validity of a study
These sources are likely to be stakeholders in a program - participants, other researchers, program staff, other community members, and so on.
Then we put all data in single framework & apply various statistical tools to find out the dynamic on the market.
During the analysis stage, feedback from the stakeholder groups would be compared to determine areas of agreement as well as areas of divergence