
Key Insights
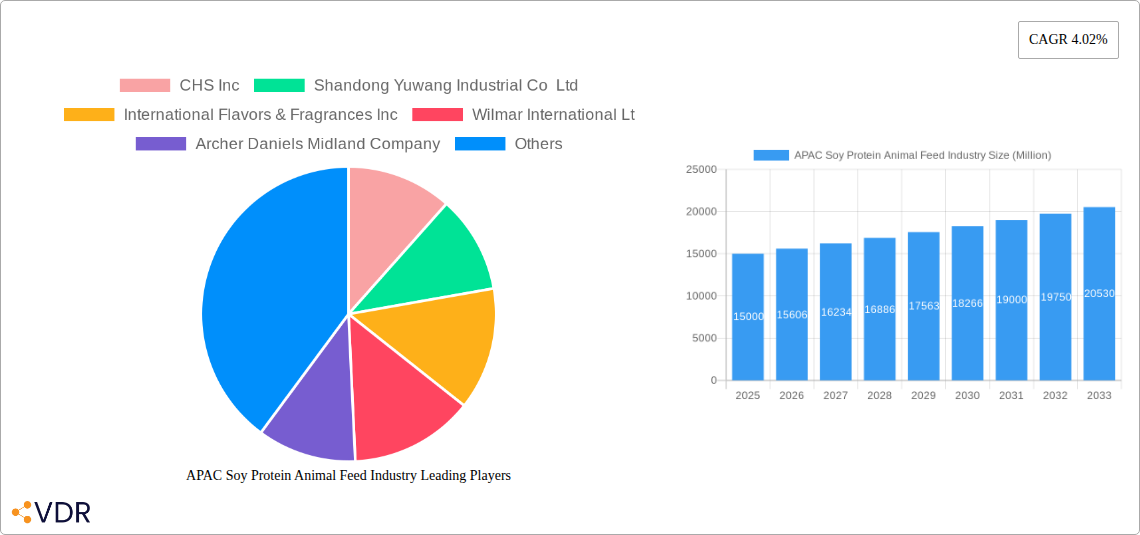
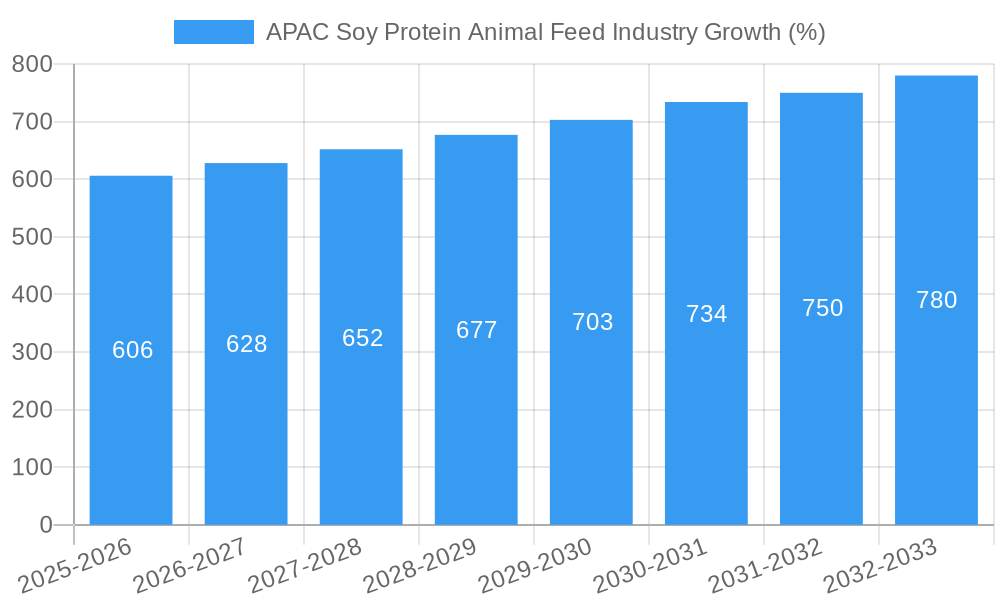
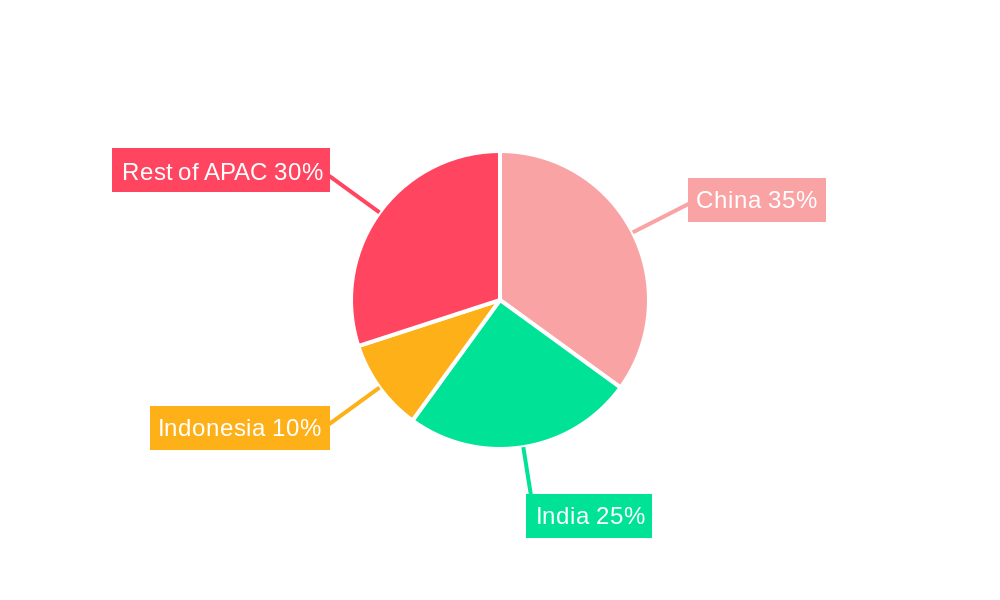
The Asia-Pacific (APAC) soy protein animal feed industry is experiencing robust growth, driven by rising demand for animal protein, increasing consumer awareness of sustainable feed options, and the favorable nutritional profile of soy protein. The region's burgeoning livestock sector, particularly in countries like China, India, and Indonesia, significantly fuels this market expansion. A compound annual growth rate (CAGR) of 4.02% indicates a steady upward trajectory, with projections suggesting continued market expansion throughout the forecast period (2025-2033). Key growth drivers include the increasing affordability and availability of soy protein, advancements in soy protein processing technologies leading to improved digestibility and palatability in animal feed, and government initiatives promoting sustainable and efficient livestock farming practices. While challenges exist, such as fluctuations in soy prices and concerns about genetically modified organisms (GMOs), the overall market outlook remains positive. The concentrated soy protein segment holds a significant market share due to its cost-effectiveness and ease of incorporation into feed formulations. Furthermore, the animal feed end-user segment dominates, representing a substantial portion of the overall market volume. The segmentation within APAC reveals varying growth rates across countries, with China and India leading in consumption due to their large livestock populations and increasing per capita meat consumption.
The competitive landscape is characterized by a mix of global and regional players, each vying for a larger share of the market. Major companies like Cargill, ADM, and Wilmar International are leveraging their established distribution networks and product portfolios to maintain their leadership. However, smaller, regional companies are gaining traction through focused strategies targeting niche markets and offering specialized products tailored to local consumer preferences and animal feed requirements. Future growth will be shaped by innovations in soy protein processing, the adoption of sustainable farming practices, and government regulations concerning feed safety and composition. Furthermore, the increasing focus on traceability and transparency in the supply chain will significantly influence consumer choices and market dynamics within the APAC soy protein animal feed industry. This sustained growth necessitates strategic investments in research and development, efficient supply chain management, and the exploration of new markets and partnerships to capitalize on the industry's considerable potential.
APAC Soy Protein Animal Feed Industry Market Report: 2019-2033
This comprehensive report provides a detailed analysis of the Asia-Pacific (APAC) soy protein animal feed industry, covering market dynamics, growth trends, key players, and future outlook. The study period spans from 2019 to 2033, with 2025 serving as the base and estimated year. The report delves into various segments, including different soy protein forms (concentrates, isolates, textured/hydrolyzed), major countries (Australia, China, India, Indonesia, Japan, Malaysia, New Zealand, South Korea, Thailand, Vietnam, and Rest of Asia-Pacific), and end-users (animal feed, food and beverages, sport/performance nutrition). This in-depth analysis is crucial for businesses operating or planning to enter this dynamic market. The report's quantitative and qualitative insights will guide strategic decision-making and maximize market opportunities. Market values are presented in million units.
APAC Soy Protein Animal Feed Industry Market Dynamics & Structure
The APAC soy protein animal feed market is characterized by moderate concentration, with key players like Cargill Incorporated, Archer Daniels Midland Company, and Wilmar International Ltd holding significant market share (xx%). Technological innovation, driven by the demand for sustainable and high-protein feed solutions, is a primary growth driver. Stringent regulatory frameworks concerning food safety and animal feed composition influence market operations. Competitive substitutes, such as other plant-based proteins (e.g., pea protein), pose a challenge. The end-user demographic is largely driven by the burgeoning livestock and aquaculture sectors in the region. M&A activity remains relatively low (xx deals in the past five years), indicating a focus on organic growth among major players.
- Market Concentration: Moderately concentrated, with top 5 players holding xx% market share.
- Technological Innovation: Focus on improving protein extraction, functional properties, and sustainability.
- Regulatory Framework: Stringent regulations on food safety and labeling impact market dynamics.
- Competitive Substitutes: Plant-based protein alternatives such as pea and canola protein are emerging competitors.
- End-User Demographics: Growth driven by the expansion of the livestock and aquaculture industries.
- M&A Trends: Low M&A activity, with companies focusing on organic growth and product diversification.
APAC Soy Protein Animal Feed Industry Growth Trends & Insights
The APAC soy protein animal feed market experienced significant growth during the historical period (2019-2024), exhibiting a CAGR of xx%. This growth is attributed to factors such as rising demand for animal protein, increasing consumer awareness of health and nutrition, and the growing adoption of sustainable and plant-based feed alternatives. Technological disruptions, such as advanced protein extraction and processing techniques, further propelled market expansion. Shifting consumer preferences towards healthier and more ethically sourced animal products have also influenced market dynamics. Market penetration is estimated at xx% in 2025, with continued growth projected for the forecast period (2025-2033) at a CAGR of xx%, reaching xx million units by 2033.
Dominant Regions, Countries, or Segments in APAC Soy Protein Animal Feed Industry
China dominates the APAC soy protein animal feed market, accounting for xx% of the total market share in 2025. This dominance is driven by its vast livestock and poultry industry, coupled with supportive government policies promoting sustainable agriculture. India and Indonesia also represent significant markets, exhibiting strong growth potential due to expanding livestock populations and rising demand for high-protein diets. Within soy protein forms, isolates demonstrate the highest growth rate (xx%), primarily due to their high protein content and functional versatility. The animal feed end-user segment accounts for the largest market share (xx%), reflecting the substantial demand from the livestock and aquaculture sectors.
- Key Drivers for China: Large livestock population, government support for agricultural development, and increasing consumer demand for meat.
- India and Indonesia Growth: Expanding livestock populations, rising incomes, and increasing demand for affordable protein sources.
- Isolates Segment Dominance: High protein content, functional versatility, and suitability for various animal feed formulations.
- Animal Feed End-User: Largest market segment due to high demand from the livestock and aquaculture industries.
APAC Soy Protein Animal Feed Industry Product Landscape
The APAC soy protein animal feed market showcases a diverse product landscape, encompassing concentrates, isolates, and textured/hydrolyzed soy protein. Innovations focus on improving protein solubility, digestibility, and functional properties to enhance feed efficiency and animal performance. Products are tailored to specific animal species and feed types, focusing on optimizing nutrient profiles and meeting nutritional requirements. Recent advancements include the development of soy protein ingredients with enhanced amino acid profiles and improved palatability to maximize animal feed acceptance.
Key Drivers, Barriers & Challenges in APAP Soy Protein Animal Feed Industry
Key Drivers:
- Growing demand for animal protein in the region.
- Increasing focus on sustainable and plant-based feed solutions.
- Technological advancements improving protein extraction and processing.
- Government support for agricultural development in key markets.
Key Barriers and Challenges:
- Fluctuations in soy prices impacting production costs.
- Competition from other plant-based protein sources.
- Regulatory hurdles related to food safety and labeling.
- Supply chain disruptions and logistical challenges. (Estimated impact: xx% reduction in production in 2023).
Emerging Opportunities in APAC Soy Protein Animal Feed Industry
- Growing demand for functional and specialized animal feeds.
- Increasing interest in sustainable and ethical sourcing of feed ingredients.
- Expanding aquaculture sector offering new market opportunities.
- Development of novel soy protein formulations with enhanced nutritional benefits.
Growth Accelerators in the APAC Soy Protein Animal Feed Industry
Long-term growth will be fueled by technological breakthroughs in protein extraction and processing, strategic partnerships between soy protein producers and animal feed manufacturers, and expansion into untapped markets within the region. Furthermore, government initiatives promoting sustainable agriculture and the growing adoption of precision feeding technologies will also significantly contribute to market growth.
Key Players Shaping the APAC Soy Protein Animal Feed Industry Market
- CHS Inc
- Shandong Yuwang Industrial Co Ltd
- International Flavors & Fragrances Inc
- Wilmar International Ltd
- Archer Daniels Midland Company
- Bunge Limited
- Fuji Oil Group
- Kerry Group PLC
- Foodchem International Corporation
- Cargill Incorporated
Notable Milestones in APAC Soy Protein Animal Feed Industry Sector
- July 2020: DuPont Nutrition & Biosciences (a subsidiary of IFF) launched the Danisco Planit range, offering a broad assortment of plant-based ingredients, including soy proteins. This significantly expanded the options available for plant-based feed development.
- March 2019: DuPont launched SUPRO soy-based Protein Nuggets, broadening the range of high-protein plant-based options for animal feed applications.
- January 2019: Fuji Oil Holdings Inc. invested JPY 2.4 billion in a new soy processing plant, increasing production capacity and potentially expanding market reach.
In-Depth APAC Soy Protein Animal Feed Industry Market Outlook
The APAC soy protein animal feed market exhibits considerable long-term growth potential, driven by continuous technological advancements, increasing demand for animal protein, and a growing emphasis on sustainable feed solutions. Strategic partnerships, investments in research and development, and expansion into new markets will be crucial for companies seeking to capitalize on the numerous opportunities within this dynamic sector. The market is poised for significant expansion, offering attractive prospects for established players and new entrants alike.
APAC Soy Protein Animal Feed Industry Segmentation
-
1. Form
- 1.1. Concentrates
- 1.2. Isolates
- 1.3. Textured/Hydrolyzed
-
2. End User
- 2.1. Animal Feed
-
2.2. Food and Beverages
-
2.2.1. By Sub End User
- 2.2.1.1. Bakery
- 2.2.1.2. Breakfast Cereals
- 2.2.1.3. Condiments/Sauces
- 2.2.1.4. Dairy and Dairy Alternative Products
- 2.2.1.5. Meat/Poultry/Seafood and Meat Alternative Products
- 2.2.1.6. RTE/RTC Food Products
- 2.2.1.7. Snacks
-
2.2.1. By Sub End User
- 2.3. Personal Care and Cosmetics
-
2.4. Supplements
- 2.4.1. Baby Food and Infant Formula
- 2.4.2. Elderly Nutrition and Medical Nutrition
- 2.4.3. Sport/Performance Nutrition
APAC Soy Protein Animal Feed Industry Segmentation By Geography
-
1. North America
- 1.1. United States
- 1.2. Canada
- 1.3. Mexico
-
2. South America
- 2.1. Brazil
- 2.2. Argentina
- 2.3. Rest of South America
-
3. Europe
- 3.1. United Kingdom
- 3.2. Germany
- 3.3. France
- 3.4. Italy
- 3.5. Spain
- 3.6. Russia
- 3.7. Benelux
- 3.8. Nordics
- 3.9. Rest of Europe
-
4. Middle East & Africa
- 4.1. Turkey
- 4.2. Israel
- 4.3. GCC
- 4.4. North Africa
- 4.5. South Africa
- 4.6. Rest of Middle East & Africa
-
5. Asia Pacific
- 5.1. China
- 5.2. India
- 5.3. Japan
- 5.4. South Korea
- 5.5. ASEAN
- 5.6. Oceania
- 5.7. Rest of Asia Pacific
APAC Soy Protein Animal Feed Industry REPORT HIGHLIGHTS
| Aspects | Details |
|---|---|
| Study Period | 2019-2033 |
| Base Year | 2024 |
| Estimated Year | 2025 |
| Forecast Period | 2025-2033 |
| Historical Period | 2019-2024 |
| Growth Rate | CAGR of 4.02% from 2019-2033 |
| Segmentation |
|
Table of Contents
- 1. Introduction
- 1.1. Research Scope
- 1.2. Market Segmentation
- 1.3. Research Methodology
- 1.4. Definitions and Assumptions
- 2. Executive Summary
- 2.1. Introduction
- 3. Market Dynamics
- 3.1. Introduction
- 3.2. Market Drivers
- 3.2.1. Increasing awareness towards fitness among consumers; Demand for convenient fortified foods
- 3.3. Market Restrains
- 3.3.1. Prevalence of allergen intolerance among the consumers
- 3.4. Market Trends
- 3.4.1. OTHER KEY INDUSTRY TRENDS COVERED IN THE REPORT
- 4. Market Factor Analysis
- 4.1. Porters Five Forces
- 4.2. Supply/Value Chain
- 4.3. PESTEL analysis
- 4.4. Market Entropy
- 4.5. Patent/Trademark Analysis
- 5. Global APAC Soy Protein Animal Feed Industry Analysis, Insights and Forecast, 2019-2031
- 5.1. Market Analysis, Insights and Forecast - by Form
- 5.1.1. Concentrates
- 5.1.2. Isolates
- 5.1.3. Textured/Hydrolyzed
- 5.2. Market Analysis, Insights and Forecast - by End User
- 5.2.1. Animal Feed
- 5.2.2. Food and Beverages
- 5.2.2.1. By Sub End User
- 5.2.2.1.1. Bakery
- 5.2.2.1.2. Breakfast Cereals
- 5.2.2.1.3. Condiments/Sauces
- 5.2.2.1.4. Dairy and Dairy Alternative Products
- 5.2.2.1.5. Meat/Poultry/Seafood and Meat Alternative Products
- 5.2.2.1.6. RTE/RTC Food Products
- 5.2.2.1.7. Snacks
- 5.2.2.1. By Sub End User
- 5.2.3. Personal Care and Cosmetics
- 5.2.4. Supplements
- 5.2.4.1. Baby Food and Infant Formula
- 5.2.4.2. Elderly Nutrition and Medical Nutrition
- 5.2.4.3. Sport/Performance Nutrition
- 5.3. Market Analysis, Insights and Forecast - by Region
- 5.3.1. North America
- 5.3.2. South America
- 5.3.3. Europe
- 5.3.4. Middle East & Africa
- 5.3.5. Asia Pacific
- 5.1. Market Analysis, Insights and Forecast - by Form
- 6. North America APAC Soy Protein Animal Feed Industry Analysis, Insights and Forecast, 2019-2031
- 6.1. Market Analysis, Insights and Forecast - by Form
- 6.1.1. Concentrates
- 6.1.2. Isolates
- 6.1.3. Textured/Hydrolyzed
- 6.2. Market Analysis, Insights and Forecast - by End User
- 6.2.1. Animal Feed
- 6.2.2. Food and Beverages
- 6.2.2.1. By Sub End User
- 6.2.2.1.1. Bakery
- 6.2.2.1.2. Breakfast Cereals
- 6.2.2.1.3. Condiments/Sauces
- 6.2.2.1.4. Dairy and Dairy Alternative Products
- 6.2.2.1.5. Meat/Poultry/Seafood and Meat Alternative Products
- 6.2.2.1.6. RTE/RTC Food Products
- 6.2.2.1.7. Snacks
- 6.2.2.1. By Sub End User
- 6.2.3. Personal Care and Cosmetics
- 6.2.4. Supplements
- 6.2.4.1. Baby Food and Infant Formula
- 6.2.4.2. Elderly Nutrition and Medical Nutrition
- 6.2.4.3. Sport/Performance Nutrition
- 6.1. Market Analysis, Insights and Forecast - by Form
- 7. South America APAC Soy Protein Animal Feed Industry Analysis, Insights and Forecast, 2019-2031
- 7.1. Market Analysis, Insights and Forecast - by Form
- 7.1.1. Concentrates
- 7.1.2. Isolates
- 7.1.3. Textured/Hydrolyzed
- 7.2. Market Analysis, Insights and Forecast - by End User
- 7.2.1. Animal Feed
- 7.2.2. Food and Beverages
- 7.2.2.1. By Sub End User
- 7.2.2.1.1. Bakery
- 7.2.2.1.2. Breakfast Cereals
- 7.2.2.1.3. Condiments/Sauces
- 7.2.2.1.4. Dairy and Dairy Alternative Products
- 7.2.2.1.5. Meat/Poultry/Seafood and Meat Alternative Products
- 7.2.2.1.6. RTE/RTC Food Products
- 7.2.2.1.7. Snacks
- 7.2.2.1. By Sub End User
- 7.2.3. Personal Care and Cosmetics
- 7.2.4. Supplements
- 7.2.4.1. Baby Food and Infant Formula
- 7.2.4.2. Elderly Nutrition and Medical Nutrition
- 7.2.4.3. Sport/Performance Nutrition
- 7.1. Market Analysis, Insights and Forecast - by Form
- 8. Europe APAC Soy Protein Animal Feed Industry Analysis, Insights and Forecast, 2019-2031
- 8.1. Market Analysis, Insights and Forecast - by Form
- 8.1.1. Concentrates
- 8.1.2. Isolates
- 8.1.3. Textured/Hydrolyzed
- 8.2. Market Analysis, Insights and Forecast - by End User
- 8.2.1. Animal Feed
- 8.2.2. Food and Beverages
- 8.2.2.1. By Sub End User
- 8.2.2.1.1. Bakery
- 8.2.2.1.2. Breakfast Cereals
- 8.2.2.1.3. Condiments/Sauces
- 8.2.2.1.4. Dairy and Dairy Alternative Products
- 8.2.2.1.5. Meat/Poultry/Seafood and Meat Alternative Products
- 8.2.2.1.6. RTE/RTC Food Products
- 8.2.2.1.7. Snacks
- 8.2.2.1. By Sub End User
- 8.2.3. Personal Care and Cosmetics
- 8.2.4. Supplements
- 8.2.4.1. Baby Food and Infant Formula
- 8.2.4.2. Elderly Nutrition and Medical Nutrition
- 8.2.4.3. Sport/Performance Nutrition
- 8.1. Market Analysis, Insights and Forecast - by Form
- 9. Middle East & Africa APAC Soy Protein Animal Feed Industry Analysis, Insights and Forecast, 2019-2031
- 9.1. Market Analysis, Insights and Forecast - by Form
- 9.1.1. Concentrates
- 9.1.2. Isolates
- 9.1.3. Textured/Hydrolyzed
- 9.2. Market Analysis, Insights and Forecast - by End User
- 9.2.1. Animal Feed
- 9.2.2. Food and Beverages
- 9.2.2.1. By Sub End User
- 9.2.2.1.1. Bakery
- 9.2.2.1.2. Breakfast Cereals
- 9.2.2.1.3. Condiments/Sauces
- 9.2.2.1.4. Dairy and Dairy Alternative Products
- 9.2.2.1.5. Meat/Poultry/Seafood and Meat Alternative Products
- 9.2.2.1.6. RTE/RTC Food Products
- 9.2.2.1.7. Snacks
- 9.2.2.1. By Sub End User
- 9.2.3. Personal Care and Cosmetics
- 9.2.4. Supplements
- 9.2.4.1. Baby Food and Infant Formula
- 9.2.4.2. Elderly Nutrition and Medical Nutrition
- 9.2.4.3. Sport/Performance Nutrition
- 9.1. Market Analysis, Insights and Forecast - by Form
- 10. Asia Pacific APAC Soy Protein Animal Feed Industry Analysis, Insights and Forecast, 2019-2031
- 10.1. Market Analysis, Insights and Forecast - by Form
- 10.1.1. Concentrates
- 10.1.2. Isolates
- 10.1.3. Textured/Hydrolyzed
- 10.2. Market Analysis, Insights and Forecast - by End User
- 10.2.1. Animal Feed
- 10.2.2. Food and Beverages
- 10.2.2.1. By Sub End User
- 10.2.2.1.1. Bakery
- 10.2.2.1.2. Breakfast Cereals
- 10.2.2.1.3. Condiments/Sauces
- 10.2.2.1.4. Dairy and Dairy Alternative Products
- 10.2.2.1.5. Meat/Poultry/Seafood and Meat Alternative Products
- 10.2.2.1.6. RTE/RTC Food Products
- 10.2.2.1.7. Snacks
- 10.2.2.1. By Sub End User
- 10.2.3. Personal Care and Cosmetics
- 10.2.4. Supplements
- 10.2.4.1. Baby Food and Infant Formula
- 10.2.4.2. Elderly Nutrition and Medical Nutrition
- 10.2.4.3. Sport/Performance Nutrition
- 10.1. Market Analysis, Insights and Forecast - by Form
- 11. North America APAC Soy Protein Animal Feed Industry Analysis, Insights and Forecast, 2019-2031
- 11.1. Market Analysis, Insights and Forecast - By Country/Sub-region
- 11.1.1 United States
- 11.1.2 Canada
- 11.1.3 Mexico
- 11.1.4 Rest of North America
- 12. Europe APAC Soy Protein Animal Feed Industry Analysis, Insights and Forecast, 2019-2031
- 12.1. Market Analysis, Insights and Forecast - By Country/Sub-region
- 12.1.1 Germany
- 12.1.2 United Kingdom
- 12.1.3 France
- 12.1.4 Russia
- 12.1.5 Spain
- 12.1.6 Italy
- 12.1.7 Rest of Europe
- 13. Asia Pacific APAC Soy Protein Animal Feed Industry Analysis, Insights and Forecast, 2019-2031
- 13.1. Market Analysis, Insights and Forecast - By Country/Sub-region
- 13.1.1 China
- 13.1.2 Japan
- 13.1.3 India
- 13.1.4 Australia
- 13.1.5 Rest of Asia Pacific
- 14. South America APAC Soy Protein Animal Feed Industry Analysis, Insights and Forecast, 2019-2031
- 14.1. Market Analysis, Insights and Forecast - By Country/Sub-region
- 14.1.1 Brazil
- 14.1.2 Argentina
- 14.1.3 Rest of South America
- 15. Middle East and Africa APAC Soy Protein Animal Feed Industry Analysis, Insights and Forecast, 2019-2031
- 15.1. Market Analysis, Insights and Forecast - By Country/Sub-region
- 15.1.1 United Arab Emirates
- 15.1.2 South Africa
- 15.1.3 Rest of Middle East and Africa
- 16. Competitive Analysis
- 16.1. Global Market Share Analysis 2024
- 16.2. Company Profiles
- 16.2.1 CHS Inc
- 16.2.1.1. Overview
- 16.2.1.2. Products
- 16.2.1.3. SWOT Analysis
- 16.2.1.4. Recent Developments
- 16.2.1.5. Financials (Based on Availability)
- 16.2.2 Shandong Yuwang Industrial Co Ltd
- 16.2.2.1. Overview
- 16.2.2.2. Products
- 16.2.2.3. SWOT Analysis
- 16.2.2.4. Recent Developments
- 16.2.2.5. Financials (Based on Availability)
- 16.2.3 International Flavors & Fragrances Inc
- 16.2.3.1. Overview
- 16.2.3.2. Products
- 16.2.3.3. SWOT Analysis
- 16.2.3.4. Recent Developments
- 16.2.3.5. Financials (Based on Availability)
- 16.2.4 Wilmar International Lt
- 16.2.4.1. Overview
- 16.2.4.2. Products
- 16.2.4.3. SWOT Analysis
- 16.2.4.4. Recent Developments
- 16.2.4.5. Financials (Based on Availability)
- 16.2.5 Archer Daniels Midland Company
- 16.2.5.1. Overview
- 16.2.5.2. Products
- 16.2.5.3. SWOT Analysis
- 16.2.5.4. Recent Developments
- 16.2.5.5. Financials (Based on Availability)
- 16.2.6 Bunge Limited
- 16.2.6.1. Overview
- 16.2.6.2. Products
- 16.2.6.3. SWOT Analysis
- 16.2.6.4. Recent Developments
- 16.2.6.5. Financials (Based on Availability)
- 16.2.7 Fuji Oil Group
- 16.2.7.1. Overview
- 16.2.7.2. Products
- 16.2.7.3. SWOT Analysis
- 16.2.7.4. Recent Developments
- 16.2.7.5. Financials (Based on Availability)
- 16.2.8 Kerry Group PLC
- 16.2.8.1. Overview
- 16.2.8.2. Products
- 16.2.8.3. SWOT Analysis
- 16.2.8.4. Recent Developments
- 16.2.8.5. Financials (Based on Availability)
- 16.2.9 Foodchem International Corporation
- 16.2.9.1. Overview
- 16.2.9.2. Products
- 16.2.9.3. SWOT Analysis
- 16.2.9.4. Recent Developments
- 16.2.9.5. Financials (Based on Availability)
- 16.2.10 Cargill Incorporated
- 16.2.10.1. Overview
- 16.2.10.2. Products
- 16.2.10.3. SWOT Analysis
- 16.2.10.4. Recent Developments
- 16.2.10.5. Financials (Based on Availability)
- 16.2.1 CHS Inc
List of Figures
- Figure 1: Global APAC Soy Protein Animal Feed Industry Revenue Breakdown (Million, %) by Region 2024 & 2032
- Figure 2: Global APAC Soy Protein Animal Feed Industry Volume Breakdown (K Tons, %) by Region 2024 & 2032
- Figure 3: North America APAC Soy Protein Animal Feed Industry Revenue (Million), by Country 2024 & 2032
- Figure 4: North America APAC Soy Protein Animal Feed Industry Volume (K Tons), by Country 2024 & 2032
- Figure 5: North America APAC Soy Protein Animal Feed Industry Revenue Share (%), by Country 2024 & 2032
- Figure 6: North America APAC Soy Protein Animal Feed Industry Volume Share (%), by Country 2024 & 2032
- Figure 7: Europe APAC Soy Protein Animal Feed Industry Revenue (Million), by Country 2024 & 2032
- Figure 8: Europe APAC Soy Protein Animal Feed Industry Volume (K Tons), by Country 2024 & 2032
- Figure 9: Europe APAC Soy Protein Animal Feed Industry Revenue Share (%), by Country 2024 & 2032
- Figure 10: Europe APAC Soy Protein Animal Feed Industry Volume Share (%), by Country 2024 & 2032
- Figure 11: Asia Pacific APAC Soy Protein Animal Feed Industry Revenue (Million), by Country 2024 & 2032
- Figure 12: Asia Pacific APAC Soy Protein Animal Feed Industry Volume (K Tons), by Country 2024 & 2032
- Figure 13: Asia Pacific APAC Soy Protein Animal Feed Industry Revenue Share (%), by Country 2024 & 2032
- Figure 14: Asia Pacific APAC Soy Protein Animal Feed Industry Volume Share (%), by Country 2024 & 2032
- Figure 15: South America APAC Soy Protein Animal Feed Industry Revenue (Million), by Country 2024 & 2032
- Figure 16: South America APAC Soy Protein Animal Feed Industry Volume (K Tons), by Country 2024 & 2032
- Figure 17: South America APAC Soy Protein Animal Feed Industry Revenue Share (%), by Country 2024 & 2032
- Figure 18: South America APAC Soy Protein Animal Feed Industry Volume Share (%), by Country 2024 & 2032
- Figure 19: Middle East and Africa APAC Soy Protein Animal Feed Industry Revenue (Million), by Country 2024 & 2032
- Figure 20: Middle East and Africa APAC Soy Protein Animal Feed Industry Volume (K Tons), by Country 2024 & 2032
- Figure 21: Middle East and Africa APAC Soy Protein Animal Feed Industry Revenue Share (%), by Country 2024 & 2032
- Figure 22: Middle East and Africa APAC Soy Protein Animal Feed Industry Volume Share (%), by Country 2024 & 2032
- Figure 23: North America APAC Soy Protein Animal Feed Industry Revenue (Million), by Form 2024 & 2032
- Figure 24: North America APAC Soy Protein Animal Feed Industry Volume (K Tons), by Form 2024 & 2032
- Figure 25: North America APAC Soy Protein Animal Feed Industry Revenue Share (%), by Form 2024 & 2032
- Figure 26: North America APAC Soy Protein Animal Feed Industry Volume Share (%), by Form 2024 & 2032
- Figure 27: North America APAC Soy Protein Animal Feed Industry Revenue (Million), by End User 2024 & 2032
- Figure 28: North America APAC Soy Protein Animal Feed Industry Volume (K Tons), by End User 2024 & 2032
- Figure 29: North America APAC Soy Protein Animal Feed Industry Revenue Share (%), by End User 2024 & 2032
- Figure 30: North America APAC Soy Protein Animal Feed Industry Volume Share (%), by End User 2024 & 2032
- Figure 31: North America APAC Soy Protein Animal Feed Industry Revenue (Million), by Country 2024 & 2032
- Figure 32: North America APAC Soy Protein Animal Feed Industry Volume (K Tons), by Country 2024 & 2032
- Figure 33: North America APAC Soy Protein Animal Feed Industry Revenue Share (%), by Country 2024 & 2032
- Figure 34: North America APAC Soy Protein Animal Feed Industry Volume Share (%), by Country 2024 & 2032
- Figure 35: South America APAC Soy Protein Animal Feed Industry Revenue (Million), by Form 2024 & 2032
- Figure 36: South America APAC Soy Protein Animal Feed Industry Volume (K Tons), by Form 2024 & 2032
- Figure 37: South America APAC Soy Protein Animal Feed Industry Revenue Share (%), by Form 2024 & 2032
- Figure 38: South America APAC Soy Protein Animal Feed Industry Volume Share (%), by Form 2024 & 2032
- Figure 39: South America APAC Soy Protein Animal Feed Industry Revenue (Million), by End User 2024 & 2032
- Figure 40: South America APAC Soy Protein Animal Feed Industry Volume (K Tons), by End User 2024 & 2032
- Figure 41: South America APAC Soy Protein Animal Feed Industry Revenue Share (%), by End User 2024 & 2032
- Figure 42: South America APAC Soy Protein Animal Feed Industry Volume Share (%), by End User 2024 & 2032
- Figure 43: South America APAC Soy Protein Animal Feed Industry Revenue (Million), by Country 2024 & 2032
- Figure 44: South America APAC Soy Protein Animal Feed Industry Volume (K Tons), by Country 2024 & 2032
- Figure 45: South America APAC Soy Protein Animal Feed Industry Revenue Share (%), by Country 2024 & 2032
- Figure 46: South America APAC Soy Protein Animal Feed Industry Volume Share (%), by Country 2024 & 2032
- Figure 47: Europe APAC Soy Protein Animal Feed Industry Revenue (Million), by Form 2024 & 2032
- Figure 48: Europe APAC Soy Protein Animal Feed Industry Volume (K Tons), by Form 2024 & 2032
- Figure 49: Europe APAC Soy Protein Animal Feed Industry Revenue Share (%), by Form 2024 & 2032
- Figure 50: Europe APAC Soy Protein Animal Feed Industry Volume Share (%), by Form 2024 & 2032
- Figure 51: Europe APAC Soy Protein Animal Feed Industry Revenue (Million), by End User 2024 & 2032
- Figure 52: Europe APAC Soy Protein Animal Feed Industry Volume (K Tons), by End User 2024 & 2032
- Figure 53: Europe APAC Soy Protein Animal Feed Industry Revenue Share (%), by End User 2024 & 2032
- Figure 54: Europe APAC Soy Protein Animal Feed Industry Volume Share (%), by End User 2024 & 2032
- Figure 55: Europe APAC Soy Protein Animal Feed Industry Revenue (Million), by Country 2024 & 2032
- Figure 56: Europe APAC Soy Protein Animal Feed Industry Volume (K Tons), by Country 2024 & 2032
- Figure 57: Europe APAC Soy Protein Animal Feed Industry Revenue Share (%), by Country 2024 & 2032
- Figure 58: Europe APAC Soy Protein Animal Feed Industry Volume Share (%), by Country 2024 & 2032
- Figure 59: Middle East & Africa APAC Soy Protein Animal Feed Industry Revenue (Million), by Form 2024 & 2032
- Figure 60: Middle East & Africa APAC Soy Protein Animal Feed Industry Volume (K Tons), by Form 2024 & 2032
- Figure 61: Middle East & Africa APAC Soy Protein Animal Feed Industry Revenue Share (%), by Form 2024 & 2032
- Figure 62: Middle East & Africa APAC Soy Protein Animal Feed Industry Volume Share (%), by Form 2024 & 2032
- Figure 63: Middle East & Africa APAC Soy Protein Animal Feed Industry Revenue (Million), by End User 2024 & 2032
- Figure 64: Middle East & Africa APAC Soy Protein Animal Feed Industry Volume (K Tons), by End User 2024 & 2032
- Figure 65: Middle East & Africa APAC Soy Protein Animal Feed Industry Revenue Share (%), by End User 2024 & 2032
- Figure 66: Middle East & Africa APAC Soy Protein Animal Feed Industry Volume Share (%), by End User 2024 & 2032
- Figure 67: Middle East & Africa APAC Soy Protein Animal Feed Industry Revenue (Million), by Country 2024 & 2032
- Figure 68: Middle East & Africa APAC Soy Protein Animal Feed Industry Volume (K Tons), by Country 2024 & 2032
- Figure 69: Middle East & Africa APAC Soy Protein Animal Feed Industry Revenue Share (%), by Country 2024 & 2032
- Figure 70: Middle East & Africa APAC Soy Protein Animal Feed Industry Volume Share (%), by Country 2024 & 2032
- Figure 71: Asia Pacific APAC Soy Protein Animal Feed Industry Revenue (Million), by Form 2024 & 2032
- Figure 72: Asia Pacific APAC Soy Protein Animal Feed Industry Volume (K Tons), by Form 2024 & 2032
- Figure 73: Asia Pacific APAC Soy Protein Animal Feed Industry Revenue Share (%), by Form 2024 & 2032
- Figure 74: Asia Pacific APAC Soy Protein Animal Feed Industry Volume Share (%), by Form 2024 & 2032
- Figure 75: Asia Pacific APAC Soy Protein Animal Feed Industry Revenue (Million), by End User 2024 & 2032
- Figure 76: Asia Pacific APAC Soy Protein Animal Feed Industry Volume (K Tons), by End User 2024 & 2032
- Figure 77: Asia Pacific APAC Soy Protein Animal Feed Industry Revenue Share (%), by End User 2024 & 2032
- Figure 78: Asia Pacific APAC Soy Protein Animal Feed Industry Volume Share (%), by End User 2024 & 2032
- Figure 79: Asia Pacific APAC Soy Protein Animal Feed Industry Revenue (Million), by Country 2024 & 2032
- Figure 80: Asia Pacific APAC Soy Protein Animal Feed Industry Volume (K Tons), by Country 2024 & 2032
- Figure 81: Asia Pacific APAC Soy Protein Animal Feed Industry Revenue Share (%), by Country 2024 & 2032
- Figure 82: Asia Pacific APAC Soy Protein Animal Feed Industry Volume Share (%), by Country 2024 & 2032
List of Tables
- Table 1: Global APAC Soy Protein Animal Feed Industry Revenue Million Forecast, by Region 2019 & 2032
- Table 2: Global APAC Soy Protein Animal Feed Industry Volume K Tons Forecast, by Region 2019 & 2032
- Table 3: Global APAC Soy Protein Animal Feed Industry Revenue Million Forecast, by Form 2019 & 2032
- Table 4: Global APAC Soy Protein Animal Feed Industry Volume K Tons Forecast, by Form 2019 & 2032
- Table 5: Global APAC Soy Protein Animal Feed Industry Revenue Million Forecast, by End User 2019 & 2032
- Table 6: Global APAC Soy Protein Animal Feed Industry Volume K Tons Forecast, by End User 2019 & 2032
- Table 7: Global APAC Soy Protein Animal Feed Industry Revenue Million Forecast, by Region 2019 & 2032
- Table 8: Global APAC Soy Protein Animal Feed Industry Volume K Tons Forecast, by Region 2019 & 2032
- Table 9: Global APAC Soy Protein Animal Feed Industry Revenue Million Forecast, by Country 2019 & 2032
- Table 10: Global APAC Soy Protein Animal Feed Industry Volume K Tons Forecast, by Country 2019 & 2032
- Table 11: United States APAC Soy Protein Animal Feed Industry Revenue (Million) Forecast, by Application 2019 & 2032
- Table 12: United States APAC Soy Protein Animal Feed Industry Volume (K Tons) Forecast, by Application 2019 & 2032
- Table 13: Canada APAC Soy Protein Animal Feed Industry Revenue (Million) Forecast, by Application 2019 & 2032
- Table 14: Canada APAC Soy Protein Animal Feed Industry Volume (K Tons) Forecast, by Application 2019 & 2032
- Table 15: Mexico APAC Soy Protein Animal Feed Industry Revenue (Million) Forecast, by Application 2019 & 2032
- Table 16: Mexico APAC Soy Protein Animal Feed Industry Volume (K Tons) Forecast, by Application 2019 & 2032
- Table 17: Rest of North America APAC Soy Protein Animal Feed Industry Revenue (Million) Forecast, by Application 2019 & 2032
- Table 18: Rest of North America APAC Soy Protein Animal Feed Industry Volume (K Tons) Forecast, by Application 2019 & 2032
- Table 19: Global APAC Soy Protein Animal Feed Industry Revenue Million Forecast, by Country 2019 & 2032
- Table 20: Global APAC Soy Protein Animal Feed Industry Volume K Tons Forecast, by Country 2019 & 2032
- Table 21: Germany APAC Soy Protein Animal Feed Industry Revenue (Million) Forecast, by Application 2019 & 2032
- Table 22: Germany APAC Soy Protein Animal Feed Industry Volume (K Tons) Forecast, by Application 2019 & 2032
- Table 23: United Kingdom APAC Soy Protein Animal Feed Industry Revenue (Million) Forecast, by Application 2019 & 2032
- Table 24: United Kingdom APAC Soy Protein Animal Feed Industry Volume (K Tons) Forecast, by Application 2019 & 2032
- Table 25: France APAC Soy Protein Animal Feed Industry Revenue (Million) Forecast, by Application 2019 & 2032
- Table 26: France APAC Soy Protein Animal Feed Industry Volume (K Tons) Forecast, by Application 2019 & 2032
- Table 27: Russia APAC Soy Protein Animal Feed Industry Revenue (Million) Forecast, by Application 2019 & 2032
- Table 28: Russia APAC Soy Protein Animal Feed Industry Volume (K Tons) Forecast, by Application 2019 & 2032
- Table 29: Spain APAC Soy Protein Animal Feed Industry Revenue (Million) Forecast, by Application 2019 & 2032
- Table 30: Spain APAC Soy Protein Animal Feed Industry Volume (K Tons) Forecast, by Application 2019 & 2032
- Table 31: Italy APAC Soy Protein Animal Feed Industry Revenue (Million) Forecast, by Application 2019 & 2032
- Table 32: Italy APAC Soy Protein Animal Feed Industry Volume (K Tons) Forecast, by Application 2019 & 2032
- Table 33: Rest of Europe APAC Soy Protein Animal Feed Industry Revenue (Million) Forecast, by Application 2019 & 2032
- Table 34: Rest of Europe APAC Soy Protein Animal Feed Industry Volume (K Tons) Forecast, by Application 2019 & 2032
- Table 35: Global APAC Soy Protein Animal Feed Industry Revenue Million Forecast, by Country 2019 & 2032
- Table 36: Global APAC Soy Protein Animal Feed Industry Volume K Tons Forecast, by Country 2019 & 2032
- Table 37: China APAC Soy Protein Animal Feed Industry Revenue (Million) Forecast, by Application 2019 & 2032
- Table 38: China APAC Soy Protein Animal Feed Industry Volume (K Tons) Forecast, by Application 2019 & 2032
- Table 39: Japan APAC Soy Protein Animal Feed Industry Revenue (Million) Forecast, by Application 2019 & 2032
- Table 40: Japan APAC Soy Protein Animal Feed Industry Volume (K Tons) Forecast, by Application 2019 & 2032
- Table 41: India APAC Soy Protein Animal Feed Industry Revenue (Million) Forecast, by Application 2019 & 2032
- Table 42: India APAC Soy Protein Animal Feed Industry Volume (K Tons) Forecast, by Application 2019 & 2032
- Table 43: Australia APAC Soy Protein Animal Feed Industry Revenue (Million) Forecast, by Application 2019 & 2032
- Table 44: Australia APAC Soy Protein Animal Feed Industry Volume (K Tons) Forecast, by Application 2019 & 2032
- Table 45: Rest of Asia Pacific APAC Soy Protein Animal Feed Industry Revenue (Million) Forecast, by Application 2019 & 2032
- Table 46: Rest of Asia Pacific APAC Soy Protein Animal Feed Industry Volume (K Tons) Forecast, by Application 2019 & 2032
- Table 47: Global APAC Soy Protein Animal Feed Industry Revenue Million Forecast, by Country 2019 & 2032
- Table 48: Global APAC Soy Protein Animal Feed Industry Volume K Tons Forecast, by Country 2019 & 2032
- Table 49: Brazil APAC Soy Protein Animal Feed Industry Revenue (Million) Forecast, by Application 2019 & 2032
- Table 50: Brazil APAC Soy Protein Animal Feed Industry Volume (K Tons) Forecast, by Application 2019 & 2032
- Table 51: Argentina APAC Soy Protein Animal Feed Industry Revenue (Million) Forecast, by Application 2019 & 2032
- Table 52: Argentina APAC Soy Protein Animal Feed Industry Volume (K Tons) Forecast, by Application 2019 & 2032
- Table 53: Rest of South America APAC Soy Protein Animal Feed Industry Revenue (Million) Forecast, by Application 2019 & 2032
- Table 54: Rest of South America APAC Soy Protein Animal Feed Industry Volume (K Tons) Forecast, by Application 2019 & 2032
- Table 55: Global APAC Soy Protein Animal Feed Industry Revenue Million Forecast, by Country 2019 & 2032
- Table 56: Global APAC Soy Protein Animal Feed Industry Volume K Tons Forecast, by Country 2019 & 2032
- Table 57: United Arab Emirates APAC Soy Protein Animal Feed Industry Revenue (Million) Forecast, by Application 2019 & 2032
- Table 58: United Arab Emirates APAC Soy Protein Animal Feed Industry Volume (K Tons) Forecast, by Application 2019 & 2032
- Table 59: South Africa APAC Soy Protein Animal Feed Industry Revenue (Million) Forecast, by Application 2019 & 2032
- Table 60: South Africa APAC Soy Protein Animal Feed Industry Volume (K Tons) Forecast, by Application 2019 & 2032
- Table 61: Rest of Middle East and Africa APAC Soy Protein Animal Feed Industry Revenue (Million) Forecast, by Application 2019 & 2032
- Table 62: Rest of Middle East and Africa APAC Soy Protein Animal Feed Industry Volume (K Tons) Forecast, by Application 2019 & 2032
- Table 63: Global APAC Soy Protein Animal Feed Industry Revenue Million Forecast, by Form 2019 & 2032
- Table 64: Global APAC Soy Protein Animal Feed Industry Volume K Tons Forecast, by Form 2019 & 2032
- Table 65: Global APAC Soy Protein Animal Feed Industry Revenue Million Forecast, by End User 2019 & 2032
- Table 66: Global APAC Soy Protein Animal Feed Industry Volume K Tons Forecast, by End User 2019 & 2032
- Table 67: Global APAC Soy Protein Animal Feed Industry Revenue Million Forecast, by Country 2019 & 2032
- Table 68: Global APAC Soy Protein Animal Feed Industry Volume K Tons Forecast, by Country 2019 & 2032
- Table 69: United States APAC Soy Protein Animal Feed Industry Revenue (Million) Forecast, by Application 2019 & 2032
- Table 70: United States APAC Soy Protein Animal Feed Industry Volume (K Tons) Forecast, by Application 2019 & 2032
- Table 71: Canada APAC Soy Protein Animal Feed Industry Revenue (Million) Forecast, by Application 2019 & 2032
- Table 72: Canada APAC Soy Protein Animal Feed Industry Volume (K Tons) Forecast, by Application 2019 & 2032
- Table 73: Mexico APAC Soy Protein Animal Feed Industry Revenue (Million) Forecast, by Application 2019 & 2032
- Table 74: Mexico APAC Soy Protein Animal Feed Industry Volume (K Tons) Forecast, by Application 2019 & 2032
- Table 75: Global APAC Soy Protein Animal Feed Industry Revenue Million Forecast, by Form 2019 & 2032
- Table 76: Global APAC Soy Protein Animal Feed Industry Volume K Tons Forecast, by Form 2019 & 2032
- Table 77: Global APAC Soy Protein Animal Feed Industry Revenue Million Forecast, by End User 2019 & 2032
- Table 78: Global APAC Soy Protein Animal Feed Industry Volume K Tons Forecast, by End User 2019 & 2032
- Table 79: Global APAC Soy Protein Animal Feed Industry Revenue Million Forecast, by Country 2019 & 2032
- Table 80: Global APAC Soy Protein Animal Feed Industry Volume K Tons Forecast, by Country 2019 & 2032
- Table 81: Brazil APAC Soy Protein Animal Feed Industry Revenue (Million) Forecast, by Application 2019 & 2032
- Table 82: Brazil APAC Soy Protein Animal Feed Industry Volume (K Tons) Forecast, by Application 2019 & 2032
- Table 83: Argentina APAC Soy Protein Animal Feed Industry Revenue (Million) Forecast, by Application 2019 & 2032
- Table 84: Argentina APAC Soy Protein Animal Feed Industry Volume (K Tons) Forecast, by Application 2019 & 2032
- Table 85: Rest of South America APAC Soy Protein Animal Feed Industry Revenue (Million) Forecast, by Application 2019 & 2032
- Table 86: Rest of South America APAC Soy Protein Animal Feed Industry Volume (K Tons) Forecast, by Application 2019 & 2032
- Table 87: Global APAC Soy Protein Animal Feed Industry Revenue Million Forecast, by Form 2019 & 2032
- Table 88: Global APAC Soy Protein Animal Feed Industry Volume K Tons Forecast, by Form 2019 & 2032
- Table 89: Global APAC Soy Protein Animal Feed Industry Revenue Million Forecast, by End User 2019 & 2032
- Table 90: Global APAC Soy Protein Animal Feed Industry Volume K Tons Forecast, by End User 2019 & 2032
- Table 91: Global APAC Soy Protein Animal Feed Industry Revenue Million Forecast, by Country 2019 & 2032
- Table 92: Global APAC Soy Protein Animal Feed Industry Volume K Tons Forecast, by Country 2019 & 2032
- Table 93: United Kingdom APAC Soy Protein Animal Feed Industry Revenue (Million) Forecast, by Application 2019 & 2032
- Table 94: United Kingdom APAC Soy Protein Animal Feed Industry Volume (K Tons) Forecast, by Application 2019 & 2032
- Table 95: Germany APAC Soy Protein Animal Feed Industry Revenue (Million) Forecast, by Application 2019 & 2032
- Table 96: Germany APAC Soy Protein Animal Feed Industry Volume (K Tons) Forecast, by Application 2019 & 2032
- Table 97: France APAC Soy Protein Animal Feed Industry Revenue (Million) Forecast, by Application 2019 & 2032
- Table 98: France APAC Soy Protein Animal Feed Industry Volume (K Tons) Forecast, by Application 2019 & 2032
- Table 99: Italy APAC Soy Protein Animal Feed Industry Revenue (Million) Forecast, by Application 2019 & 2032
- Table 100: Italy APAC Soy Protein Animal Feed Industry Volume (K Tons) Forecast, by Application 2019 & 2032
- Table 101: Spain APAC Soy Protein Animal Feed Industry Revenue (Million) Forecast, by Application 2019 & 2032
- Table 102: Spain APAC Soy Protein Animal Feed Industry Volume (K Tons) Forecast, by Application 2019 & 2032
- Table 103: Russia APAC Soy Protein Animal Feed Industry Revenue (Million) Forecast, by Application 2019 & 2032
- Table 104: Russia APAC Soy Protein Animal Feed Industry Volume (K Tons) Forecast, by Application 2019 & 2032
- Table 105: Benelux APAC Soy Protein Animal Feed Industry Revenue (Million) Forecast, by Application 2019 & 2032
- Table 106: Benelux APAC Soy Protein Animal Feed Industry Volume (K Tons) Forecast, by Application 2019 & 2032
- Table 107: Nordics APAC Soy Protein Animal Feed Industry Revenue (Million) Forecast, by Application 2019 & 2032
- Table 108: Nordics APAC Soy Protein Animal Feed Industry Volume (K Tons) Forecast, by Application 2019 & 2032
- Table 109: Rest of Europe APAC Soy Protein Animal Feed Industry Revenue (Million) Forecast, by Application 2019 & 2032
- Table 110: Rest of Europe APAC Soy Protein Animal Feed Industry Volume (K Tons) Forecast, by Application 2019 & 2032
- Table 111: Global APAC Soy Protein Animal Feed Industry Revenue Million Forecast, by Form 2019 & 2032
- Table 112: Global APAC Soy Protein Animal Feed Industry Volume K Tons Forecast, by Form 2019 & 2032
- Table 113: Global APAC Soy Protein Animal Feed Industry Revenue Million Forecast, by End User 2019 & 2032
- Table 114: Global APAC Soy Protein Animal Feed Industry Volume K Tons Forecast, by End User 2019 & 2032
- Table 115: Global APAC Soy Protein Animal Feed Industry Revenue Million Forecast, by Country 2019 & 2032
- Table 116: Global APAC Soy Protein Animal Feed Industry Volume K Tons Forecast, by Country 2019 & 2032
- Table 117: Turkey APAC Soy Protein Animal Feed Industry Revenue (Million) Forecast, by Application 2019 & 2032
- Table 118: Turkey APAC Soy Protein Animal Feed Industry Volume (K Tons) Forecast, by Application 2019 & 2032
- Table 119: Israel APAC Soy Protein Animal Feed Industry Revenue (Million) Forecast, by Application 2019 & 2032
- Table 120: Israel APAC Soy Protein Animal Feed Industry Volume (K Tons) Forecast, by Application 2019 & 2032
- Table 121: GCC APAC Soy Protein Animal Feed Industry Revenue (Million) Forecast, by Application 2019 & 2032
- Table 122: GCC APAC Soy Protein Animal Feed Industry Volume (K Tons) Forecast, by Application 2019 & 2032
- Table 123: North Africa APAC Soy Protein Animal Feed Industry Revenue (Million) Forecast, by Application 2019 & 2032
- Table 124: North Africa APAC Soy Protein Animal Feed Industry Volume (K Tons) Forecast, by Application 2019 & 2032
- Table 125: South Africa APAC Soy Protein Animal Feed Industry Revenue (Million) Forecast, by Application 2019 & 2032
- Table 126: South Africa APAC Soy Protein Animal Feed Industry Volume (K Tons) Forecast, by Application 2019 & 2032
- Table 127: Rest of Middle East & Africa APAC Soy Protein Animal Feed Industry Revenue (Million) Forecast, by Application 2019 & 2032
- Table 128: Rest of Middle East & Africa APAC Soy Protein Animal Feed Industry Volume (K Tons) Forecast, by Application 2019 & 2032
- Table 129: Global APAC Soy Protein Animal Feed Industry Revenue Million Forecast, by Form 2019 & 2032
- Table 130: Global APAC Soy Protein Animal Feed Industry Volume K Tons Forecast, by Form 2019 & 2032
- Table 131: Global APAC Soy Protein Animal Feed Industry Revenue Million Forecast, by End User 2019 & 2032
- Table 132: Global APAC Soy Protein Animal Feed Industry Volume K Tons Forecast, by End User 2019 & 2032
- Table 133: Global APAC Soy Protein Animal Feed Industry Revenue Million Forecast, by Country 2019 & 2032
- Table 134: Global APAC Soy Protein Animal Feed Industry Volume K Tons Forecast, by Country 2019 & 2032
- Table 135: China APAC Soy Protein Animal Feed Industry Revenue (Million) Forecast, by Application 2019 & 2032
- Table 136: China APAC Soy Protein Animal Feed Industry Volume (K Tons) Forecast, by Application 2019 & 2032
- Table 137: India APAC Soy Protein Animal Feed Industry Revenue (Million) Forecast, by Application 2019 & 2032
- Table 138: India APAC Soy Protein Animal Feed Industry Volume (K Tons) Forecast, by Application 2019 & 2032
- Table 139: Japan APAC Soy Protein Animal Feed Industry Revenue (Million) Forecast, by Application 2019 & 2032
- Table 140: Japan APAC Soy Protein Animal Feed Industry Volume (K Tons) Forecast, by Application 2019 & 2032
- Table 141: South Korea APAC Soy Protein Animal Feed Industry Revenue (Million) Forecast, by Application 2019 & 2032
- Table 142: South Korea APAC Soy Protein Animal Feed Industry Volume (K Tons) Forecast, by Application 2019 & 2032
- Table 143: ASEAN APAC Soy Protein Animal Feed Industry Revenue (Million) Forecast, by Application 2019 & 2032
- Table 144: ASEAN APAC Soy Protein Animal Feed Industry Volume (K Tons) Forecast, by Application 2019 & 2032
- Table 145: Oceania APAC Soy Protein Animal Feed Industry Revenue (Million) Forecast, by Application 2019 & 2032
- Table 146: Oceania APAC Soy Protein Animal Feed Industry Volume (K Tons) Forecast, by Application 2019 & 2032
- Table 147: Rest of Asia Pacific APAC Soy Protein Animal Feed Industry Revenue (Million) Forecast, by Application 2019 & 2032
- Table 148: Rest of Asia Pacific APAC Soy Protein Animal Feed Industry Volume (K Tons) Forecast, by Application 2019 & 2032
Frequently Asked Questions
1. What is the projected Compound Annual Growth Rate (CAGR) of the APAC Soy Protein Animal Feed Industry?
The projected CAGR is approximately 4.02%.
2. Which companies are prominent players in the APAC Soy Protein Animal Feed Industry?
Key companies in the market include CHS Inc, Shandong Yuwang Industrial Co Ltd, International Flavors & Fragrances Inc, Wilmar International Lt, Archer Daniels Midland Company, Bunge Limited, Fuji Oil Group, Kerry Group PLC, Foodchem International Corporation, Cargill Incorporated.
3. What are the main segments of the APAC Soy Protein Animal Feed Industry?
The market segments include Form, End User.
4. Can you provide details about the market size?
The market size is estimated to be USD XX Million as of 2022.
5. What are some drivers contributing to market growth?
Increasing awareness towards fitness among consumers; Demand for convenient fortified foods.
6. What are the notable trends driving market growth?
OTHER KEY INDUSTRY TRENDS COVERED IN THE REPORT.
7. Are there any restraints impacting market growth?
Prevalence of allergen intolerance among the consumers.
8. Can you provide examples of recent developments in the market?
July 2020: DuPont Nutrition & Biosciences (DuPont), a subsidiary of IFF, offers the industry's broadest assortment of ingredients for plant-based product development with the new Danisco Planit range. Danisco Planit is a global launch that includes services, expertise, and an unparalleled ingredient portfolio for plant-based food and beverages, including plant proteins, hydrocolloids, cultures, probiotics, fibers, food protection, antioxidants, natural extracts, emulsifiers, and enzymes, as well as tailor-made systems.March 2019: DuPont launched new soy-based Protein Nuggets under the brand SUPRO. The 90% protein nugget product range was aimed to broaden the company's range of plant protein options that drive high protein content and unique textures.January 2019: Fuji Oil Holdings Inc. constructed a new plant for soy processing food on the grounds of its Chiba Plant (located in the city of Chiba, Chiba Prefecture, Japan) with an investment of JPY 2.4 billion. With the new plant having a production capacity of 9,000 ton per year and a building floor of 1,456 square meters, the company plans to develop new markets for the future.
9. What pricing options are available for accessing the report?
Pricing options include single-user, multi-user, and enterprise licenses priced at USD 3800, USD 4500, and USD 5800 respectively.
10. Is the market size provided in terms of value or volume?
The market size is provided in terms of value, measured in Million and volume, measured in K Tons.
11. Are there any specific market keywords associated with the report?
Yes, the market keyword associated with the report is "APAC Soy Protein Animal Feed Industry," which aids in identifying and referencing the specific market segment covered.
12. How do I determine which pricing option suits my needs best?
The pricing options vary based on user requirements and access needs. Individual users may opt for single-user licenses, while businesses requiring broader access may choose multi-user or enterprise licenses for cost-effective access to the report.
13. Are there any additional resources or data provided in the APAC Soy Protein Animal Feed Industry report?
While the report offers comprehensive insights, it's advisable to review the specific contents or supplementary materials provided to ascertain if additional resources or data are available.
14. How can I stay updated on further developments or reports in the APAC Soy Protein Animal Feed Industry?
To stay informed about further developments, trends, and reports in the APAC Soy Protein Animal Feed Industry, consider subscribing to industry newsletters, following relevant companies and organizations, or regularly checking reputable industry news sources and publications.
Methodology
Step 1 - Identification of Relevant Samples Size from Population Database


Step 2 - Approaches for Defining Global Market Size (Value, Volume* & Price*)

Note*: In applicable scenarios
Step 3 - Data Sources
Primary Research
- Web Analytics
- Survey Reports
- Research Institute
- Latest Research Reports
- Opinion Leaders
Secondary Research
- Annual Reports
- White Paper
- Latest Press Release
- Industry Association
- Paid Database
- Investor Presentations

Step 4 - Data Triangulation
Involves using different sources of information in order to increase the validity of a study
These sources are likely to be stakeholders in a program - participants, other researchers, program staff, other community members, and so on.
Then we put all data in single framework & apply various statistical tools to find out the dynamic on the market.
During the analysis stage, feedback from the stakeholder groups would be compared to determine areas of agreement as well as areas of divergence


