
Key Insights
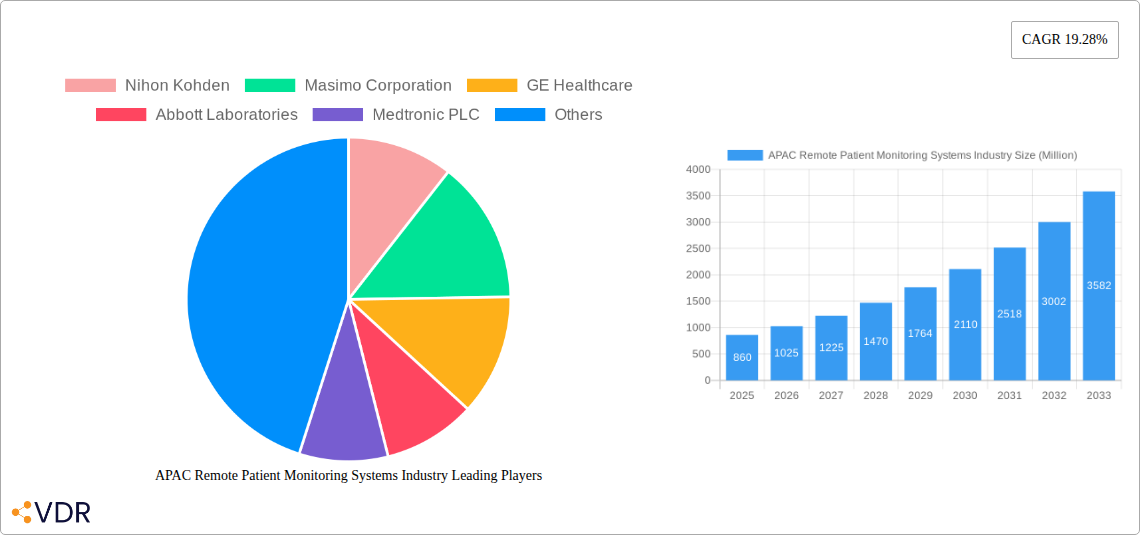
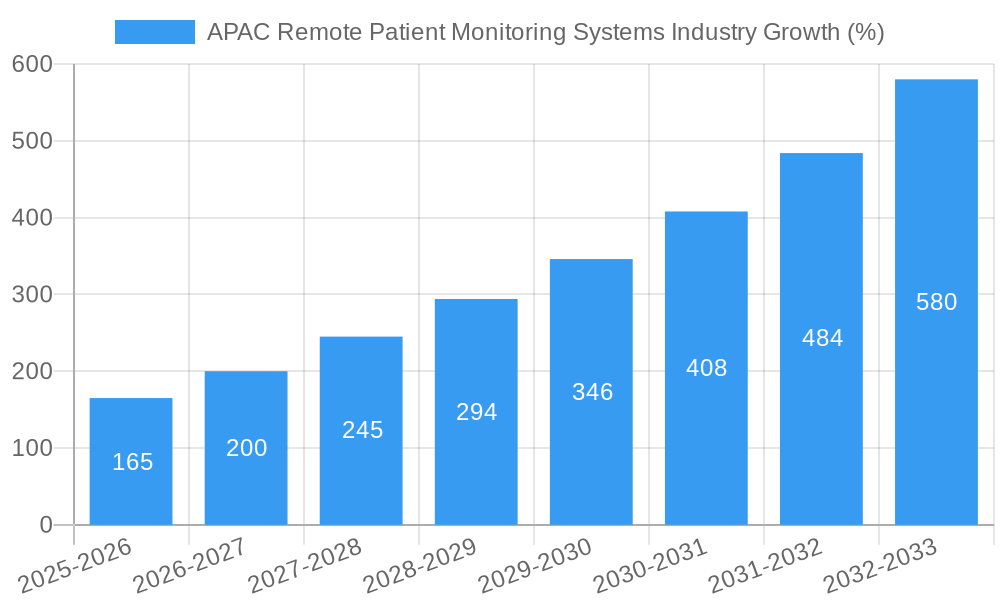
The Asia-Pacific (APAC) Remote Patient Monitoring (RPM) Systems market is experiencing robust growth, projected to reach a substantial size driven by factors such as increasing prevalence of chronic diseases (like diabetes and cardiovascular conditions), a burgeoning elderly population requiring continuous healthcare, and expanding healthcare infrastructure. The region's unique characteristics, including diverse healthcare systems and varying levels of technological adoption across different countries, present both challenges and opportunities. Government initiatives promoting telehealth and digital health are accelerating RPM adoption, particularly in countries with well-established digital infrastructures. However, factors like data privacy concerns, varying levels of internet penetration, and the need for skilled professionals to manage and interpret RPM data pose significant restraints. The market is segmented by device type (heart monitors leading the way, followed by breath monitors and multi-parameter systems), application (cardiovascular disease and diabetes management dominating), and end-users (hospitals and home healthcare settings exhibiting strong growth). The high CAGR of 19.28% indicates significant future potential, particularly as more affordable and user-friendly RPM devices become available, further enhancing accessibility and affordability. Competition amongst established players like Nihon Kohden, Masimo, and Medtronic, alongside emerging local companies, is driving innovation and creating a dynamic market landscape.
The continued growth in the APAC RPM market hinges on addressing existing challenges. Investments in digital health infrastructure, specifically reliable internet connectivity and data security measures, are paramount. Furthermore, comprehensive training programs for healthcare professionals on utilizing and interpreting RPM data will be crucial in maximizing the effectiveness of these systems. As the market matures, we can expect to see increased integration of RPM data with electronic health records (EHRs), further enhancing the efficiency and quality of patient care. The focus will shift towards personalized medicine, utilizing RPM data to tailor treatment plans and improve patient outcomes. The development of sophisticated AI-powered analytics tools will also play a crucial role in extracting meaningful insights from RPM data, leading to improved diagnosis, treatment, and disease management.
APAC Remote Patient Monitoring Systems Industry Market Report: 2019-2033
This comprehensive report provides a detailed analysis of the Asia-Pacific (APAC) Remote Patient Monitoring (RPM) Systems market, covering the period 2019-2033. It delves into market dynamics, growth trends, key players, and future opportunities, offering valuable insights for industry professionals, investors, and strategic decision-makers. The report segments the market by Type (Heart Monitors, Breath Monitors, Hematology Monitors, Multi-parameter monitors, Other Types), Application (Cancer Treatment, Cardiovascular Disease, Diabetes Treatment, Sleep Disorder, Weight Management and Fitness Monitoring, Other Applications), and End-users (Home Healthcare, Hospital/Clinics, Other End Users). The market size is presented in million units.
APAC Remote Patient Monitoring Systems Industry Market Dynamics & Structure
The APAC RPM Systems market is characterized by a moderately concentrated landscape, with several multinational corporations and regional players competing for market share. Technological innovation, driven by advancements in sensor technology, data analytics, and wireless communication, is a primary growth driver. Regulatory frameworks, varying across different APAC countries, significantly influence market adoption. Competitive substitutes, such as traditional in-person healthcare visits, pose a challenge, particularly in regions with limited healthcare infrastructure. The end-user demographic is expanding, fueled by an aging population and increasing prevalence of chronic diseases. Mergers and acquisitions (M&A) activity is moderate, with larger players seeking to expand their product portfolios and geographical reach. The market experienced xx M&A deals in 2024, representing a yy% increase from the previous year. Key factors impacting market dynamics include:
- Market Concentration: Moderately concentrated, with top 5 players holding xx% market share in 2024.
- Technological Innovation: Advancements in AI, IoT, and cloud computing are driving growth.
- Regulatory Landscape: Varying regulations across countries impact market penetration.
- Competitive Substitutes: Traditional healthcare methods still pose a significant challenge.
- End-user Demographics: Aging population and rising chronic disease prevalence fuel demand.
- M&A Activity: Moderate activity, with strategic acquisitions shaping market consolidation.
- Innovation Barriers: High initial investment costs, data security concerns, and lack of skilled professionals.
APAC Remote Patient Monitoring Systems Industry Growth Trends & Insights
The APAC RPM Systems market witnessed robust growth during the historical period (2019-2024), driven by increasing healthcare expenditure, rising prevalence of chronic diseases, and government initiatives promoting telehealth. The market size reached xx million units in 2024, exhibiting a CAGR of xx% during 2019-2024. The adoption rate is gradually increasing, with higher penetration observed in developed economies compared to developing economies within the region. Technological disruptions, such as the introduction of AI-powered diagnostic tools and wearable sensors, are transforming the market landscape, improving accuracy and efficiency. Consumer behavior is evolving, with increased acceptance of remote healthcare solutions. The forecast period (2025-2033) projects continued growth, driven by factors such as increasing affordability of RPM systems, expanding healthcare infrastructure, and greater awareness among patients. The market is expected to reach xx million units by 2033, with a projected CAGR of xx% during 2025-2033. Key trends shaping market growth include:
- Rising Healthcare Expenditure: Increased investment in healthcare infrastructure drives market expansion.
- Growing Prevalence of Chronic Diseases: Higher incidence of chronic illnesses increases demand for RPM systems.
- Government Initiatives: Government support for telehealth programs fuels market adoption.
- Technological Advancements: AI-powered diagnostics and wearable technology enhance RPM capabilities.
- Changing Consumer Behavior: Increased acceptance of remote healthcare solutions among patients.
Dominant Regions, Countries, or Segments in APAC Remote Patient Monitoring Systems Industry
Japan, Australia, and South Korea represent the dominant regions in the APAC RPM Systems market, driven by advanced healthcare infrastructure, higher adoption rates of technology, and favorable government policies. Within the segment breakdown, the Multi-parameter monitors segment holds the largest market share, followed by Heart Monitors. In terms of application, Cardiovascular Disease and Diabetes Treatment represent the largest application segments. The Hospital/Clinics end-user segment is currently the most dominant, owing to wider acceptance and integration within established healthcare facilities. However, the Home Healthcare segment exhibits significant growth potential due to increasing preference for home-based care. Key drivers for dominance include:
- Japan: High technological adoption, advanced healthcare infrastructure, and aging population.
- Australia: Strong government support for telehealth and increasing prevalence of chronic diseases.
- South Korea: Rapid technological advancements and investment in healthcare IT.
- Multi-parameter Monitors: Comprehensive monitoring capabilities and increasing preference for integrated solutions.
- Cardiovascular Disease & Diabetes Treatment: High prevalence of these conditions fuels demand for RPM systems.
- Hospital/Clinics: Established integration within existing healthcare infrastructure.
APAC Remote Patient Monitoring Systems Industry Product Landscape
The APAC RPM Systems market showcases a diverse product landscape, featuring sophisticated heart monitors, advanced breath monitors with sophisticated algorithms, hematology monitors integrated with cloud-based analysis tools, and multi-parameter monitors with improved connectivity and data security. These products are designed to meet diverse patient needs and clinical workflows, incorporating features like wireless connectivity, remote data access, and advanced analytics. Key technological advancements include miniaturization, improved sensor accuracy, and AI-powered diagnostic capabilities. Unique selling propositions include ease of use, enhanced patient comfort, and seamless integration with existing healthcare systems.
Key Drivers, Barriers & Challenges in APAC Remote Patient Monitoring Systems Industry
Key Drivers:
- Technological advancements: Miniaturization, improved sensor accuracy, and AI-powered diagnostics.
- Increasing prevalence of chronic diseases: Growing demand for remote monitoring and management of chronic conditions.
- Government support for telehealth: Incentives and regulations promoting the adoption of RPM systems.
Challenges & Restraints:
- High initial investment costs: Financial barriers limiting adoption in resource-constrained settings.
- Data security and privacy concerns: Concerns surrounding data breaches and patient confidentiality.
- Lack of skilled professionals: Shortage of trained personnel to operate and manage RPM systems.
- Interoperability issues: Challenges in integrating RPM systems with existing healthcare IT infrastructure.
Emerging Opportunities in APAC Remote Patient Monitoring Systems Industry
- Expansion into rural and underserved areas: Addressing the healthcare gap in remote locations through remote patient monitoring.
- Integration of AI and machine learning: Developing more accurate and personalized RPM solutions.
- Development of innovative applications: Exploring new applications of RPM for specific conditions and patient populations.
- Growth of wearable sensor technology: Leveraging wearables for continuous and unobtrusive patient monitoring.
Growth Accelerators in the APAC Remote Patient Monitoring Systems Industry
The long-term growth of the APAC RPM Systems market will be driven by sustained technological innovation, strategic partnerships between healthcare providers and technology companies, and expansion into new markets with unmet healthcare needs. Government initiatives promoting telehealth and remote patient monitoring will also play a significant role in driving market growth.
Key Players Shaping the APAC Remote Patient Monitoring Systems Market
- Nihon Kohden
- Masimo Corporation
- GE Healthcare
- Abbott Laboratories
- Medtronic PLC
- MidMark India
- Apollo Hospitals
- Boston Scientific Corporation
- AMD Global Telemedicine
- Baxter International Inc
- Omron Healthcare
Notable Milestones in APAC Remote Patient Monitoring Systems Industry Sector
- August 2022: Dozee and Midmark India launched intelligent connected beds for automated patient monitoring in non-ICU hospital settings.
- February 2022: Healthnet Global (Apollo Hospitals) introduced Automaid, a smart in-patient room automation system with remote patient monitoring and triaging capabilities.
In-Depth APAC Remote Patient Monitoring Systems Industry Market Outlook
The APAC RPM Systems market is poised for significant growth over the forecast period, driven by technological advancements, increasing healthcare expenditure, and government support. Strategic partnerships, expansion into underserved areas, and the development of innovative applications will create new opportunities for market players. Companies focusing on user-friendly solutions, enhanced data security, and seamless integration with existing healthcare systems will be well-positioned to capitalize on the market's growth potential. The market's future hinges on addressing challenges related to data privacy, interoperability, and cost-effectiveness, ensuring that RPM systems are accessible and beneficial to a wide range of patients.
APAC Remote Patient Monitoring Systems Industry Segmentation
-
1. Type
- 1.1. Heart Monitors
- 1.2. Breath Monitors
- 1.3. Hematology Monitors
- 1.4. Multi-parameter monitors
- 1.5. Other Types
-
2. Application
- 2.1. Cancer Treatment
- 2.2. Cardiovascular Disease
- 2.3. Diabetes Treatment
- 2.4. Sleep Disorder
- 2.5. Weight Management and Fitness Monitoring
- 2.6. Other Applications
-
3. End-users
- 3.1. Home Healthcare
- 3.2. Hospital/Clinics
- 3.3. Other End Users
-
4. Geography
- 4.1. China
- 4.2. Japan
- 4.3. India
- 4.4. Australia
- 4.5. South Korea
- 4.6. Rest of Asia-Pacific
APAC Remote Patient Monitoring Systems Industry Segmentation By Geography
- 1. China
- 2. Japan
- 3. India
- 4. Australia
- 5. South Korea
- 6. Rest of Asia Pacific
APAC Remote Patient Monitoring Systems Industry REPORT HIGHLIGHTS
| Aspects | Details |
|---|---|
| Study Period | 2019-2033 |
| Base Year | 2024 |
| Estimated Year | 2025 |
| Forecast Period | 2025-2033 |
| Historical Period | 2019-2024 |
| Growth Rate | CAGR of 19.28% from 2019-2033 |
| Segmentation |
|
Table of Contents
- 1. Introduction
- 1.1. Research Scope
- 1.2. Market Segmentation
- 1.3. Research Methodology
- 1.4. Definitions and Assumptions
- 2. Executive Summary
- 2.1. Introduction
- 3. Market Dynamics
- 3.1. Introduction
- 3.2. Market Drivers
- 3.2.1. Rising Incidences of Chronic Diseases Coupled With Increasing Geriatric Population; Increasing Demand for Home-based Monitoring Devices; Ease of Use and Portability Devices to Promote the Growth
- 3.3. Market Restrains
- 3.3.1. Resistance from Healthcare Industry Professionals; Stringent Regulatory Framework
- 3.4. Market Trends
- 3.4.1. Cancer Treatment are Expected to Witness a Significant Growth Over the Forecast Period
- 4. Market Factor Analysis
- 4.1. Porters Five Forces
- 4.2. Supply/Value Chain
- 4.3. PESTEL analysis
- 4.4. Market Entropy
- 4.5. Patent/Trademark Analysis
- 5. Global APAC Remote Patient Monitoring Systems Industry Analysis, Insights and Forecast, 2019-2031
- 5.1. Market Analysis, Insights and Forecast - by Type
- 5.1.1. Heart Monitors
- 5.1.2. Breath Monitors
- 5.1.3. Hematology Monitors
- 5.1.4. Multi-parameter monitors
- 5.1.5. Other Types
- 5.2. Market Analysis, Insights and Forecast - by Application
- 5.2.1. Cancer Treatment
- 5.2.2. Cardiovascular Disease
- 5.2.3. Diabetes Treatment
- 5.2.4. Sleep Disorder
- 5.2.5. Weight Management and Fitness Monitoring
- 5.2.6. Other Applications
- 5.3. Market Analysis, Insights and Forecast - by End-users
- 5.3.1. Home Healthcare
- 5.3.2. Hospital/Clinics
- 5.3.3. Other End Users
- 5.4. Market Analysis, Insights and Forecast - by Geography
- 5.4.1. China
- 5.4.2. Japan
- 5.4.3. India
- 5.4.4. Australia
- 5.4.5. South Korea
- 5.4.6. Rest of Asia-Pacific
- 5.5. Market Analysis, Insights and Forecast - by Region
- 5.5.1. China
- 5.5.2. Japan
- 5.5.3. India
- 5.5.4. Australia
- 5.5.5. South Korea
- 5.5.6. Rest of Asia Pacific
- 5.1. Market Analysis, Insights and Forecast - by Type
- 6. China APAC Remote Patient Monitoring Systems Industry Analysis, Insights and Forecast, 2019-2031
- 6.1. Market Analysis, Insights and Forecast - by Type
- 6.1.1. Heart Monitors
- 6.1.2. Breath Monitors
- 6.1.3. Hematology Monitors
- 6.1.4. Multi-parameter monitors
- 6.1.5. Other Types
- 6.2. Market Analysis, Insights and Forecast - by Application
- 6.2.1. Cancer Treatment
- 6.2.2. Cardiovascular Disease
- 6.2.3. Diabetes Treatment
- 6.2.4. Sleep Disorder
- 6.2.5. Weight Management and Fitness Monitoring
- 6.2.6. Other Applications
- 6.3. Market Analysis, Insights and Forecast - by End-users
- 6.3.1. Home Healthcare
- 6.3.2. Hospital/Clinics
- 6.3.3. Other End Users
- 6.4. Market Analysis, Insights and Forecast - by Geography
- 6.4.1. China
- 6.4.2. Japan
- 6.4.3. India
- 6.4.4. Australia
- 6.4.5. South Korea
- 6.4.6. Rest of Asia-Pacific
- 6.1. Market Analysis, Insights and Forecast - by Type
- 7. Japan APAC Remote Patient Monitoring Systems Industry Analysis, Insights and Forecast, 2019-2031
- 7.1. Market Analysis, Insights and Forecast - by Type
- 7.1.1. Heart Monitors
- 7.1.2. Breath Monitors
- 7.1.3. Hematology Monitors
- 7.1.4. Multi-parameter monitors
- 7.1.5. Other Types
- 7.2. Market Analysis, Insights and Forecast - by Application
- 7.2.1. Cancer Treatment
- 7.2.2. Cardiovascular Disease
- 7.2.3. Diabetes Treatment
- 7.2.4. Sleep Disorder
- 7.2.5. Weight Management and Fitness Monitoring
- 7.2.6. Other Applications
- 7.3. Market Analysis, Insights and Forecast - by End-users
- 7.3.1. Home Healthcare
- 7.3.2. Hospital/Clinics
- 7.3.3. Other End Users
- 7.4. Market Analysis, Insights and Forecast - by Geography
- 7.4.1. China
- 7.4.2. Japan
- 7.4.3. India
- 7.4.4. Australia
- 7.4.5. South Korea
- 7.4.6. Rest of Asia-Pacific
- 7.1. Market Analysis, Insights and Forecast - by Type
- 8. India APAC Remote Patient Monitoring Systems Industry Analysis, Insights and Forecast, 2019-2031
- 8.1. Market Analysis, Insights and Forecast - by Type
- 8.1.1. Heart Monitors
- 8.1.2. Breath Monitors
- 8.1.3. Hematology Monitors
- 8.1.4. Multi-parameter monitors
- 8.1.5. Other Types
- 8.2. Market Analysis, Insights and Forecast - by Application
- 8.2.1. Cancer Treatment
- 8.2.2. Cardiovascular Disease
- 8.2.3. Diabetes Treatment
- 8.2.4. Sleep Disorder
- 8.2.5. Weight Management and Fitness Monitoring
- 8.2.6. Other Applications
- 8.3. Market Analysis, Insights and Forecast - by End-users
- 8.3.1. Home Healthcare
- 8.3.2. Hospital/Clinics
- 8.3.3. Other End Users
- 8.4. Market Analysis, Insights and Forecast - by Geography
- 8.4.1. China
- 8.4.2. Japan
- 8.4.3. India
- 8.4.4. Australia
- 8.4.5. South Korea
- 8.4.6. Rest of Asia-Pacific
- 8.1. Market Analysis, Insights and Forecast - by Type
- 9. Australia APAC Remote Patient Monitoring Systems Industry Analysis, Insights and Forecast, 2019-2031
- 9.1. Market Analysis, Insights and Forecast - by Type
- 9.1.1. Heart Monitors
- 9.1.2. Breath Monitors
- 9.1.3. Hematology Monitors
- 9.1.4. Multi-parameter monitors
- 9.1.5. Other Types
- 9.2. Market Analysis, Insights and Forecast - by Application
- 9.2.1. Cancer Treatment
- 9.2.2. Cardiovascular Disease
- 9.2.3. Diabetes Treatment
- 9.2.4. Sleep Disorder
- 9.2.5. Weight Management and Fitness Monitoring
- 9.2.6. Other Applications
- 9.3. Market Analysis, Insights and Forecast - by End-users
- 9.3.1. Home Healthcare
- 9.3.2. Hospital/Clinics
- 9.3.3. Other End Users
- 9.4. Market Analysis, Insights and Forecast - by Geography
- 9.4.1. China
- 9.4.2. Japan
- 9.4.3. India
- 9.4.4. Australia
- 9.4.5. South Korea
- 9.4.6. Rest of Asia-Pacific
- 9.1. Market Analysis, Insights and Forecast - by Type
- 10. South Korea APAC Remote Patient Monitoring Systems Industry Analysis, Insights and Forecast, 2019-2031
- 10.1. Market Analysis, Insights and Forecast - by Type
- 10.1.1. Heart Monitors
- 10.1.2. Breath Monitors
- 10.1.3. Hematology Monitors
- 10.1.4. Multi-parameter monitors
- 10.1.5. Other Types
- 10.2. Market Analysis, Insights and Forecast - by Application
- 10.2.1. Cancer Treatment
- 10.2.2. Cardiovascular Disease
- 10.2.3. Diabetes Treatment
- 10.2.4. Sleep Disorder
- 10.2.5. Weight Management and Fitness Monitoring
- 10.2.6. Other Applications
- 10.3. Market Analysis, Insights and Forecast - by End-users
- 10.3.1. Home Healthcare
- 10.3.2. Hospital/Clinics
- 10.3.3. Other End Users
- 10.4. Market Analysis, Insights and Forecast - by Geography
- 10.4.1. China
- 10.4.2. Japan
- 10.4.3. India
- 10.4.4. Australia
- 10.4.5. South Korea
- 10.4.6. Rest of Asia-Pacific
- 10.1. Market Analysis, Insights and Forecast - by Type
- 11. Rest of Asia Pacific APAC Remote Patient Monitoring Systems Industry Analysis, Insights and Forecast, 2019-2031
- 11.1. Market Analysis, Insights and Forecast - by Type
- 11.1.1. Heart Monitors
- 11.1.2. Breath Monitors
- 11.1.3. Hematology Monitors
- 11.1.4. Multi-parameter monitors
- 11.1.5. Other Types
- 11.2. Market Analysis, Insights and Forecast - by Application
- 11.2.1. Cancer Treatment
- 11.2.2. Cardiovascular Disease
- 11.2.3. Diabetes Treatment
- 11.2.4. Sleep Disorder
- 11.2.5. Weight Management and Fitness Monitoring
- 11.2.6. Other Applications
- 11.3. Market Analysis, Insights and Forecast - by End-users
- 11.3.1. Home Healthcare
- 11.3.2. Hospital/Clinics
- 11.3.3. Other End Users
- 11.4. Market Analysis, Insights and Forecast - by Geography
- 11.4.1. China
- 11.4.2. Japan
- 11.4.3. India
- 11.4.4. Australia
- 11.4.5. South Korea
- 11.4.6. Rest of Asia-Pacific
- 11.1. Market Analysis, Insights and Forecast - by Type
- 12. North America APAC Remote Patient Monitoring Systems Industry Analysis, Insights and Forecast, 2019-2031
- 12.1. Market Analysis, Insights and Forecast - By Country/Sub-region
- 12.1.1. undefined
- 13. South America APAC Remote Patient Monitoring Systems Industry Analysis, Insights and Forecast, 2019-2031
- 13.1. Market Analysis, Insights and Forecast - By Country/Sub-region
- 13.1.1. undefined
- 14. Europe APAC Remote Patient Monitoring Systems Industry Analysis, Insights and Forecast, 2019-2031
- 14.1. Market Analysis, Insights and Forecast - By Country/Sub-region
- 14.1.1. undefined
- 15. Asia Pacific APAC Remote Patient Monitoring Systems Industry Analysis, Insights and Forecast, 2019-2031
- 15.1. Market Analysis, Insights and Forecast - By Country/Sub-region
- 15.1.1. undefined
- 16. MEA APAC Remote Patient Monitoring Systems Industry Analysis, Insights and Forecast, 2019-2031
- 16.1. Market Analysis, Insights and Forecast - By Country/Sub-region
- 16.1.1. undefined
- 17. Competitive Analysis
- 17.1. Global Market Share Analysis 2024
- 17.2. Company Profiles
- 17.2.1 Nihon Kohden
- 17.2.1.1. Overview
- 17.2.1.2. Products
- 17.2.1.3. SWOT Analysis
- 17.2.1.4. Recent Developments
- 17.2.1.5. Financials (Based on Availability)
- 17.2.2 Masimo Corporation
- 17.2.2.1. Overview
- 17.2.2.2. Products
- 17.2.2.3. SWOT Analysis
- 17.2.2.4. Recent Developments
- 17.2.2.5. Financials (Based on Availability)
- 17.2.3 GE Healthcare
- 17.2.3.1. Overview
- 17.2.3.2. Products
- 17.2.3.3. SWOT Analysis
- 17.2.3.4. Recent Developments
- 17.2.3.5. Financials (Based on Availability)
- 17.2.4 Abbott Laboratories
- 17.2.4.1. Overview
- 17.2.4.2. Products
- 17.2.4.3. SWOT Analysis
- 17.2.4.4. Recent Developments
- 17.2.4.5. Financials (Based on Availability)
- 17.2.5 Medtronic PLC
- 17.2.5.1. Overview
- 17.2.5.2. Products
- 17.2.5.3. SWOT Analysis
- 17.2.5.4. Recent Developments
- 17.2.5.5. Financials (Based on Availability)
- 17.2.6 MidMark India
- 17.2.6.1. Overview
- 17.2.6.2. Products
- 17.2.6.3. SWOT Analysis
- 17.2.6.4. Recent Developments
- 17.2.6.5. Financials (Based on Availability)
- 17.2.7 Apollo Hospitals
- 17.2.7.1. Overview
- 17.2.7.2. Products
- 17.2.7.3. SWOT Analysis
- 17.2.7.4. Recent Developments
- 17.2.7.5. Financials (Based on Availability)
- 17.2.8 Boston Scientific Corporation
- 17.2.8.1. Overview
- 17.2.8.2. Products
- 17.2.8.3. SWOT Analysis
- 17.2.8.4. Recent Developments
- 17.2.8.5. Financials (Based on Availability)
- 17.2.9 AMD Global Telemedicine
- 17.2.9.1. Overview
- 17.2.9.2. Products
- 17.2.9.3. SWOT Analysis
- 17.2.9.4. Recent Developments
- 17.2.9.5. Financials (Based on Availability)
- 17.2.10 Baxter International Inc
- 17.2.10.1. Overview
- 17.2.10.2. Products
- 17.2.10.3. SWOT Analysis
- 17.2.10.4. Recent Developments
- 17.2.10.5. Financials (Based on Availability)
- 17.2.11 Omron Healthcare
- 17.2.11.1. Overview
- 17.2.11.2. Products
- 17.2.11.3. SWOT Analysis
- 17.2.11.4. Recent Developments
- 17.2.11.5. Financials (Based on Availability)
- 17.2.1 Nihon Kohden
List of Figures
- Figure 1: Global APAC Remote Patient Monitoring Systems Industry Revenue Breakdown (Million, %) by Region 2024 & 2032
- Figure 2: Global APAC Remote Patient Monitoring Systems Industry Volume Breakdown (K Unit, %) by Region 2024 & 2032
- Figure 3: North America APAC Remote Patient Monitoring Systems Industry Revenue (Million), by Country 2024 & 2032
- Figure 4: North America APAC Remote Patient Monitoring Systems Industry Volume (K Unit), by Country 2024 & 2032
- Figure 5: North America APAC Remote Patient Monitoring Systems Industry Revenue Share (%), by Country 2024 & 2032
- Figure 6: North America APAC Remote Patient Monitoring Systems Industry Volume Share (%), by Country 2024 & 2032
- Figure 7: South America APAC Remote Patient Monitoring Systems Industry Revenue (Million), by Country 2024 & 2032
- Figure 8: South America APAC Remote Patient Monitoring Systems Industry Volume (K Unit), by Country 2024 & 2032
- Figure 9: South America APAC Remote Patient Monitoring Systems Industry Revenue Share (%), by Country 2024 & 2032
- Figure 10: South America APAC Remote Patient Monitoring Systems Industry Volume Share (%), by Country 2024 & 2032
- Figure 11: Europe APAC Remote Patient Monitoring Systems Industry Revenue (Million), by Country 2024 & 2032
- Figure 12: Europe APAC Remote Patient Monitoring Systems Industry Volume (K Unit), by Country 2024 & 2032
- Figure 13: Europe APAC Remote Patient Monitoring Systems Industry Revenue Share (%), by Country 2024 & 2032
- Figure 14: Europe APAC Remote Patient Monitoring Systems Industry Volume Share (%), by Country 2024 & 2032
- Figure 15: Asia Pacific APAC Remote Patient Monitoring Systems Industry Revenue (Million), by Country 2024 & 2032
- Figure 16: Asia Pacific APAC Remote Patient Monitoring Systems Industry Volume (K Unit), by Country 2024 & 2032
- Figure 17: Asia Pacific APAC Remote Patient Monitoring Systems Industry Revenue Share (%), by Country 2024 & 2032
- Figure 18: Asia Pacific APAC Remote Patient Monitoring Systems Industry Volume Share (%), by Country 2024 & 2032
- Figure 19: MEA APAC Remote Patient Monitoring Systems Industry Revenue (Million), by Country 2024 & 2032
- Figure 20: MEA APAC Remote Patient Monitoring Systems Industry Volume (K Unit), by Country 2024 & 2032
- Figure 21: MEA APAC Remote Patient Monitoring Systems Industry Revenue Share (%), by Country 2024 & 2032
- Figure 22: MEA APAC Remote Patient Monitoring Systems Industry Volume Share (%), by Country 2024 & 2032
- Figure 23: China APAC Remote Patient Monitoring Systems Industry Revenue (Million), by Type 2024 & 2032
- Figure 24: China APAC Remote Patient Monitoring Systems Industry Volume (K Unit), by Type 2024 & 2032
- Figure 25: China APAC Remote Patient Monitoring Systems Industry Revenue Share (%), by Type 2024 & 2032
- Figure 26: China APAC Remote Patient Monitoring Systems Industry Volume Share (%), by Type 2024 & 2032
- Figure 27: China APAC Remote Patient Monitoring Systems Industry Revenue (Million), by Application 2024 & 2032
- Figure 28: China APAC Remote Patient Monitoring Systems Industry Volume (K Unit), by Application 2024 & 2032
- Figure 29: China APAC Remote Patient Monitoring Systems Industry Revenue Share (%), by Application 2024 & 2032
- Figure 30: China APAC Remote Patient Monitoring Systems Industry Volume Share (%), by Application 2024 & 2032
- Figure 31: China APAC Remote Patient Monitoring Systems Industry Revenue (Million), by End-users 2024 & 2032
- Figure 32: China APAC Remote Patient Monitoring Systems Industry Volume (K Unit), by End-users 2024 & 2032
- Figure 33: China APAC Remote Patient Monitoring Systems Industry Revenue Share (%), by End-users 2024 & 2032
- Figure 34: China APAC Remote Patient Monitoring Systems Industry Volume Share (%), by End-users 2024 & 2032
- Figure 35: China APAC Remote Patient Monitoring Systems Industry Revenue (Million), by Geography 2024 & 2032
- Figure 36: China APAC Remote Patient Monitoring Systems Industry Volume (K Unit), by Geography 2024 & 2032
- Figure 37: China APAC Remote Patient Monitoring Systems Industry Revenue Share (%), by Geography 2024 & 2032
- Figure 38: China APAC Remote Patient Monitoring Systems Industry Volume Share (%), by Geography 2024 & 2032
- Figure 39: China APAC Remote Patient Monitoring Systems Industry Revenue (Million), by Country 2024 & 2032
- Figure 40: China APAC Remote Patient Monitoring Systems Industry Volume (K Unit), by Country 2024 & 2032
- Figure 41: China APAC Remote Patient Monitoring Systems Industry Revenue Share (%), by Country 2024 & 2032
- Figure 42: China APAC Remote Patient Monitoring Systems Industry Volume Share (%), by Country 2024 & 2032
- Figure 43: Japan APAC Remote Patient Monitoring Systems Industry Revenue (Million), by Type 2024 & 2032
- Figure 44: Japan APAC Remote Patient Monitoring Systems Industry Volume (K Unit), by Type 2024 & 2032
- Figure 45: Japan APAC Remote Patient Monitoring Systems Industry Revenue Share (%), by Type 2024 & 2032
- Figure 46: Japan APAC Remote Patient Monitoring Systems Industry Volume Share (%), by Type 2024 & 2032
- Figure 47: Japan APAC Remote Patient Monitoring Systems Industry Revenue (Million), by Application 2024 & 2032
- Figure 48: Japan APAC Remote Patient Monitoring Systems Industry Volume (K Unit), by Application 2024 & 2032
- Figure 49: Japan APAC Remote Patient Monitoring Systems Industry Revenue Share (%), by Application 2024 & 2032
- Figure 50: Japan APAC Remote Patient Monitoring Systems Industry Volume Share (%), by Application 2024 & 2032
- Figure 51: Japan APAC Remote Patient Monitoring Systems Industry Revenue (Million), by End-users 2024 & 2032
- Figure 52: Japan APAC Remote Patient Monitoring Systems Industry Volume (K Unit), by End-users 2024 & 2032
- Figure 53: Japan APAC Remote Patient Monitoring Systems Industry Revenue Share (%), by End-users 2024 & 2032
- Figure 54: Japan APAC Remote Patient Monitoring Systems Industry Volume Share (%), by End-users 2024 & 2032
- Figure 55: Japan APAC Remote Patient Monitoring Systems Industry Revenue (Million), by Geography 2024 & 2032
- Figure 56: Japan APAC Remote Patient Monitoring Systems Industry Volume (K Unit), by Geography 2024 & 2032
- Figure 57: Japan APAC Remote Patient Monitoring Systems Industry Revenue Share (%), by Geography 2024 & 2032
- Figure 58: Japan APAC Remote Patient Monitoring Systems Industry Volume Share (%), by Geography 2024 & 2032
- Figure 59: Japan APAC Remote Patient Monitoring Systems Industry Revenue (Million), by Country 2024 & 2032
- Figure 60: Japan APAC Remote Patient Monitoring Systems Industry Volume (K Unit), by Country 2024 & 2032
- Figure 61: Japan APAC Remote Patient Monitoring Systems Industry Revenue Share (%), by Country 2024 & 2032
- Figure 62: Japan APAC Remote Patient Monitoring Systems Industry Volume Share (%), by Country 2024 & 2032
- Figure 63: India APAC Remote Patient Monitoring Systems Industry Revenue (Million), by Type 2024 & 2032
- Figure 64: India APAC Remote Patient Monitoring Systems Industry Volume (K Unit), by Type 2024 & 2032
- Figure 65: India APAC Remote Patient Monitoring Systems Industry Revenue Share (%), by Type 2024 & 2032
- Figure 66: India APAC Remote Patient Monitoring Systems Industry Volume Share (%), by Type 2024 & 2032
- Figure 67: India APAC Remote Patient Monitoring Systems Industry Revenue (Million), by Application 2024 & 2032
- Figure 68: India APAC Remote Patient Monitoring Systems Industry Volume (K Unit), by Application 2024 & 2032
- Figure 69: India APAC Remote Patient Monitoring Systems Industry Revenue Share (%), by Application 2024 & 2032
- Figure 70: India APAC Remote Patient Monitoring Systems Industry Volume Share (%), by Application 2024 & 2032
- Figure 71: India APAC Remote Patient Monitoring Systems Industry Revenue (Million), by End-users 2024 & 2032
- Figure 72: India APAC Remote Patient Monitoring Systems Industry Volume (K Unit), by End-users 2024 & 2032
- Figure 73: India APAC Remote Patient Monitoring Systems Industry Revenue Share (%), by End-users 2024 & 2032
- Figure 74: India APAC Remote Patient Monitoring Systems Industry Volume Share (%), by End-users 2024 & 2032
- Figure 75: India APAC Remote Patient Monitoring Systems Industry Revenue (Million), by Geography 2024 & 2032
- Figure 76: India APAC Remote Patient Monitoring Systems Industry Volume (K Unit), by Geography 2024 & 2032
- Figure 77: India APAC Remote Patient Monitoring Systems Industry Revenue Share (%), by Geography 2024 & 2032
- Figure 78: India APAC Remote Patient Monitoring Systems Industry Volume Share (%), by Geography 2024 & 2032
- Figure 79: India APAC Remote Patient Monitoring Systems Industry Revenue (Million), by Country 2024 & 2032
- Figure 80: India APAC Remote Patient Monitoring Systems Industry Volume (K Unit), by Country 2024 & 2032
- Figure 81: India APAC Remote Patient Monitoring Systems Industry Revenue Share (%), by Country 2024 & 2032
- Figure 82: India APAC Remote Patient Monitoring Systems Industry Volume Share (%), by Country 2024 & 2032
- Figure 83: Australia APAC Remote Patient Monitoring Systems Industry Revenue (Million), by Type 2024 & 2032
- Figure 84: Australia APAC Remote Patient Monitoring Systems Industry Volume (K Unit), by Type 2024 & 2032
- Figure 85: Australia APAC Remote Patient Monitoring Systems Industry Revenue Share (%), by Type 2024 & 2032
- Figure 86: Australia APAC Remote Patient Monitoring Systems Industry Volume Share (%), by Type 2024 & 2032
- Figure 87: Australia APAC Remote Patient Monitoring Systems Industry Revenue (Million), by Application 2024 & 2032
- Figure 88: Australia APAC Remote Patient Monitoring Systems Industry Volume (K Unit), by Application 2024 & 2032
- Figure 89: Australia APAC Remote Patient Monitoring Systems Industry Revenue Share (%), by Application 2024 & 2032
- Figure 90: Australia APAC Remote Patient Monitoring Systems Industry Volume Share (%), by Application 2024 & 2032
- Figure 91: Australia APAC Remote Patient Monitoring Systems Industry Revenue (Million), by End-users 2024 & 2032
- Figure 92: Australia APAC Remote Patient Monitoring Systems Industry Volume (K Unit), by End-users 2024 & 2032
- Figure 93: Australia APAC Remote Patient Monitoring Systems Industry Revenue Share (%), by End-users 2024 & 2032
- Figure 94: Australia APAC Remote Patient Monitoring Systems Industry Volume Share (%), by End-users 2024 & 2032
- Figure 95: Australia APAC Remote Patient Monitoring Systems Industry Revenue (Million), by Geography 2024 & 2032
- Figure 96: Australia APAC Remote Patient Monitoring Systems Industry Volume (K Unit), by Geography 2024 & 2032
- Figure 97: Australia APAC Remote Patient Monitoring Systems Industry Revenue Share (%), by Geography 2024 & 2032
- Figure 98: Australia APAC Remote Patient Monitoring Systems Industry Volume Share (%), by Geography 2024 & 2032
- Figure 99: Australia APAC Remote Patient Monitoring Systems Industry Revenue (Million), by Country 2024 & 2032
- Figure 100: Australia APAC Remote Patient Monitoring Systems Industry Volume (K Unit), by Country 2024 & 2032
- Figure 101: Australia APAC Remote Patient Monitoring Systems Industry Revenue Share (%), by Country 2024 & 2032
- Figure 102: Australia APAC Remote Patient Monitoring Systems Industry Volume Share (%), by Country 2024 & 2032
- Figure 103: South Korea APAC Remote Patient Monitoring Systems Industry Revenue (Million), by Type 2024 & 2032
- Figure 104: South Korea APAC Remote Patient Monitoring Systems Industry Volume (K Unit), by Type 2024 & 2032
- Figure 105: South Korea APAC Remote Patient Monitoring Systems Industry Revenue Share (%), by Type 2024 & 2032
- Figure 106: South Korea APAC Remote Patient Monitoring Systems Industry Volume Share (%), by Type 2024 & 2032
- Figure 107: South Korea APAC Remote Patient Monitoring Systems Industry Revenue (Million), by Application 2024 & 2032
- Figure 108: South Korea APAC Remote Patient Monitoring Systems Industry Volume (K Unit), by Application 2024 & 2032
- Figure 109: South Korea APAC Remote Patient Monitoring Systems Industry Revenue Share (%), by Application 2024 & 2032
- Figure 110: South Korea APAC Remote Patient Monitoring Systems Industry Volume Share (%), by Application 2024 & 2032
- Figure 111: South Korea APAC Remote Patient Monitoring Systems Industry Revenue (Million), by End-users 2024 & 2032
- Figure 112: South Korea APAC Remote Patient Monitoring Systems Industry Volume (K Unit), by End-users 2024 & 2032
- Figure 113: South Korea APAC Remote Patient Monitoring Systems Industry Revenue Share (%), by End-users 2024 & 2032
- Figure 114: South Korea APAC Remote Patient Monitoring Systems Industry Volume Share (%), by End-users 2024 & 2032
- Figure 115: South Korea APAC Remote Patient Monitoring Systems Industry Revenue (Million), by Geography 2024 & 2032
- Figure 116: South Korea APAC Remote Patient Monitoring Systems Industry Volume (K Unit), by Geography 2024 & 2032
- Figure 117: South Korea APAC Remote Patient Monitoring Systems Industry Revenue Share (%), by Geography 2024 & 2032
- Figure 118: South Korea APAC Remote Patient Monitoring Systems Industry Volume Share (%), by Geography 2024 & 2032
- Figure 119: South Korea APAC Remote Patient Monitoring Systems Industry Revenue (Million), by Country 2024 & 2032
- Figure 120: South Korea APAC Remote Patient Monitoring Systems Industry Volume (K Unit), by Country 2024 & 2032
- Figure 121: South Korea APAC Remote Patient Monitoring Systems Industry Revenue Share (%), by Country 2024 & 2032
- Figure 122: South Korea APAC Remote Patient Monitoring Systems Industry Volume Share (%), by Country 2024 & 2032
- Figure 123: Rest of Asia Pacific APAC Remote Patient Monitoring Systems Industry Revenue (Million), by Type 2024 & 2032
- Figure 124: Rest of Asia Pacific APAC Remote Patient Monitoring Systems Industry Volume (K Unit), by Type 2024 & 2032
- Figure 125: Rest of Asia Pacific APAC Remote Patient Monitoring Systems Industry Revenue Share (%), by Type 2024 & 2032
- Figure 126: Rest of Asia Pacific APAC Remote Patient Monitoring Systems Industry Volume Share (%), by Type 2024 & 2032
- Figure 127: Rest of Asia Pacific APAC Remote Patient Monitoring Systems Industry Revenue (Million), by Application 2024 & 2032
- Figure 128: Rest of Asia Pacific APAC Remote Patient Monitoring Systems Industry Volume (K Unit), by Application 2024 & 2032
- Figure 129: Rest of Asia Pacific APAC Remote Patient Monitoring Systems Industry Revenue Share (%), by Application 2024 & 2032
- Figure 130: Rest of Asia Pacific APAC Remote Patient Monitoring Systems Industry Volume Share (%), by Application 2024 & 2032
- Figure 131: Rest of Asia Pacific APAC Remote Patient Monitoring Systems Industry Revenue (Million), by End-users 2024 & 2032
- Figure 132: Rest of Asia Pacific APAC Remote Patient Monitoring Systems Industry Volume (K Unit), by End-users 2024 & 2032
- Figure 133: Rest of Asia Pacific APAC Remote Patient Monitoring Systems Industry Revenue Share (%), by End-users 2024 & 2032
- Figure 134: Rest of Asia Pacific APAC Remote Patient Monitoring Systems Industry Volume Share (%), by End-users 2024 & 2032
- Figure 135: Rest of Asia Pacific APAC Remote Patient Monitoring Systems Industry Revenue (Million), by Geography 2024 & 2032
- Figure 136: Rest of Asia Pacific APAC Remote Patient Monitoring Systems Industry Volume (K Unit), by Geography 2024 & 2032
- Figure 137: Rest of Asia Pacific APAC Remote Patient Monitoring Systems Industry Revenue Share (%), by Geography 2024 & 2032
- Figure 138: Rest of Asia Pacific APAC Remote Patient Monitoring Systems Industry Volume Share (%), by Geography 2024 & 2032
- Figure 139: Rest of Asia Pacific APAC Remote Patient Monitoring Systems Industry Revenue (Million), by Country 2024 & 2032
- Figure 140: Rest of Asia Pacific APAC Remote Patient Monitoring Systems Industry Volume (K Unit), by Country 2024 & 2032
- Figure 141: Rest of Asia Pacific APAC Remote Patient Monitoring Systems Industry Revenue Share (%), by Country 2024 & 2032
- Figure 142: Rest of Asia Pacific APAC Remote Patient Monitoring Systems Industry Volume Share (%), by Country 2024 & 2032
List of Tables
- Table 1: Global APAC Remote Patient Monitoring Systems Industry Revenue Million Forecast, by Region 2019 & 2032
- Table 2: Global APAC Remote Patient Monitoring Systems Industry Volume K Unit Forecast, by Region 2019 & 2032
- Table 3: Global APAC Remote Patient Monitoring Systems Industry Revenue Million Forecast, by Type 2019 & 2032
- Table 4: Global APAC Remote Patient Monitoring Systems Industry Volume K Unit Forecast, by Type 2019 & 2032
- Table 5: Global APAC Remote Patient Monitoring Systems Industry Revenue Million Forecast, by Application 2019 & 2032
- Table 6: Global APAC Remote Patient Monitoring Systems Industry Volume K Unit Forecast, by Application 2019 & 2032
- Table 7: Global APAC Remote Patient Monitoring Systems Industry Revenue Million Forecast, by End-users 2019 & 2032
- Table 8: Global APAC Remote Patient Monitoring Systems Industry Volume K Unit Forecast, by End-users 2019 & 2032
- Table 9: Global APAC Remote Patient Monitoring Systems Industry Revenue Million Forecast, by Geography 2019 & 2032
- Table 10: Global APAC Remote Patient Monitoring Systems Industry Volume K Unit Forecast, by Geography 2019 & 2032
- Table 11: Global APAC Remote Patient Monitoring Systems Industry Revenue Million Forecast, by Region 2019 & 2032
- Table 12: Global APAC Remote Patient Monitoring Systems Industry Volume K Unit Forecast, by Region 2019 & 2032
- Table 13: Global APAC Remote Patient Monitoring Systems Industry Revenue Million Forecast, by Country 2019 & 2032
- Table 14: Global APAC Remote Patient Monitoring Systems Industry Volume K Unit Forecast, by Country 2019 & 2032
- Table 15: Global APAC Remote Patient Monitoring Systems Industry Revenue Million Forecast, by Country 2019 & 2032
- Table 16: Global APAC Remote Patient Monitoring Systems Industry Volume K Unit Forecast, by Country 2019 & 2032
- Table 17: Global APAC Remote Patient Monitoring Systems Industry Revenue Million Forecast, by Country 2019 & 2032
- Table 18: Global APAC Remote Patient Monitoring Systems Industry Volume K Unit Forecast, by Country 2019 & 2032
- Table 19: Global APAC Remote Patient Monitoring Systems Industry Revenue Million Forecast, by Country 2019 & 2032
- Table 20: Global APAC Remote Patient Monitoring Systems Industry Volume K Unit Forecast, by Country 2019 & 2032
- Table 21: Global APAC Remote Patient Monitoring Systems Industry Revenue Million Forecast, by Country 2019 & 2032
- Table 22: Global APAC Remote Patient Monitoring Systems Industry Volume K Unit Forecast, by Country 2019 & 2032
- Table 23: Global APAC Remote Patient Monitoring Systems Industry Revenue Million Forecast, by Type 2019 & 2032
- Table 24: Global APAC Remote Patient Monitoring Systems Industry Volume K Unit Forecast, by Type 2019 & 2032
- Table 25: Global APAC Remote Patient Monitoring Systems Industry Revenue Million Forecast, by Application 2019 & 2032
- Table 26: Global APAC Remote Patient Monitoring Systems Industry Volume K Unit Forecast, by Application 2019 & 2032
- Table 27: Global APAC Remote Patient Monitoring Systems Industry Revenue Million Forecast, by End-users 2019 & 2032
- Table 28: Global APAC Remote Patient Monitoring Systems Industry Volume K Unit Forecast, by End-users 2019 & 2032
- Table 29: Global APAC Remote Patient Monitoring Systems Industry Revenue Million Forecast, by Geography 2019 & 2032
- Table 30: Global APAC Remote Patient Monitoring Systems Industry Volume K Unit Forecast, by Geography 2019 & 2032
- Table 31: Global APAC Remote Patient Monitoring Systems Industry Revenue Million Forecast, by Country 2019 & 2032
- Table 32: Global APAC Remote Patient Monitoring Systems Industry Volume K Unit Forecast, by Country 2019 & 2032
- Table 33: Global APAC Remote Patient Monitoring Systems Industry Revenue Million Forecast, by Type 2019 & 2032
- Table 34: Global APAC Remote Patient Monitoring Systems Industry Volume K Unit Forecast, by Type 2019 & 2032
- Table 35: Global APAC Remote Patient Monitoring Systems Industry Revenue Million Forecast, by Application 2019 & 2032
- Table 36: Global APAC Remote Patient Monitoring Systems Industry Volume K Unit Forecast, by Application 2019 & 2032
- Table 37: Global APAC Remote Patient Monitoring Systems Industry Revenue Million Forecast, by End-users 2019 & 2032
- Table 38: Global APAC Remote Patient Monitoring Systems Industry Volume K Unit Forecast, by End-users 2019 & 2032
- Table 39: Global APAC Remote Patient Monitoring Systems Industry Revenue Million Forecast, by Geography 2019 & 2032
- Table 40: Global APAC Remote Patient Monitoring Systems Industry Volume K Unit Forecast, by Geography 2019 & 2032
- Table 41: Global APAC Remote Patient Monitoring Systems Industry Revenue Million Forecast, by Country 2019 & 2032
- Table 42: Global APAC Remote Patient Monitoring Systems Industry Volume K Unit Forecast, by Country 2019 & 2032
- Table 43: Global APAC Remote Patient Monitoring Systems Industry Revenue Million Forecast, by Type 2019 & 2032
- Table 44: Global APAC Remote Patient Monitoring Systems Industry Volume K Unit Forecast, by Type 2019 & 2032
- Table 45: Global APAC Remote Patient Monitoring Systems Industry Revenue Million Forecast, by Application 2019 & 2032
- Table 46: Global APAC Remote Patient Monitoring Systems Industry Volume K Unit Forecast, by Application 2019 & 2032
- Table 47: Global APAC Remote Patient Monitoring Systems Industry Revenue Million Forecast, by End-users 2019 & 2032
- Table 48: Global APAC Remote Patient Monitoring Systems Industry Volume K Unit Forecast, by End-users 2019 & 2032
- Table 49: Global APAC Remote Patient Monitoring Systems Industry Revenue Million Forecast, by Geography 2019 & 2032
- Table 50: Global APAC Remote Patient Monitoring Systems Industry Volume K Unit Forecast, by Geography 2019 & 2032
- Table 51: Global APAC Remote Patient Monitoring Systems Industry Revenue Million Forecast, by Country 2019 & 2032
- Table 52: Global APAC Remote Patient Monitoring Systems Industry Volume K Unit Forecast, by Country 2019 & 2032
- Table 53: Global APAC Remote Patient Monitoring Systems Industry Revenue Million Forecast, by Type 2019 & 2032
- Table 54: Global APAC Remote Patient Monitoring Systems Industry Volume K Unit Forecast, by Type 2019 & 2032
- Table 55: Global APAC Remote Patient Monitoring Systems Industry Revenue Million Forecast, by Application 2019 & 2032
- Table 56: Global APAC Remote Patient Monitoring Systems Industry Volume K Unit Forecast, by Application 2019 & 2032
- Table 57: Global APAC Remote Patient Monitoring Systems Industry Revenue Million Forecast, by End-users 2019 & 2032
- Table 58: Global APAC Remote Patient Monitoring Systems Industry Volume K Unit Forecast, by End-users 2019 & 2032
- Table 59: Global APAC Remote Patient Monitoring Systems Industry Revenue Million Forecast, by Geography 2019 & 2032
- Table 60: Global APAC Remote Patient Monitoring Systems Industry Volume K Unit Forecast, by Geography 2019 & 2032
- Table 61: Global APAC Remote Patient Monitoring Systems Industry Revenue Million Forecast, by Country 2019 & 2032
- Table 62: Global APAC Remote Patient Monitoring Systems Industry Volume K Unit Forecast, by Country 2019 & 2032
- Table 63: Global APAC Remote Patient Monitoring Systems Industry Revenue Million Forecast, by Type 2019 & 2032
- Table 64: Global APAC Remote Patient Monitoring Systems Industry Volume K Unit Forecast, by Type 2019 & 2032
- Table 65: Global APAC Remote Patient Monitoring Systems Industry Revenue Million Forecast, by Application 2019 & 2032
- Table 66: Global APAC Remote Patient Monitoring Systems Industry Volume K Unit Forecast, by Application 2019 & 2032
- Table 67: Global APAC Remote Patient Monitoring Systems Industry Revenue Million Forecast, by End-users 2019 & 2032
- Table 68: Global APAC Remote Patient Monitoring Systems Industry Volume K Unit Forecast, by End-users 2019 & 2032
- Table 69: Global APAC Remote Patient Monitoring Systems Industry Revenue Million Forecast, by Geography 2019 & 2032
- Table 70: Global APAC Remote Patient Monitoring Systems Industry Volume K Unit Forecast, by Geography 2019 & 2032
- Table 71: Global APAC Remote Patient Monitoring Systems Industry Revenue Million Forecast, by Country 2019 & 2032
- Table 72: Global APAC Remote Patient Monitoring Systems Industry Volume K Unit Forecast, by Country 2019 & 2032
- Table 73: Global APAC Remote Patient Monitoring Systems Industry Revenue Million Forecast, by Type 2019 & 2032
- Table 74: Global APAC Remote Patient Monitoring Systems Industry Volume K Unit Forecast, by Type 2019 & 2032
- Table 75: Global APAC Remote Patient Monitoring Systems Industry Revenue Million Forecast, by Application 2019 & 2032
- Table 76: Global APAC Remote Patient Monitoring Systems Industry Volume K Unit Forecast, by Application 2019 & 2032
- Table 77: Global APAC Remote Patient Monitoring Systems Industry Revenue Million Forecast, by End-users 2019 & 2032
- Table 78: Global APAC Remote Patient Monitoring Systems Industry Volume K Unit Forecast, by End-users 2019 & 2032
- Table 79: Global APAC Remote Patient Monitoring Systems Industry Revenue Million Forecast, by Geography 2019 & 2032
- Table 80: Global APAC Remote Patient Monitoring Systems Industry Volume K Unit Forecast, by Geography 2019 & 2032
- Table 81: Global APAC Remote Patient Monitoring Systems Industry Revenue Million Forecast, by Country 2019 & 2032
- Table 82: Global APAC Remote Patient Monitoring Systems Industry Volume K Unit Forecast, by Country 2019 & 2032
Frequently Asked Questions
1. What is the projected Compound Annual Growth Rate (CAGR) of the APAC Remote Patient Monitoring Systems Industry?
The projected CAGR is approximately 19.28%.
2. Which companies are prominent players in the APAC Remote Patient Monitoring Systems Industry?
Key companies in the market include Nihon Kohden, Masimo Corporation, GE Healthcare, Abbott Laboratories, Medtronic PLC, MidMark India, Apollo Hospitals, Boston Scientific Corporation, AMD Global Telemedicine, Baxter International Inc, Omron Healthcare.
3. What are the main segments of the APAC Remote Patient Monitoring Systems Industry?
The market segments include Type, Application, End-users, Geography.
4. Can you provide details about the market size?
The market size is estimated to be USD 0.86 Million as of 2022.
5. What are some drivers contributing to market growth?
Rising Incidences of Chronic Diseases Coupled With Increasing Geriatric Population; Increasing Demand for Home-based Monitoring Devices; Ease of Use and Portability Devices to Promote the Growth.
6. What are the notable trends driving market growth?
Cancer Treatment are Expected to Witness a Significant Growth Over the Forecast Period.
7. Are there any restraints impacting market growth?
Resistance from Healthcare Industry Professionals; Stringent Regulatory Framework.
8. Can you provide examples of recent developments in the market?
In August 2022 Dozee and Midmark India launched intelligent connected beds to automate and integrate patient monitoring in hospital beds, primarily for non-ICU environments.
9. What pricing options are available for accessing the report?
Pricing options include single-user, multi-user, and enterprise licenses priced at USD 4750, USD 5250, and USD 8750 respectively.
10. Is the market size provided in terms of value or volume?
The market size is provided in terms of value, measured in Million and volume, measured in K Unit.
11. Are there any specific market keywords associated with the report?
Yes, the market keyword associated with the report is "APAC Remote Patient Monitoring Systems Industry," which aids in identifying and referencing the specific market segment covered.
12. How do I determine which pricing option suits my needs best?
The pricing options vary based on user requirements and access needs. Individual users may opt for single-user licenses, while businesses requiring broader access may choose multi-user or enterprise licenses for cost-effective access to the report.
13. Are there any additional resources or data provided in the APAC Remote Patient Monitoring Systems Industry report?
While the report offers comprehensive insights, it's advisable to review the specific contents or supplementary materials provided to ascertain if additional resources or data are available.
14. How can I stay updated on further developments or reports in the APAC Remote Patient Monitoring Systems Industry?
To stay informed about further developments, trends, and reports in the APAC Remote Patient Monitoring Systems Industry, consider subscribing to industry newsletters, following relevant companies and organizations, or regularly checking reputable industry news sources and publications.
Methodology
Step 1 - Identification of Relevant Samples Size from Population Database


Step 2 - Approaches for Defining Global Market Size (Value, Volume* & Price*)

Note*: In applicable scenarios
Step 3 - Data Sources
Primary Research
- Web Analytics
- Survey Reports
- Research Institute
- Latest Research Reports
- Opinion Leaders
Secondary Research
- Annual Reports
- White Paper
- Latest Press Release
- Industry Association
- Paid Database
- Investor Presentations

Step 4 - Data Triangulation
Involves using different sources of information in order to increase the validity of a study
These sources are likely to be stakeholders in a program - participants, other researchers, program staff, other community members, and so on.
Then we put all data in single framework & apply various statistical tools to find out the dynamic on the market.
During the analysis stage, feedback from the stakeholder groups would be compared to determine areas of agreement as well as areas of divergence


