

Key Insights
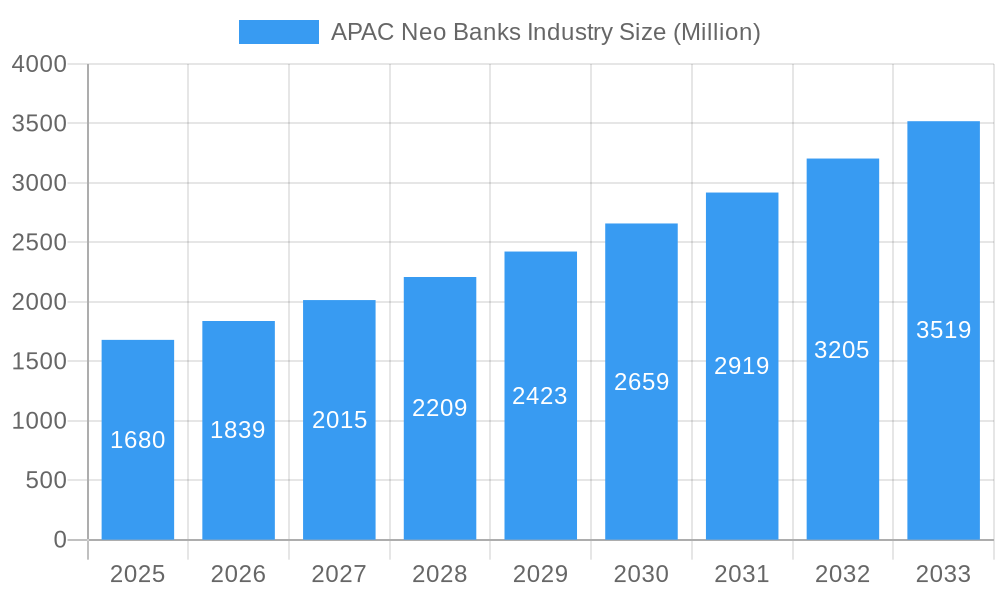
The APAC neo-banking industry is experiencing explosive growth, projected to reach a market size of $1.68 billion in 2025 and maintain a Compound Annual Growth Rate (CAGR) exceeding 9% through 2033. This robust expansion is fueled by several key drivers. Rising smartphone penetration and internet usage across the region are creating a vast pool of digitally-savvy consumers increasingly comfortable managing their finances online. Furthermore, the region's large unbanked and underbanked populations present a significant untapped market for neo-banks offering convenient and accessible financial services. The trend towards personalized and customized financial solutions, coupled with the increasing adoption of open banking APIs, further accelerates the sector's growth. While regulatory hurdles and competition from established players pose challenges, the overall market outlook remains exceptionally positive. Innovative features like AI-powered financial management tools, embedded finance within other applications, and the integration of blockchain technology for enhanced security are shaping the competitive landscape. The presence of numerous established and emerging players such as WE Bank, MY Bank, and Paytm Payments Bank demonstrates the intensifying competition and the industry's potential for further disruption.
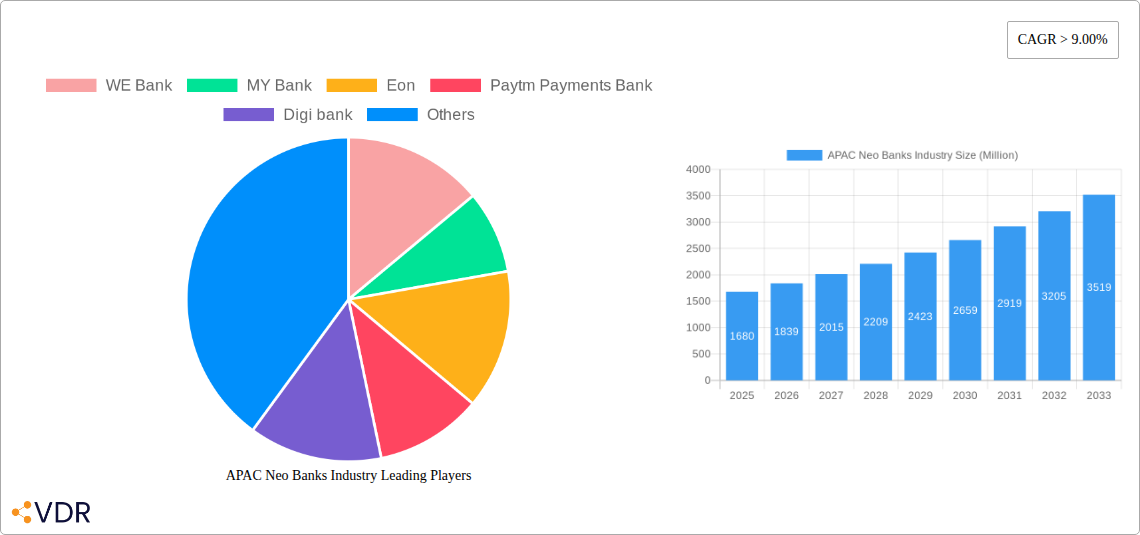
APAC Neo Banks Industry Market Size (In Billion)
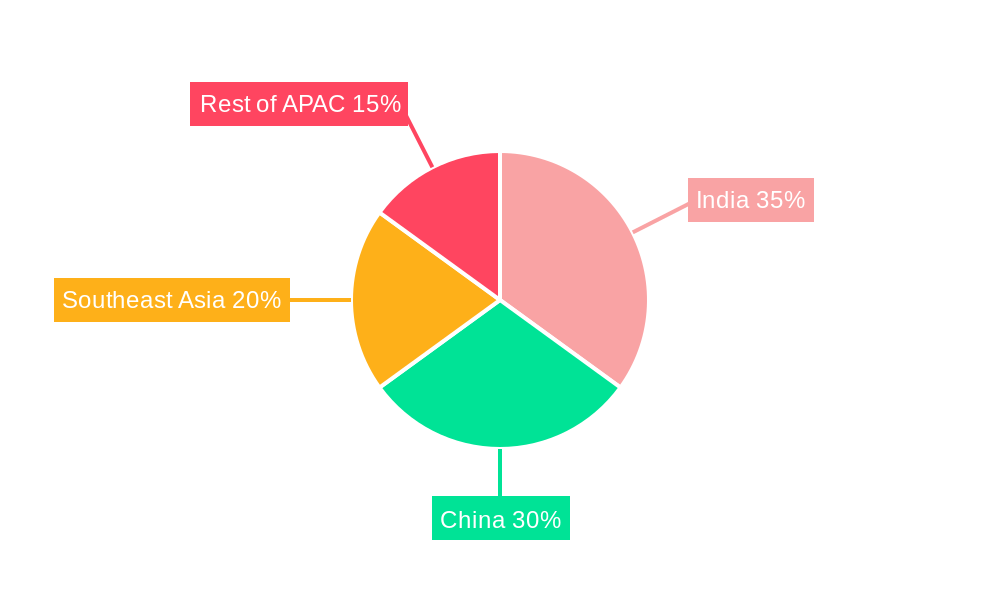
The competitive landscape within APAC neo-banking is characterized by a dynamic mix of established players and innovative startups. Successful players are leveraging technology to streamline processes, reduce operational costs, and provide personalized financial experiences. The sector's growth isn't uniform across all regions within APAC; India, China, and Southeast Asia are experiencing particularly rapid expansion due to high smartphone penetration and a large young population. While data specific to individual APAC nations is not provided, it's reasonable to assume that the market share is heavily influenced by these key regions. Looking ahead, the continuous development of innovative products, strategic partnerships, and expansion into underserved markets will be crucial for success in this rapidly evolving landscape. The industry will likely see consolidation as smaller players are acquired by larger institutions or struggle to compete. The overall trajectory suggests a bright future for APAC neo-banks, driven by technological advancements and the evolving needs of the region's diverse customer base.
APAC Neo Banks Industry Company Market Share
APAC Neo Banks Industry: A Comprehensive Market Report (2019-2033)
This in-depth report provides a comprehensive analysis of the Asia-Pacific (APAC) neo-banks industry, covering market dynamics, growth trends, key players, and future outlook. The study period spans from 2019 to 2033, with 2025 as the base and estimated year. The report offers invaluable insights for investors, industry professionals, and strategic decision-makers seeking to navigate this rapidly evolving landscape. The total market size in 2025 is estimated at xx Million, projected to reach xx Million by 2033.
Parent Market: Financial Technology (FinTech) in APAC Child Market: Digital Banking Services
APAC Neo Banks Industry Market Dynamics & Structure
This section analyzes the APAC neo-banks market structure, encompassing market concentration, technological advancements, regulatory influences, competitive dynamics, and user demographics. We delve into mergers and acquisitions (M&A) activity, providing both quantitative and qualitative insights.
- Market Concentration: The APAC neo-banks market exhibits a moderately concentrated structure, with a few major players holding significant market share, while numerous smaller players compete for niche segments. In 2025, the top 5 players are estimated to hold xx% of the market share.
- Technological Innovation: The industry is characterized by rapid technological advancements, particularly in areas such as AI-powered personalized services, blockchain integration for enhanced security, and open banking APIs facilitating interoperability.
- Regulatory Frameworks: Varying regulatory landscapes across APAC countries significantly impact market dynamics. Stringent compliance requirements and evolving data privacy regulations present both challenges and opportunities.
- Competitive Landscape: Intense competition exists among established neo-banks and traditional banks venturing into digital banking, leading to innovative product offerings and aggressive pricing strategies. The entry of big tech companies further intensifies the competitive pressure.
- End-User Demographics: The target demographic primarily comprises tech-savvy millennials and Gen Z, driving demand for convenient, user-friendly, and personalized banking solutions.
- M&A Activity: The past five years have witnessed a moderate level of M&A activity, with xx deals recorded during the historical period (2019-2024), primarily focused on expanding market reach and technological capabilities.
APAC Neo Banks Industry Growth Trends & Insights
This section analyzes the market's historical and projected growth trajectory, exploring factors driving adoption rates, technological disruptions, and evolving consumer behavior. We utilize data to deliver a detailed analysis.
The APAC neo-banks market witnessed robust growth during the historical period (2019-2024), with a CAGR of xx%. This growth is primarily attributed to increasing smartphone penetration, rising internet access, and growing preference for digital banking services among the younger population. The market is poised for continued expansion during the forecast period (2025-2033), with a projected CAGR of xx%, driven by factors such as financial inclusion initiatives, expanding digital infrastructure, and the increasing adoption of mobile payment solutions. Technological advancements such as AI-powered chatbots for customer support and biometric authentication for enhanced security are further accelerating market growth. Changing consumer preferences towards personalized and seamless banking experiences also contribute significantly to market expansion. Market penetration is expected to increase from xx% in 2025 to xx% by 2033.
Dominant Regions, Countries, or Segments in APAC Neo Banks Industry
This section identifies the leading regions, countries, and segments driving market growth within the APAC neo-banks industry.
- Leading Regions: India and Indonesia are projected to be the dominant markets during the forecast period, owing to their large populations, rapid digitalization, and favorable regulatory environments.
- Key Growth Drivers:
- Government Initiatives: Numerous government initiatives aimed at promoting financial inclusion and digitalization are fueling market expansion.
- Technological Infrastructure: Improvements in internet and mobile network infrastructure are crucial for fostering digital banking adoption.
- Economic Growth: Strong economic growth in certain APAC countries increases disposable incomes and fuels demand for sophisticated financial services.
China and Singapore are also major players, demonstrating significant market share and growth potential. While market dominance is presently held by a few countries, other nations are rapidly catching up, driven by improving digital infrastructure and supportive government policies. The competitive landscape is dynamic, and market share will continue to shift during the forecast period.
APAC Neo Banks Industry Product Landscape
Neo-banks in APAC offer a wide range of digital banking products and services, including mobile-first banking apps, personalized financial management tools, peer-to-peer (P2P) payment solutions, and investment platforms. These offerings are often distinguished by their user-friendly interfaces, advanced security features, and seamless integration with other financial services. Key innovations include AI-powered financial planning tools and blockchain technology for enhanced security and transparency. The performance of these products is largely measured by user engagement metrics such as daily/monthly active users, customer acquisition cost, and customer lifetime value.
Key Drivers, Barriers & Challenges in APAC Neo Banks Industry
Key Drivers:
- Technological Advancements: The ongoing development of innovative technologies like AI, machine learning, and blockchain drives efficiency and improves security in neo-banking operations.
- Increased Smartphone Penetration: The widespread adoption of smartphones facilitates seamless access to digital banking services across APAC.
- Government Support: Government initiatives promoting financial inclusion and digital transformation create favorable conditions for neo-bank growth.
Key Challenges:
- Cybersecurity Threats: The increasing reliance on digital platforms exposes neo-banks to significant cybersecurity risks, requiring robust security measures.
- Regulatory Compliance: Navigating complex and evolving regulatory landscapes in different APAC countries presents a significant challenge.
- Competition: Intense competition from traditional banks and other fintech players necessitates continuous innovation and strategic differentiation. This pressure leads to increased marketing costs and impacts profitability.
Emerging Opportunities in APAC Neo Banks Industry
Emerging opportunities lie in untapped markets, particularly in underserved rural areas with limited access to traditional banking services. The expansion of financial services to the unbanked and underbanked population presents a significant growth opportunity. Furthermore, the integration of innovative technologies such as embedded finance and open banking APIs creates potential for new partnerships and revenue streams. Evolving consumer preferences toward personalized financial management tools and sustainable banking practices present further opportunities for differentiation.
Growth Accelerators in the APAC Neo Banks Industry
Long-term growth will be accelerated by strategic partnerships between neo-banks and other fintech companies, enhancing product offerings and expanding market reach. Technological breakthroughs in areas like AI and blockchain will drive efficiency, improve security, and personalize customer experiences. Expansion into new markets within APAC, particularly in countries with growing digital adoption rates, will also fuel long-term growth. A focus on delivering seamless, personalized experiences, addressing cybersecurity concerns, and successfully navigating regulatory challenges are crucial for continued success.
Key Players Shaping the APAC Neo Banks Industry Market
- WE Bank
- MY Bank
- Eon
- Paytm Payments Bank
- Digi bank
- Jenius
- SBI Sumishin Net Bank
- Kakao Bank
- K Plus
- Timo
- Volt
- Xinja
- BigPay
- Neat
- List Not Exhaustive
Notable Milestones in APAC Neo Banks Industry Sector
- October 2023: Paytm launched the industry’s first alternate ID-based guest checkout solution for merchants, enhancing security and convenience.
- July 2023: Paytm introduced two innovative 4G-enabled payment devices (Paytm Pocket Soundbox and Paytm Music Soundbox), expanding payment options for merchants.
In-Depth APAC Neo Banks Industry Market Outlook
The future of the APAC neo-banks market is promising, driven by continued technological innovation, expanding digital infrastructure, and increasing financial inclusion initiatives. Strategic partnerships, expansion into underserved markets, and a focus on personalized customer experiences will be crucial for sustained growth. Successfully navigating regulatory complexities and addressing cybersecurity risks will be paramount for long-term success. The market is expected to experience significant expansion, presenting substantial opportunities for both established players and new entrants.
APAC Neo Banks Industry Segmentation
-
1. Service Type
- 1.1. Payments
- 1.2. Savings Products
- 1.3. Current Account
- 1.4. Consumer Credit
- 1.5. Loans
- 1.6. Others
-
2. End-User Type
- 2.1. Business Segment
- 2.2. Personal Segment
APAC Neo Banks Industry Segmentation By Geography
-
1. North America
- 1.1. United States
- 1.2. Canada
- 1.3. Mexico
-
2. South America
- 2.1. Brazil
- 2.2. Argentina
- 2.3. Rest of South America
-
3. Europe
- 3.1. United Kingdom
- 3.2. Germany
- 3.3. France
- 3.4. Italy
- 3.5. Spain
- 3.6. Russia
- 3.7. Benelux
- 3.8. Nordics
- 3.9. Rest of Europe
-
4. Middle East & Africa
- 4.1. Turkey
- 4.2. Israel
- 4.3. GCC
- 4.4. North Africa
- 4.5. South Africa
- 4.6. Rest of Middle East & Africa
-
5. Asia Pacific
- 5.1. China
- 5.2. India
- 5.3. Japan
- 5.4. South Korea
- 5.5. ASEAN
- 5.6. Oceania
- 5.7. Rest of Asia Pacific
APAC Neo Banks Industry Regional Market Share
Geographic Coverage of APAC Neo Banks Industry
APAC Neo Banks Industry REPORT HIGHLIGHTS
| Aspects | Details |
|---|---|
| Study Period | 2020-2034 |
| Base Year | 2025 |
| Estimated Year | 2026 |
| Forecast Period | 2026-2034 |
| Historical Period | 2020-2025 |
| Growth Rate | CAGR of > 9.00% from 2020-2034 |
| Segmentation |
|
Table of Contents
- 1. Introduction
- 1.1. Research Scope
- 1.2. Market Segmentation
- 1.3. Research Objective
- 1.4. Definitions and Assumptions
- 2. Executive Summary
- 2.1. Market Snapshot
- 3. Market Dynamics
- 3.1. Market Drivers
- 3.2. Market Restrains
- 3.3. Market Trends
- 3.4. Market Opportunities
- 4. Market Factor Analysis
- 4.1. Porters Five Forces
- 4.1.1. Bargaining Power of Suppliers
- 4.1.2. Bargaining Power of Buyers
- 4.1.3. Threat of New Entrants
- 4.1.4. Threat of Substitutes
- 4.1.5. Competitive Rivalry
- 4.2. PESTEL analysis
- 4.3. BCG Analysis
- 4.3.1. Stars (High Growth, High Market Share)
- 4.3.2. Cash Cows (Low Growth, High Market Share)
- 4.3.3. Question Mark (High Growth, Low Market Share)
- 4.3.4. Dogs (Low Growth, Low Market Share)
- 4.4. Ansoff Matrix Analysis
- 4.5. Supply Chain Analysis
- 4.6. Regulatory Landscape
- 4.7. Current Market Potential and Opportunity Assessment (TAM–SAM–SOM Framework)
- 4.8. VDR Analyst Note
- 4.1. Porters Five Forces
- 5. Market Analysis, Insights and Forecast 2021-2033
- 5.1. Market Analysis, Insights and Forecast - by Service Type
- 5.1.1. Payments
- 5.1.2. Savings Products
- 5.1.3. Current Account
- 5.1.4. Consumer Credit
- 5.1.5. Loans
- 5.1.6. Others
- 5.2. Market Analysis, Insights and Forecast - by End-User Type
- 5.2.1. Business Segment
- 5.2.2. Personal Segment
- 5.3. Market Analysis, Insights and Forecast - by Region
- 5.3.1. North America
- 5.3.2. South America
- 5.3.3. Europe
- 5.3.4. Middle East & Africa
- 5.3.5. Asia Pacific
- 5.1. Market Analysis, Insights and Forecast - by Service Type
- 6. Global APAC Neo Banks Industry Analysis, Insights and Forecast, 2021-2033
- 6.1. Market Analysis, Insights and Forecast - by Service Type
- 6.1.1. Payments
- 6.1.2. Savings Products
- 6.1.3. Current Account
- 6.1.4. Consumer Credit
- 6.1.5. Loans
- 6.1.6. Others
- 6.2. Market Analysis, Insights and Forecast - by End-User Type
- 6.2.1. Business Segment
- 6.2.2. Personal Segment
- 6.1. Market Analysis, Insights and Forecast - by Service Type
- 7. North America APAC Neo Banks Industry Analysis, Insights and Forecast, 2021-2033
- 7.1. Market Analysis, Insights and Forecast - by Service Type
- 7.1.1. Payments
- 7.1.2. Savings Products
- 7.1.3. Current Account
- 7.1.4. Consumer Credit
- 7.1.5. Loans
- 7.1.6. Others
- 7.2. Market Analysis, Insights and Forecast - by End-User Type
- 7.2.1. Business Segment
- 7.2.2. Personal Segment
- 7.1. Market Analysis, Insights and Forecast - by Service Type
- 8. South America APAC Neo Banks Industry Analysis, Insights and Forecast, 2021-2033
- 8.1. Market Analysis, Insights and Forecast - by Service Type
- 8.1.1. Payments
- 8.1.2. Savings Products
- 8.1.3. Current Account
- 8.1.4. Consumer Credit
- 8.1.5. Loans
- 8.1.6. Others
- 8.2. Market Analysis, Insights and Forecast - by End-User Type
- 8.2.1. Business Segment
- 8.2.2. Personal Segment
- 8.1. Market Analysis, Insights and Forecast - by Service Type
- 9. Europe APAC Neo Banks Industry Analysis, Insights and Forecast, 2021-2033
- 9.1. Market Analysis, Insights and Forecast - by Service Type
- 9.1.1. Payments
- 9.1.2. Savings Products
- 9.1.3. Current Account
- 9.1.4. Consumer Credit
- 9.1.5. Loans
- 9.1.6. Others
- 9.2. Market Analysis, Insights and Forecast - by End-User Type
- 9.2.1. Business Segment
- 9.2.2. Personal Segment
- 9.1. Market Analysis, Insights and Forecast - by Service Type
- 10. Middle East & Africa APAC Neo Banks Industry Analysis, Insights and Forecast, 2021-2033
- 10.1. Market Analysis, Insights and Forecast - by Service Type
- 10.1.1. Payments
- 10.1.2. Savings Products
- 10.1.3. Current Account
- 10.1.4. Consumer Credit
- 10.1.5. Loans
- 10.1.6. Others
- 10.2. Market Analysis, Insights and Forecast - by End-User Type
- 10.2.1. Business Segment
- 10.2.2. Personal Segment
- 10.1. Market Analysis, Insights and Forecast - by Service Type
- 11. Asia Pacific APAC Neo Banks Industry Analysis, Insights and Forecast, 2021-2033
- 11.1. Market Analysis, Insights and Forecast - by Service Type
- 11.1.1. Payments
- 11.1.2. Savings Products
- 11.1.3. Current Account
- 11.1.4. Consumer Credit
- 11.1.5. Loans
- 11.1.6. Others
- 11.2. Market Analysis, Insights and Forecast - by End-User Type
- 11.2.1. Business Segment
- 11.2.2. Personal Segment
- 11.1. Market Analysis, Insights and Forecast - by Service Type
- 12. Competitive Analysis
- 12.1. Company Profiles
- 12.1.1 WE Bank
- 12.1.1.1. Company Overview
- 12.1.1.2. Products
- 12.1.1.3. Company Financials
- 12.1.1.4. SWOT Analysis
- 12.1.2 MY Bank
- 12.1.2.1. Company Overview
- 12.1.2.2. Products
- 12.1.2.3. Company Financials
- 12.1.2.4. SWOT Analysis
- 12.1.3 Eon
- 12.1.3.1. Company Overview
- 12.1.3.2. Products
- 12.1.3.3. Company Financials
- 12.1.3.4. SWOT Analysis
- 12.1.4 Paytm Payments Bank
- 12.1.4.1. Company Overview
- 12.1.4.2. Products
- 12.1.4.3. Company Financials
- 12.1.4.4. SWOT Analysis
- 12.1.5 Digi bank
- 12.1.5.1. Company Overview
- 12.1.5.2. Products
- 12.1.5.3. Company Financials
- 12.1.5.4. SWOT Analysis
- 12.1.6 Jenius
- 12.1.6.1. Company Overview
- 12.1.6.2. Products
- 12.1.6.3. Company Financials
- 12.1.6.4. SWOT Analysis
- 12.1.7 SBI Sumishin Net Bank
- 12.1.7.1. Company Overview
- 12.1.7.2. Products
- 12.1.7.3. Company Financials
- 12.1.7.4. SWOT Analysis
- 12.1.8 Kakao Bank
- 12.1.8.1. Company Overview
- 12.1.8.2. Products
- 12.1.8.3. Company Financials
- 12.1.8.4. SWOT Analysis
- 12.1.9 K Plus
- 12.1.9.1. Company Overview
- 12.1.9.2. Products
- 12.1.9.3. Company Financials
- 12.1.9.4. SWOT Analysis
- 12.1.10 Timo
- 12.1.10.1. Company Overview
- 12.1.10.2. Products
- 12.1.10.3. Company Financials
- 12.1.10.4. SWOT Analysis
- 12.1.11 Volt
- 12.1.11.1. Company Overview
- 12.1.11.2. Products
- 12.1.11.3. Company Financials
- 12.1.11.4. SWOT Analysis
- 12.1.12 Xinja
- 12.1.12.1. Company Overview
- 12.1.12.2. Products
- 12.1.12.3. Company Financials
- 12.1.12.4. SWOT Analysis
- 12.1.13 BigPay
- 12.1.13.1. Company Overview
- 12.1.13.2. Products
- 12.1.13.3. Company Financials
- 12.1.13.4. SWOT Analysis
- 12.1.14 Neat**List Not Exhaustive
- 12.1.14.1. Company Overview
- 12.1.14.2. Products
- 12.1.14.3. Company Financials
- 12.1.14.4. SWOT Analysis
- 12.1.1 WE Bank
- 12.2. Market Entropy
- 12.2.1 Company's Key Areas Served
- 12.2.2 Recent Developments
- 12.3. Company Market Share Analysis 2025
- 12.3.1 Top 5 Companies Market Share Analysis
- 12.3.2 Top 3 Companies Market Share Analysis
- 12.4. List of Potential Customers
- 13. Research Methodology
List of Figures
- Figure 1: Global APAC Neo Banks Industry Revenue Breakdown (Million, %) by Region 2025 & 2033
- Figure 2: Global APAC Neo Banks Industry Volume Breakdown (Billion, %) by Region 2025 & 2033
- Figure 3: North America APAC Neo Banks Industry Revenue (Million), by Service Type 2025 & 2033
- Figure 4: North America APAC Neo Banks Industry Volume (Billion), by Service Type 2025 & 2033
- Figure 5: North America APAC Neo Banks Industry Revenue Share (%), by Service Type 2025 & 2033
- Figure 6: North America APAC Neo Banks Industry Volume Share (%), by Service Type 2025 & 2033
- Figure 7: North America APAC Neo Banks Industry Revenue (Million), by End-User Type 2025 & 2033
- Figure 8: North America APAC Neo Banks Industry Volume (Billion), by End-User Type 2025 & 2033
- Figure 9: North America APAC Neo Banks Industry Revenue Share (%), by End-User Type 2025 & 2033
- Figure 10: North America APAC Neo Banks Industry Volume Share (%), by End-User Type 2025 & 2033
- Figure 11: North America APAC Neo Banks Industry Revenue (Million), by Country 2025 & 2033
- Figure 12: North America APAC Neo Banks Industry Volume (Billion), by Country 2025 & 2033
- Figure 13: North America APAC Neo Banks Industry Revenue Share (%), by Country 2025 & 2033
- Figure 14: North America APAC Neo Banks Industry Volume Share (%), by Country 2025 & 2033
- Figure 15: South America APAC Neo Banks Industry Revenue (Million), by Service Type 2025 & 2033
- Figure 16: South America APAC Neo Banks Industry Volume (Billion), by Service Type 2025 & 2033
- Figure 17: South America APAC Neo Banks Industry Revenue Share (%), by Service Type 2025 & 2033
- Figure 18: South America APAC Neo Banks Industry Volume Share (%), by Service Type 2025 & 2033
- Figure 19: South America APAC Neo Banks Industry Revenue (Million), by End-User Type 2025 & 2033
- Figure 20: South America APAC Neo Banks Industry Volume (Billion), by End-User Type 2025 & 2033
- Figure 21: South America APAC Neo Banks Industry Revenue Share (%), by End-User Type 2025 & 2033
- Figure 22: South America APAC Neo Banks Industry Volume Share (%), by End-User Type 2025 & 2033
- Figure 23: South America APAC Neo Banks Industry Revenue (Million), by Country 2025 & 2033
- Figure 24: South America APAC Neo Banks Industry Volume (Billion), by Country 2025 & 2033
- Figure 25: South America APAC Neo Banks Industry Revenue Share (%), by Country 2025 & 2033
- Figure 26: South America APAC Neo Banks Industry Volume Share (%), by Country 2025 & 2033
- Figure 27: Europe APAC Neo Banks Industry Revenue (Million), by Service Type 2025 & 2033
- Figure 28: Europe APAC Neo Banks Industry Volume (Billion), by Service Type 2025 & 2033
- Figure 29: Europe APAC Neo Banks Industry Revenue Share (%), by Service Type 2025 & 2033
- Figure 30: Europe APAC Neo Banks Industry Volume Share (%), by Service Type 2025 & 2033
- Figure 31: Europe APAC Neo Banks Industry Revenue (Million), by End-User Type 2025 & 2033
- Figure 32: Europe APAC Neo Banks Industry Volume (Billion), by End-User Type 2025 & 2033
- Figure 33: Europe APAC Neo Banks Industry Revenue Share (%), by End-User Type 2025 & 2033
- Figure 34: Europe APAC Neo Banks Industry Volume Share (%), by End-User Type 2025 & 2033
- Figure 35: Europe APAC Neo Banks Industry Revenue (Million), by Country 2025 & 2033
- Figure 36: Europe APAC Neo Banks Industry Volume (Billion), by Country 2025 & 2033
- Figure 37: Europe APAC Neo Banks Industry Revenue Share (%), by Country 2025 & 2033
- Figure 38: Europe APAC Neo Banks Industry Volume Share (%), by Country 2025 & 2033
- Figure 39: Middle East & Africa APAC Neo Banks Industry Revenue (Million), by Service Type 2025 & 2033
- Figure 40: Middle East & Africa APAC Neo Banks Industry Volume (Billion), by Service Type 2025 & 2033
- Figure 41: Middle East & Africa APAC Neo Banks Industry Revenue Share (%), by Service Type 2025 & 2033
- Figure 42: Middle East & Africa APAC Neo Banks Industry Volume Share (%), by Service Type 2025 & 2033
- Figure 43: Middle East & Africa APAC Neo Banks Industry Revenue (Million), by End-User Type 2025 & 2033
- Figure 44: Middle East & Africa APAC Neo Banks Industry Volume (Billion), by End-User Type 2025 & 2033
- Figure 45: Middle East & Africa APAC Neo Banks Industry Revenue Share (%), by End-User Type 2025 & 2033
- Figure 46: Middle East & Africa APAC Neo Banks Industry Volume Share (%), by End-User Type 2025 & 2033
- Figure 47: Middle East & Africa APAC Neo Banks Industry Revenue (Million), by Country 2025 & 2033
- Figure 48: Middle East & Africa APAC Neo Banks Industry Volume (Billion), by Country 2025 & 2033
- Figure 49: Middle East & Africa APAC Neo Banks Industry Revenue Share (%), by Country 2025 & 2033
- Figure 50: Middle East & Africa APAC Neo Banks Industry Volume Share (%), by Country 2025 & 2033
- Figure 51: Asia Pacific APAC Neo Banks Industry Revenue (Million), by Service Type 2025 & 2033
- Figure 52: Asia Pacific APAC Neo Banks Industry Volume (Billion), by Service Type 2025 & 2033
- Figure 53: Asia Pacific APAC Neo Banks Industry Revenue Share (%), by Service Type 2025 & 2033
- Figure 54: Asia Pacific APAC Neo Banks Industry Volume Share (%), by Service Type 2025 & 2033
- Figure 55: Asia Pacific APAC Neo Banks Industry Revenue (Million), by End-User Type 2025 & 2033
- Figure 56: Asia Pacific APAC Neo Banks Industry Volume (Billion), by End-User Type 2025 & 2033
- Figure 57: Asia Pacific APAC Neo Banks Industry Revenue Share (%), by End-User Type 2025 & 2033
- Figure 58: Asia Pacific APAC Neo Banks Industry Volume Share (%), by End-User Type 2025 & 2033
- Figure 59: Asia Pacific APAC Neo Banks Industry Revenue (Million), by Country 2025 & 2033
- Figure 60: Asia Pacific APAC Neo Banks Industry Volume (Billion), by Country 2025 & 2033
- Figure 61: Asia Pacific APAC Neo Banks Industry Revenue Share (%), by Country 2025 & 2033
- Figure 62: Asia Pacific APAC Neo Banks Industry Volume Share (%), by Country 2025 & 2033
List of Tables
- Table 1: Global APAC Neo Banks Industry Revenue Million Forecast, by Service Type 2020 & 2033
- Table 2: Global APAC Neo Banks Industry Volume Billion Forecast, by Service Type 2020 & 2033
- Table 3: Global APAC Neo Banks Industry Revenue Million Forecast, by End-User Type 2020 & 2033
- Table 4: Global APAC Neo Banks Industry Volume Billion Forecast, by End-User Type 2020 & 2033
- Table 5: Global APAC Neo Banks Industry Revenue Million Forecast, by Region 2020 & 2033
- Table 6: Global APAC Neo Banks Industry Volume Billion Forecast, by Region 2020 & 2033
- Table 7: Global APAC Neo Banks Industry Revenue Million Forecast, by Service Type 2020 & 2033
- Table 8: Global APAC Neo Banks Industry Volume Billion Forecast, by Service Type 2020 & 2033
- Table 9: Global APAC Neo Banks Industry Revenue Million Forecast, by End-User Type 2020 & 2033
- Table 10: Global APAC Neo Banks Industry Volume Billion Forecast, by End-User Type 2020 & 2033
- Table 11: Global APAC Neo Banks Industry Revenue Million Forecast, by Country 2020 & 2033
- Table 12: Global APAC Neo Banks Industry Volume Billion Forecast, by Country 2020 & 2033
- Table 13: United States APAC Neo Banks Industry Revenue (Million) Forecast, by Application 2020 & 2033
- Table 14: United States APAC Neo Banks Industry Volume (Billion) Forecast, by Application 2020 & 2033
- Table 15: Canada APAC Neo Banks Industry Revenue (Million) Forecast, by Application 2020 & 2033
- Table 16: Canada APAC Neo Banks Industry Volume (Billion) Forecast, by Application 2020 & 2033
- Table 17: Mexico APAC Neo Banks Industry Revenue (Million) Forecast, by Application 2020 & 2033
- Table 18: Mexico APAC Neo Banks Industry Volume (Billion) Forecast, by Application 2020 & 2033
- Table 19: Global APAC Neo Banks Industry Revenue Million Forecast, by Service Type 2020 & 2033
- Table 20: Global APAC Neo Banks Industry Volume Billion Forecast, by Service Type 2020 & 2033
- Table 21: Global APAC Neo Banks Industry Revenue Million Forecast, by End-User Type 2020 & 2033
- Table 22: Global APAC Neo Banks Industry Volume Billion Forecast, by End-User Type 2020 & 2033
- Table 23: Global APAC Neo Banks Industry Revenue Million Forecast, by Country 2020 & 2033
- Table 24: Global APAC Neo Banks Industry Volume Billion Forecast, by Country 2020 & 2033
- Table 25: Brazil APAC Neo Banks Industry Revenue (Million) Forecast, by Application 2020 & 2033
- Table 26: Brazil APAC Neo Banks Industry Volume (Billion) Forecast, by Application 2020 & 2033
- Table 27: Argentina APAC Neo Banks Industry Revenue (Million) Forecast, by Application 2020 & 2033
- Table 28: Argentina APAC Neo Banks Industry Volume (Billion) Forecast, by Application 2020 & 2033
- Table 29: Rest of South America APAC Neo Banks Industry Revenue (Million) Forecast, by Application 2020 & 2033
- Table 30: Rest of South America APAC Neo Banks Industry Volume (Billion) Forecast, by Application 2020 & 2033
- Table 31: Global APAC Neo Banks Industry Revenue Million Forecast, by Service Type 2020 & 2033
- Table 32: Global APAC Neo Banks Industry Volume Billion Forecast, by Service Type 2020 & 2033
- Table 33: Global APAC Neo Banks Industry Revenue Million Forecast, by End-User Type 2020 & 2033
- Table 34: Global APAC Neo Banks Industry Volume Billion Forecast, by End-User Type 2020 & 2033
- Table 35: Global APAC Neo Banks Industry Revenue Million Forecast, by Country 2020 & 2033
- Table 36: Global APAC Neo Banks Industry Volume Billion Forecast, by Country 2020 & 2033
- Table 37: United Kingdom APAC Neo Banks Industry Revenue (Million) Forecast, by Application 2020 & 2033
- Table 38: United Kingdom APAC Neo Banks Industry Volume (Billion) Forecast, by Application 2020 & 2033
- Table 39: Germany APAC Neo Banks Industry Revenue (Million) Forecast, by Application 2020 & 2033
- Table 40: Germany APAC Neo Banks Industry Volume (Billion) Forecast, by Application 2020 & 2033
- Table 41: France APAC Neo Banks Industry Revenue (Million) Forecast, by Application 2020 & 2033
- Table 42: France APAC Neo Banks Industry Volume (Billion) Forecast, by Application 2020 & 2033
- Table 43: Italy APAC Neo Banks Industry Revenue (Million) Forecast, by Application 2020 & 2033
- Table 44: Italy APAC Neo Banks Industry Volume (Billion) Forecast, by Application 2020 & 2033
- Table 45: Spain APAC Neo Banks Industry Revenue (Million) Forecast, by Application 2020 & 2033
- Table 46: Spain APAC Neo Banks Industry Volume (Billion) Forecast, by Application 2020 & 2033
- Table 47: Russia APAC Neo Banks Industry Revenue (Million) Forecast, by Application 2020 & 2033
- Table 48: Russia APAC Neo Banks Industry Volume (Billion) Forecast, by Application 2020 & 2033
- Table 49: Benelux APAC Neo Banks Industry Revenue (Million) Forecast, by Application 2020 & 2033
- Table 50: Benelux APAC Neo Banks Industry Volume (Billion) Forecast, by Application 2020 & 2033
- Table 51: Nordics APAC Neo Banks Industry Revenue (Million) Forecast, by Application 2020 & 2033
- Table 52: Nordics APAC Neo Banks Industry Volume (Billion) Forecast, by Application 2020 & 2033
- Table 53: Rest of Europe APAC Neo Banks Industry Revenue (Million) Forecast, by Application 2020 & 2033
- Table 54: Rest of Europe APAC Neo Banks Industry Volume (Billion) Forecast, by Application 2020 & 2033
- Table 55: Global APAC Neo Banks Industry Revenue Million Forecast, by Service Type 2020 & 2033
- Table 56: Global APAC Neo Banks Industry Volume Billion Forecast, by Service Type 2020 & 2033
- Table 57: Global APAC Neo Banks Industry Revenue Million Forecast, by End-User Type 2020 & 2033
- Table 58: Global APAC Neo Banks Industry Volume Billion Forecast, by End-User Type 2020 & 2033
- Table 59: Global APAC Neo Banks Industry Revenue Million Forecast, by Country 2020 & 2033
- Table 60: Global APAC Neo Banks Industry Volume Billion Forecast, by Country 2020 & 2033
- Table 61: Turkey APAC Neo Banks Industry Revenue (Million) Forecast, by Application 2020 & 2033
- Table 62: Turkey APAC Neo Banks Industry Volume (Billion) Forecast, by Application 2020 & 2033
- Table 63: Israel APAC Neo Banks Industry Revenue (Million) Forecast, by Application 2020 & 2033
- Table 64: Israel APAC Neo Banks Industry Volume (Billion) Forecast, by Application 2020 & 2033
- Table 65: GCC APAC Neo Banks Industry Revenue (Million) Forecast, by Application 2020 & 2033
- Table 66: GCC APAC Neo Banks Industry Volume (Billion) Forecast, by Application 2020 & 2033
- Table 67: North Africa APAC Neo Banks Industry Revenue (Million) Forecast, by Application 2020 & 2033
- Table 68: North Africa APAC Neo Banks Industry Volume (Billion) Forecast, by Application 2020 & 2033
- Table 69: South Africa APAC Neo Banks Industry Revenue (Million) Forecast, by Application 2020 & 2033
- Table 70: South Africa APAC Neo Banks Industry Volume (Billion) Forecast, by Application 2020 & 2033
- Table 71: Rest of Middle East & Africa APAC Neo Banks Industry Revenue (Million) Forecast, by Application 2020 & 2033
- Table 72: Rest of Middle East & Africa APAC Neo Banks Industry Volume (Billion) Forecast, by Application 2020 & 2033
- Table 73: Global APAC Neo Banks Industry Revenue Million Forecast, by Service Type 2020 & 2033
- Table 74: Global APAC Neo Banks Industry Volume Billion Forecast, by Service Type 2020 & 2033
- Table 75: Global APAC Neo Banks Industry Revenue Million Forecast, by End-User Type 2020 & 2033
- Table 76: Global APAC Neo Banks Industry Volume Billion Forecast, by End-User Type 2020 & 2033
- Table 77: Global APAC Neo Banks Industry Revenue Million Forecast, by Country 2020 & 2033
- Table 78: Global APAC Neo Banks Industry Volume Billion Forecast, by Country 2020 & 2033
- Table 79: China APAC Neo Banks Industry Revenue (Million) Forecast, by Application 2020 & 2033
- Table 80: China APAC Neo Banks Industry Volume (Billion) Forecast, by Application 2020 & 2033
- Table 81: India APAC Neo Banks Industry Revenue (Million) Forecast, by Application 2020 & 2033
- Table 82: India APAC Neo Banks Industry Volume (Billion) Forecast, by Application 2020 & 2033
- Table 83: Japan APAC Neo Banks Industry Revenue (Million) Forecast, by Application 2020 & 2033
- Table 84: Japan APAC Neo Banks Industry Volume (Billion) Forecast, by Application 2020 & 2033
- Table 85: South Korea APAC Neo Banks Industry Revenue (Million) Forecast, by Application 2020 & 2033
- Table 86: South Korea APAC Neo Banks Industry Volume (Billion) Forecast, by Application 2020 & 2033
- Table 87: ASEAN APAC Neo Banks Industry Revenue (Million) Forecast, by Application 2020 & 2033
- Table 88: ASEAN APAC Neo Banks Industry Volume (Billion) Forecast, by Application 2020 & 2033
- Table 89: Oceania APAC Neo Banks Industry Revenue (Million) Forecast, by Application 2020 & 2033
- Table 90: Oceania APAC Neo Banks Industry Volume (Billion) Forecast, by Application 2020 & 2033
- Table 91: Rest of Asia Pacific APAC Neo Banks Industry Revenue (Million) Forecast, by Application 2020 & 2033
- Table 92: Rest of Asia Pacific APAC Neo Banks Industry Volume (Billion) Forecast, by Application 2020 & 2033
Frequently Asked Questions
1. What is the projected Compound Annual Growth Rate (CAGR) of the APAC Neo Banks Industry?
The projected CAGR is approximately > 9.00%.
2. Which companies are prominent players in the APAC Neo Banks Industry?
Key companies in the market include WE Bank, MY Bank, Eon, Paytm Payments Bank, Digi bank, Jenius, SBI Sumishin Net Bank, Kakao Bank, K Plus, Timo, Volt, Xinja, BigPay, Neat**List Not Exhaustive.
3. What are the main segments of the APAC Neo Banks Industry?
The market segments include Service Type, End-User Type.
4. Can you provide details about the market size?
The market size is estimated to be USD 1.68 Million as of 2022.
5. What are some drivers contributing to market growth?
Increase in Internet Penetration is Driving the Market.
6. What are the notable trends driving market growth?
Raise in Mobile Penetration and High Unbanked Adults in the Region.
7. Are there any restraints impacting market growth?
Increase in Internet Penetration is Driving the Market.
8. Can you provide examples of recent developments in the market?
In October 2023, Paytm launched the industry’s first alternate ID-based guest checkout solution for merchants. Tokenisation masks the 16-digit debit or credit card number with a unique token that is specific to one’s card to prevent misuse and theft from merchant websites.
9. What pricing options are available for accessing the report?
Pricing options include single-user, multi-user, and enterprise licenses priced at USD 4750, USD 5250, and USD 8750 respectively.
10. Is the market size provided in terms of value or volume?
The market size is provided in terms of value, measured in Million and volume, measured in Billion.
11. Are there any specific market keywords associated with the report?
Yes, the market keyword associated with the report is "APAC Neo Banks Industry," which aids in identifying and referencing the specific market segment covered.
12. How do I determine which pricing option suits my needs best?
The pricing options vary based on user requirements and access needs. Individual users may opt for single-user licenses, while businesses requiring broader access may choose multi-user or enterprise licenses for cost-effective access to the report.
13. Are there any additional resources or data provided in the APAC Neo Banks Industry report?
While the report offers comprehensive insights, it's advisable to review the specific contents or supplementary materials provided to ascertain if additional resources or data are available.
14. How can I stay updated on further developments or reports in the APAC Neo Banks Industry?
To stay informed about further developments, trends, and reports in the APAC Neo Banks Industry, consider subscribing to industry newsletters, following relevant companies and organizations, or regularly checking reputable industry news sources and publications.
Methodology
Step 1 - Identification of Relevant Samples Size from Population Database


Step 2 - Approaches for Defining Global Market Size (Value, Volume* & Price*)

Note*: In applicable scenarios
Step 3 - Data Sources
Primary Research
- Web Analytics
- Survey Reports
- Research Institute
- Latest Research Reports
- Opinion Leaders
Secondary Research
- Annual Reports
- White Paper
- Latest Press Release
- Industry Association
- Paid Database
- Investor Presentations

Step 4 - Data Triangulation
Involves using different sources of information in order to increase the validity of a study
These sources are likely to be stakeholders in a program - participants, other researchers, program staff, other community members, and so on.
Then we put all data in single framework & apply various statistical tools to find out the dynamic on the market.
During the analysis stage, feedback from the stakeholder groups would be compared to determine areas of agreement as well as areas of divergence