

Key Insights
The Asia-Pacific (APAC) industrial air cleaners market is experiencing robust growth, driven by increasing industrialization, stringent government regulations on air quality, and rising awareness of occupational health hazards. The market's Compound Annual Growth Rate (CAGR) exceeding 4% indicates a significant expansion trajectory projected through 2033. Key drivers include the proliferation of manufacturing facilities across countries like China, India, and South Korea, necessitating advanced air purification solutions. Furthermore, the rising prevalence of respiratory illnesses linked to poor air quality in industrial settings is fueling demand for sophisticated HEPA filtration systems and other advanced technologies. The segment dominated by stand-alone units, catering to specific needs within diverse industrial applications, is expected to maintain its leadership. However, in-duct systems are also gaining traction due to their seamless integration into existing ventilation systems. Major players like Daikin, Honeywell, and Samsung are actively investing in research and development, leading to innovative product launches and enhancing market competitiveness. The increasing adoption of IoT-enabled air quality monitoring systems within industrial spaces further contributes to market growth, providing real-time data for efficient maintenance and optimal performance.
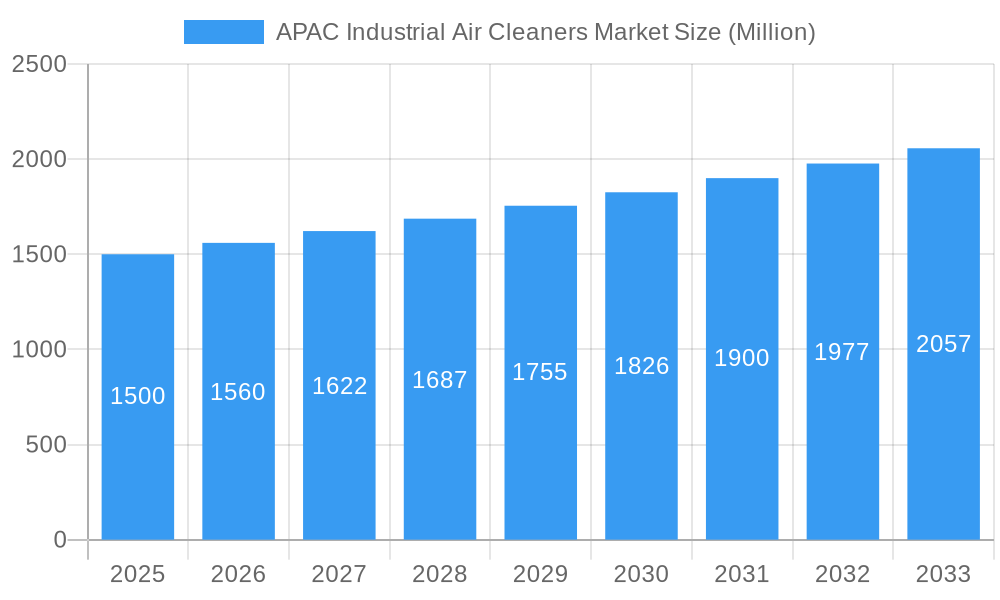
APAC Industrial Air Cleaners Market Market Size (In Billion)
Within the APAC region, China and India represent substantial market opportunities. China's massive industrial sector and its commitment to environmental regulations create a strong demand for high-capacity air cleaners. India's growing manufacturing base and infrastructure development projects are also significantly contributing to market expansion. While the market faces restraints like high initial investment costs associated with advanced filtration technologies and potential supply chain disruptions, the overall growth outlook remains positive. The increasing awareness of long-term health benefits and cost savings associated with improved air quality within industrial environments is expected to outweigh these challenges. The market is likely to witness significant technological advancements, particularly in the development of energy-efficient and sustainable air purification solutions, further stimulating growth. The focus will be on solutions that offer effective pollutant removal with reduced operational costs and minimized environmental impact.
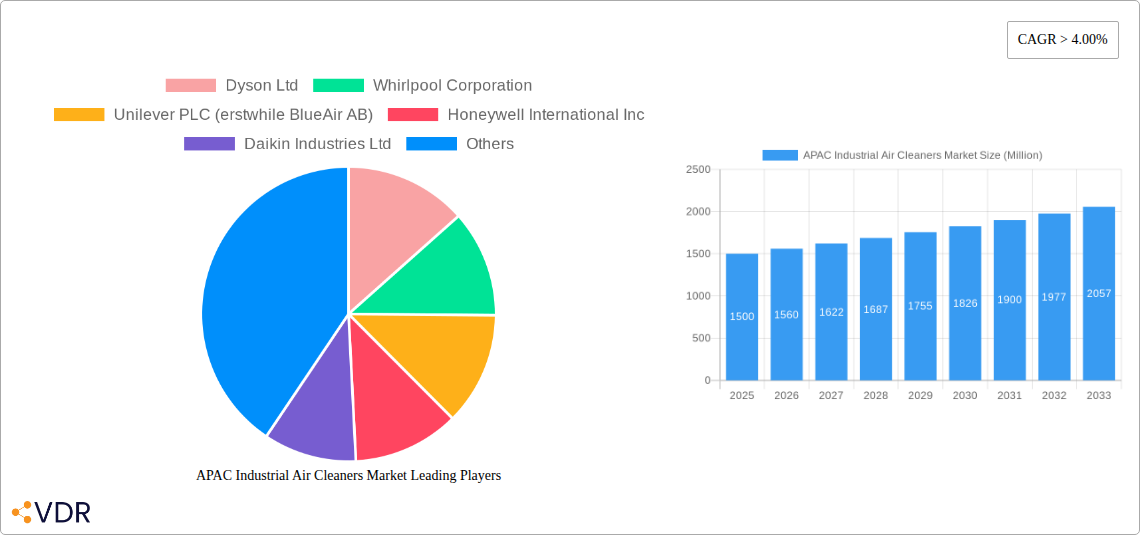
APAC Industrial Air Cleaners Market Company Market Share
APAC Industrial Air Cleaners Market: A Comprehensive Report (2019-2033)
This comprehensive report provides an in-depth analysis of the Asia-Pacific (APAC) industrial air cleaners market, encompassing market dynamics, growth trends, regional dominance, product landscapes, key players, and future outlook. The report covers the period from 2019 to 2033, with a focus on the estimated year 2025 and a forecast period of 2025-2033. This analysis is crucial for businesses operating in or planning to enter the lucrative APAC industrial air cleaner market, encompassing its parent market (Air Purification Systems) and child markets (Industrial Air Cleaners). The market size is presented in million units.
APAC Industrial Air Cleaners Market Dynamics & Structure
The APAC industrial air cleaners market is characterized by a moderately concentrated landscape with a few major players holding significant market share. However, the market is witnessing increased competition from new entrants and the expansion of existing players into new segments. The market structure is influenced by technological advancements in filtration technology, stringent environmental regulations, and the growing awareness of indoor air quality issues. Market concentration is estimated at xx% in 2025, with the top 5 players holding approximately xx% of the market share.
- Technological Innovation: Continuous innovation in HEPA filtration, UV sterilization, and other technologies drives market growth. However, high R&D costs and complexities in integrating advanced technologies pose innovation barriers.
- Regulatory Framework: Government regulations on air quality standards and emission limits in various APAC countries significantly influence market demand, particularly in industrial settings. Stringent regulations in China and India are driving growth.
- Competitive Product Substitutes: While industrial air cleaners are the primary solution, some industries explore alternative solutions like improved ventilation systems, resulting in moderate competitive pressure.
- End-User Demographics: The industrial segment, particularly manufacturing, pharmaceuticals, and healthcare, is the primary driver of market growth due to stringent hygiene standards and occupational health concerns.
- M&A Trends: The market has witnessed xx M&A deals in the past five years, primarily focused on expanding product portfolios and geographical reach. Further consolidation is anticipated in the forecast period.
APAC Industrial Air Cleaners Market Growth Trends & Insights
The APAC industrial air cleaners market is experiencing a dynamic growth trajectory, fueled by a confluence of factors. During the historical period (2019-2024), the market exhibited a Compound Annual Growth Rate (CAGR) of [Insert Actual Historical CAGR Here]%. Projections indicate a sustained upward trend, with an anticipated CAGR of [Insert Actual Forecast CAGR Here]% during the forecast period (2025-2033). This robust expansion is intrinsically linked to escalating industrialization across the region, rapid urbanization, a heightened consciousness regarding the critical importance of indoor air quality (IAQ) within industrial settings, and the implementation of increasingly stringent government regulations aimed at mitigating air pollution. Despite significant growth, market penetration in key industrial sectors remains relatively nascent, presenting substantial untapped opportunities for market players. Technological innovations, particularly the development of sophisticated smart air purifiers integrated with Internet of Things (IoT) capabilities, are acting as significant catalysts, accelerating adoption rates. Furthermore, a discernible shift in consumer and industrial behavior, prioritizing health and well-being, is acting as a powerful tailwind for market expansion. The market size is forecast to reach an impressive [Insert Actual Market Size in Million Units Here] million units by 2033.
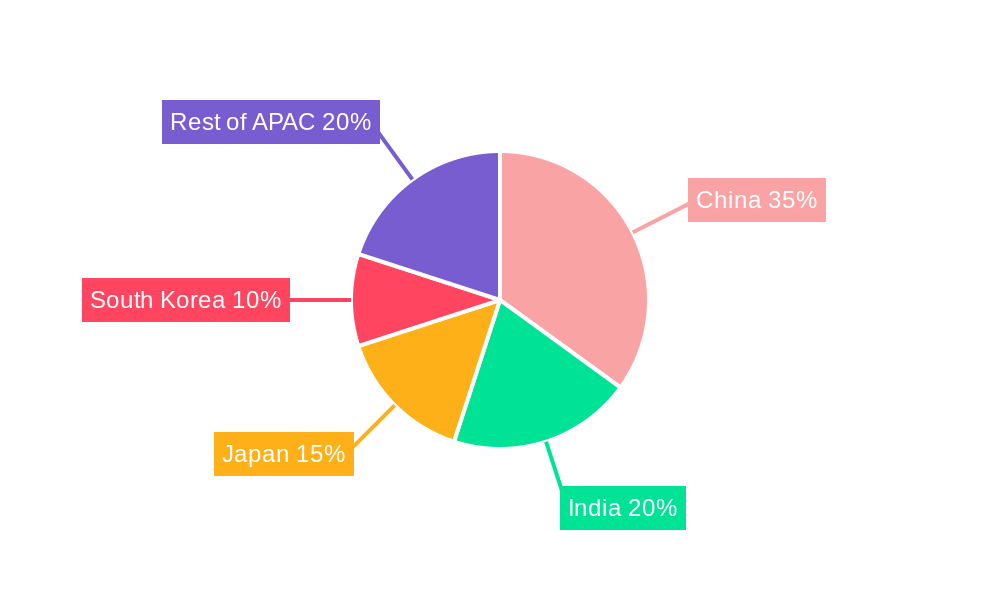
Dominant Regions, Countries, or Segments in APAC Industrial Air Cleaners Market
China and India stand out as the preeminent markets within the APAC industrial air cleaners landscape. Their dominance is largely attributed to the accelerated pace of industrialization coupled with a growing imperative to address pressing environmental concerns. Within the spectrum of filtration technologies, High-Efficiency Particulate Air (HEPA) filters command the largest market share, owing to their unparalleled efficacy in capturing fine particulate matter. From an end-user perspective, the industrial segment demonstrates the most significant growth potential, driven by the non-negotiable stringent safety and hygiene standards prevalent in these environments. Currently, stand-alone air cleaner systems represent the dominant product type. However, there is a discernible and growing traction for in-duct air purification systems, particularly within expansive industrial facilities.
- Key Drivers of Regional Dominance:
- Unprecedented industrial and urban expansion in China and India.
- The establishment and enforcement of robust government regulations mandating improved air quality standards.
- A burgeoning awareness among industrial workforces concerning the direct impact of indoor air quality on health and productivity.
- Rising disposable incomes and an escalating emphasis on personal and environmental health consciousness across the populace.
- Factors Contributing to Dominance:
- The sheer scale and diversity of the industrial base in China and India.
- Supportive governmental policies designed to foster industrial advancement while simultaneously prioritizing environmental stewardship.
- The persistent and widespread issue of air pollution in major metropolitan and industrial centers.
APAC Industrial Air Cleaners Market Product Landscape
The market offers a diverse range of industrial air cleaners, including HEPA-filtered units, units employing other technologies (e.g., activated carbon filters, UV sterilization), stand-alone and in-duct systems. Innovations focus on improving filtration efficiency, reducing energy consumption, and incorporating smart features like IoT connectivity and remote monitoring. Unique selling propositions include enhanced filtration capabilities, quiet operation, and ease of maintenance. Technological advancements in sensor technology and AI-powered controls are further shaping the product landscape.
Key Drivers, Barriers & Challenges in APAC Industrial Air Cleaners Market
Key Drivers: The APAC industrial air cleaners market is propelled by a robust set of drivers including the relentless surge in industrial activities, escalating levels of air pollution, the imposition of stringent governmental mandates on air quality, and a heightened societal awareness regarding the ramifications of poor indoor air quality. The increasing adoption of advanced filtration technologies, such as HEPA, and the seamless integration of intelligent, smart features into air purification systems are also pivotal drivers of market expansion.
Key Challenges: Despite the promising outlook, the market faces certain impediments. High initial capital investment requirements for industrial-grade air purification systems can be a significant barrier. Furthermore, the complexity of installation procedures in diverse industrial settings and the availability of adequately skilled labor for ongoing maintenance and servicing present considerable challenges. The intensely competitive market landscape, characterized by the presence of established players and the availability of cost-effective alternative solutions, also poses hurdles to sustained growth.
Emerging Opportunities in APAC Industrial Air Cleaners Market
Untapped markets in smaller industrial sectors and emerging economies within APAC present significant opportunities. The development of specialized air cleaners for specific industrial applications (e.g., food processing, pharmaceuticals) and the integration of IoT and AI technologies for predictive maintenance and optimized energy consumption are key trends. Growing consumer preference for eco-friendly and energy-efficient products also presents an opportunity.
Growth Accelerators in the APAC Industrial Air Cleaners Market Industry
The trajectory of growth within the APAC industrial air cleaners market is being significantly accelerated by continuous advancements in filtration and sensor technologies. Strategic alliances and collaborations forged between leading manufacturers and diverse industrial end-users are instrumental in fostering wider adoption. Proactive market expansion into previously underserved regions and the strategic diversification of product portfolios to cater to a wider range of industrial needs are key strategies being employed by industry participants to maintain and amplify their growth momentum. Moreover, government-backed incentives and subsidies directed towards the adoption of cleaner and more sustainable technologies are further bolstering market expansion.
Key Players Shaping the APAC Industrial Air Cleaners Market Market
- Dyson Ltd
- Whirlpool Corporation
- Unilever PLC (erstwhile BlueAir AB)
- Honeywell International Inc
- Daikin Industries Ltd
- LG Electronics Inc
- AllerAir Industries Inc
- Samsung Electronics Co Ltd
- Xiaomi Corp
- Koninklijke Philips NV
- Panasonic Corporation
- IQAir
Notable Milestones in APAC Industrial Air Cleaners Market Sector
- November 2022: Havells Studio launched the Meditate air purifier, verified by Equinox Lab for efficacy against gaseous pollutants and microorganisms.
- November 2022: Samsung launched AX46 and AX32 air purifiers in India, claiming 99.97% removal of nano-sized particles, dust, bacteria, and allergens.
In-Depth APAC Industrial Air Cleaners Market Market Outlook
The APAC industrial air cleaners market is poised for a period of sustained and significant growth. This optimistic outlook is underpinned by the ongoing industrial development across the region, a pervasive and increasing awareness of environmental issues, and the relentless pace of technological innovation. To effectively leverage emerging opportunities and navigate the competitive landscape, industry players will find it crucial to forge strategic partnerships, diversify their product offerings to meet evolving demands, and aggressively pursue expansion into untapped markets. A continued focus on energy-efficient designs, the integration of advanced smart functionalities, and the development of specialized air purification solutions tailored for specific industrial applications will undoubtedly shape the future trajectory and success of the market.
APAC Industrial Air Cleaners Market Segmentation
-
1. Filtration Technology
- 1.1. High-efficiency Particulate Air (HEPA)
- 1.2. Other Technologies
-
2. Type
- 2.1. Stand-alone
- 2.2. In-duct
-
3. End User
- 3.1. Residential
- 3.2. Commercial
- 3.3. Industrial
-
4. Geography
- 4.1. China
- 4.2. India
- 4.3. Japan
- 4.4. Rest of Asia-Pacific
APAC Industrial Air Cleaners Market Segmentation By Geography
- 1. China
- 2. India
- 3. Japan
- 4. Rest of Asia Pacific
APAC Industrial Air Cleaners Market Regional Market Share
Geographic Coverage of APAC Industrial Air Cleaners Market
APAC Industrial Air Cleaners Market REPORT HIGHLIGHTS
| Aspects | Details |
|---|---|
| Study Period | 2020-2034 |
| Base Year | 2025 |
| Estimated Year | 2026 |
| Forecast Period | 2026-2034 |
| Historical Period | 2020-2025 |
| Growth Rate | CAGR of 7.3% from 2020-2034 |
| Segmentation |
|
Table of Contents
- 1. Introduction
- 1.1. Research Scope
- 1.2. Market Segmentation
- 1.3. Research Objective
- 1.4. Definitions and Assumptions
- 2. Executive Summary
- 2.1. Market Snapshot
- 3. Market Dynamics
- 3.1. Market Drivers
- 3.2. Market Restrains
- 3.3. Market Trends
- 3.4. Market Opportunities
- 4. Market Factor Analysis
- 4.1. Porters Five Forces
- 4.1.1. Bargaining Power of Suppliers
- 4.1.2. Bargaining Power of Buyers
- 4.1.3. Threat of New Entrants
- 4.1.4. Threat of Substitutes
- 4.1.5. Competitive Rivalry
- 4.2. PESTEL analysis
- 4.3. BCG Analysis
- 4.3.1. Stars (High Growth, High Market Share)
- 4.3.2. Cash Cows (Low Growth, High Market Share)
- 4.3.3. Question Mark (High Growth, Low Market Share)
- 4.3.4. Dogs (Low Growth, Low Market Share)
- 4.4. Ansoff Matrix Analysis
- 4.5. Supply Chain Analysis
- 4.6. Regulatory Landscape
- 4.7. Current Market Potential and Opportunity Assessment (TAM–SAM–SOM Framework)
- 4.8. VDR Analyst Note
- 4.1. Porters Five Forces
- 5. Market Analysis, Insights and Forecast 2021-2033
- 5.1. Market Analysis, Insights and Forecast - by Filtration Technology
- 5.1.1. High-efficiency Particulate Air (HEPA)
- 5.1.2. Other Technologies
- 5.2. Market Analysis, Insights and Forecast - by Type
- 5.2.1. Stand-alone
- 5.2.2. In-duct
- 5.3. Market Analysis, Insights and Forecast - by End User
- 5.3.1. Residential
- 5.3.2. Commercial
- 5.3.3. Industrial
- 5.4. Market Analysis, Insights and Forecast - by Geography
- 5.4.1. China
- 5.4.2. India
- 5.4.3. Japan
- 5.4.4. Rest of Asia-Pacific
- 5.5. Market Analysis, Insights and Forecast - by Region
- 5.5.1. China
- 5.5.2. India
- 5.5.3. Japan
- 5.5.4. Rest of Asia Pacific
- 5.1. Market Analysis, Insights and Forecast - by Filtration Technology
- 6. Global APAC Industrial Air Cleaners Market Analysis, Insights and Forecast, 2021-2033
- 6.1. Market Analysis, Insights and Forecast - by Filtration Technology
- 6.1.1. High-efficiency Particulate Air (HEPA)
- 6.1.2. Other Technologies
- 6.2. Market Analysis, Insights and Forecast - by Type
- 6.2.1. Stand-alone
- 6.2.2. In-duct
- 6.3. Market Analysis, Insights and Forecast - by End User
- 6.3.1. Residential
- 6.3.2. Commercial
- 6.3.3. Industrial
- 6.4. Market Analysis, Insights and Forecast - by Geography
- 6.4.1. China
- 6.4.2. India
- 6.4.3. Japan
- 6.4.4. Rest of Asia-Pacific
- 6.1. Market Analysis, Insights and Forecast - by Filtration Technology
- 7. China APAC Industrial Air Cleaners Market Analysis, Insights and Forecast, 2021-2033
- 7.1. Market Analysis, Insights and Forecast - by Filtration Technology
- 7.1.1. High-efficiency Particulate Air (HEPA)
- 7.1.2. Other Technologies
- 7.2. Market Analysis, Insights and Forecast - by Type
- 7.2.1. Stand-alone
- 7.2.2. In-duct
- 7.3. Market Analysis, Insights and Forecast - by End User
- 7.3.1. Residential
- 7.3.2. Commercial
- 7.3.3. Industrial
- 7.4. Market Analysis, Insights and Forecast - by Geography
- 7.4.1. China
- 7.4.2. India
- 7.4.3. Japan
- 7.4.4. Rest of Asia-Pacific
- 7.1. Market Analysis, Insights and Forecast - by Filtration Technology
- 8. India APAC Industrial Air Cleaners Market Analysis, Insights and Forecast, 2021-2033
- 8.1. Market Analysis, Insights and Forecast - by Filtration Technology
- 8.1.1. High-efficiency Particulate Air (HEPA)
- 8.1.2. Other Technologies
- 8.2. Market Analysis, Insights and Forecast - by Type
- 8.2.1. Stand-alone
- 8.2.2. In-duct
- 8.3. Market Analysis, Insights and Forecast - by End User
- 8.3.1. Residential
- 8.3.2. Commercial
- 8.3.3. Industrial
- 8.4. Market Analysis, Insights and Forecast - by Geography
- 8.4.1. China
- 8.4.2. India
- 8.4.3. Japan
- 8.4.4. Rest of Asia-Pacific
- 8.1. Market Analysis, Insights and Forecast - by Filtration Technology
- 9. Japan APAC Industrial Air Cleaners Market Analysis, Insights and Forecast, 2021-2033
- 9.1. Market Analysis, Insights and Forecast - by Filtration Technology
- 9.1.1. High-efficiency Particulate Air (HEPA)
- 9.1.2. Other Technologies
- 9.2. Market Analysis, Insights and Forecast - by Type
- 9.2.1. Stand-alone
- 9.2.2. In-duct
- 9.3. Market Analysis, Insights and Forecast - by End User
- 9.3.1. Residential
- 9.3.2. Commercial
- 9.3.3. Industrial
- 9.4. Market Analysis, Insights and Forecast - by Geography
- 9.4.1. China
- 9.4.2. India
- 9.4.3. Japan
- 9.4.4. Rest of Asia-Pacific
- 9.1. Market Analysis, Insights and Forecast - by Filtration Technology
- 10. Rest of Asia Pacific APAC Industrial Air Cleaners Market Analysis, Insights and Forecast, 2021-2033
- 10.1. Market Analysis, Insights and Forecast - by Filtration Technology
- 10.1.1. High-efficiency Particulate Air (HEPA)
- 10.1.2. Other Technologies
- 10.2. Market Analysis, Insights and Forecast - by Type
- 10.2.1. Stand-alone
- 10.2.2. In-duct
- 10.3. Market Analysis, Insights and Forecast - by End User
- 10.3.1. Residential
- 10.3.2. Commercial
- 10.3.3. Industrial
- 10.4. Market Analysis, Insights and Forecast - by Geography
- 10.4.1. China
- 10.4.2. India
- 10.4.3. Japan
- 10.4.4. Rest of Asia-Pacific
- 10.1. Market Analysis, Insights and Forecast - by Filtration Technology
- 11. Competitive Analysis
- 11.1. Company Profiles
- 11.1.1 Dyson Ltd
- 11.1.1.1. Company Overview
- 11.1.1.2. Products
- 11.1.1.3. Company Financials
- 11.1.1.4. SWOT Analysis
- 11.1.2 Whirlpool Corporation
- 11.1.2.1. Company Overview
- 11.1.2.2. Products
- 11.1.2.3. Company Financials
- 11.1.2.4. SWOT Analysis
- 11.1.3 Unilever PLC (erstwhile BlueAir AB)
- 11.1.3.1. Company Overview
- 11.1.3.2. Products
- 11.1.3.3. Company Financials
- 11.1.3.4. SWOT Analysis
- 11.1.4 Honeywell International Inc
- 11.1.4.1. Company Overview
- 11.1.4.2. Products
- 11.1.4.3. Company Financials
- 11.1.4.4. SWOT Analysis
- 11.1.5 Daikin Industries Ltd
- 11.1.5.1. Company Overview
- 11.1.5.2. Products
- 11.1.5.3. Company Financials
- 11.1.5.4. SWOT Analysis
- 11.1.6 LG Electronics Inc
- 11.1.6.1. Company Overview
- 11.1.6.2. Products
- 11.1.6.3. Company Financials
- 11.1.6.4. SWOT Analysis
- 11.1.7 AllerAir Industries Inc*List Not Exhaustive
- 11.1.7.1. Company Overview
- 11.1.7.2. Products
- 11.1.7.3. Company Financials
- 11.1.7.4. SWOT Analysis
- 11.1.8 Samsung Electronics Co Ltd
- 11.1.8.1. Company Overview
- 11.1.8.2. Products
- 11.1.8.3. Company Financials
- 11.1.8.4. SWOT Analysis
- 11.1.9 Xiaomi Corp
- 11.1.9.1. Company Overview
- 11.1.9.2. Products
- 11.1.9.3. Company Financials
- 11.1.9.4. SWOT Analysis
- 11.1.10 Koninklijke Philips NV
- 11.1.10.1. Company Overview
- 11.1.10.2. Products
- 11.1.10.3. Company Financials
- 11.1.10.4. SWOT Analysis
- 11.1.11 Panasonic Corporation
- 11.1.11.1. Company Overview
- 11.1.11.2. Products
- 11.1.11.3. Company Financials
- 11.1.11.4. SWOT Analysis
- 11.1.12 IQAir
- 11.1.12.1. Company Overview
- 11.1.12.2. Products
- 11.1.12.3. Company Financials
- 11.1.12.4. SWOT Analysis
- 11.1.1 Dyson Ltd
- 11.2. Market Entropy
- 11.2.1 Company's Key Areas Served
- 11.2.2 Recent Developments
- 11.3. Company Market Share Analysis 2025
- 11.3.1 Top 5 Companies Market Share Analysis
- 11.3.2 Top 3 Companies Market Share Analysis
- 11.4. List of Potential Customers
- 12. Research Methodology
List of Figures
- Figure 1: Global APAC Industrial Air Cleaners Market Revenue Breakdown (million, %) by Region 2025 & 2033
- Figure 2: Global APAC Industrial Air Cleaners Market Volume Breakdown (K Unit, %) by Region 2025 & 2033
- Figure 3: China APAC Industrial Air Cleaners Market Revenue (million), by Filtration Technology 2025 & 2033
- Figure 4: China APAC Industrial Air Cleaners Market Volume (K Unit), by Filtration Technology 2025 & 2033
- Figure 5: China APAC Industrial Air Cleaners Market Revenue Share (%), by Filtration Technology 2025 & 2033
- Figure 6: China APAC Industrial Air Cleaners Market Volume Share (%), by Filtration Technology 2025 & 2033
- Figure 7: China APAC Industrial Air Cleaners Market Revenue (million), by Type 2025 & 2033
- Figure 8: China APAC Industrial Air Cleaners Market Volume (K Unit), by Type 2025 & 2033
- Figure 9: China APAC Industrial Air Cleaners Market Revenue Share (%), by Type 2025 & 2033
- Figure 10: China APAC Industrial Air Cleaners Market Volume Share (%), by Type 2025 & 2033
- Figure 11: China APAC Industrial Air Cleaners Market Revenue (million), by End User 2025 & 2033
- Figure 12: China APAC Industrial Air Cleaners Market Volume (K Unit), by End User 2025 & 2033
- Figure 13: China APAC Industrial Air Cleaners Market Revenue Share (%), by End User 2025 & 2033
- Figure 14: China APAC Industrial Air Cleaners Market Volume Share (%), by End User 2025 & 2033
- Figure 15: China APAC Industrial Air Cleaners Market Revenue (million), by Geography 2025 & 2033
- Figure 16: China APAC Industrial Air Cleaners Market Volume (K Unit), by Geography 2025 & 2033
- Figure 17: China APAC Industrial Air Cleaners Market Revenue Share (%), by Geography 2025 & 2033
- Figure 18: China APAC Industrial Air Cleaners Market Volume Share (%), by Geography 2025 & 2033
- Figure 19: China APAC Industrial Air Cleaners Market Revenue (million), by Country 2025 & 2033
- Figure 20: China APAC Industrial Air Cleaners Market Volume (K Unit), by Country 2025 & 2033
- Figure 21: China APAC Industrial Air Cleaners Market Revenue Share (%), by Country 2025 & 2033
- Figure 22: China APAC Industrial Air Cleaners Market Volume Share (%), by Country 2025 & 2033
- Figure 23: India APAC Industrial Air Cleaners Market Revenue (million), by Filtration Technology 2025 & 2033
- Figure 24: India APAC Industrial Air Cleaners Market Volume (K Unit), by Filtration Technology 2025 & 2033
- Figure 25: India APAC Industrial Air Cleaners Market Revenue Share (%), by Filtration Technology 2025 & 2033
- Figure 26: India APAC Industrial Air Cleaners Market Volume Share (%), by Filtration Technology 2025 & 2033
- Figure 27: India APAC Industrial Air Cleaners Market Revenue (million), by Type 2025 & 2033
- Figure 28: India APAC Industrial Air Cleaners Market Volume (K Unit), by Type 2025 & 2033
- Figure 29: India APAC Industrial Air Cleaners Market Revenue Share (%), by Type 2025 & 2033
- Figure 30: India APAC Industrial Air Cleaners Market Volume Share (%), by Type 2025 & 2033
- Figure 31: India APAC Industrial Air Cleaners Market Revenue (million), by End User 2025 & 2033
- Figure 32: India APAC Industrial Air Cleaners Market Volume (K Unit), by End User 2025 & 2033
- Figure 33: India APAC Industrial Air Cleaners Market Revenue Share (%), by End User 2025 & 2033
- Figure 34: India APAC Industrial Air Cleaners Market Volume Share (%), by End User 2025 & 2033
- Figure 35: India APAC Industrial Air Cleaners Market Revenue (million), by Geography 2025 & 2033
- Figure 36: India APAC Industrial Air Cleaners Market Volume (K Unit), by Geography 2025 & 2033
- Figure 37: India APAC Industrial Air Cleaners Market Revenue Share (%), by Geography 2025 & 2033
- Figure 38: India APAC Industrial Air Cleaners Market Volume Share (%), by Geography 2025 & 2033
- Figure 39: India APAC Industrial Air Cleaners Market Revenue (million), by Country 2025 & 2033
- Figure 40: India APAC Industrial Air Cleaners Market Volume (K Unit), by Country 2025 & 2033
- Figure 41: India APAC Industrial Air Cleaners Market Revenue Share (%), by Country 2025 & 2033
- Figure 42: India APAC Industrial Air Cleaners Market Volume Share (%), by Country 2025 & 2033
- Figure 43: Japan APAC Industrial Air Cleaners Market Revenue (million), by Filtration Technology 2025 & 2033
- Figure 44: Japan APAC Industrial Air Cleaners Market Volume (K Unit), by Filtration Technology 2025 & 2033
- Figure 45: Japan APAC Industrial Air Cleaners Market Revenue Share (%), by Filtration Technology 2025 & 2033
- Figure 46: Japan APAC Industrial Air Cleaners Market Volume Share (%), by Filtration Technology 2025 & 2033
- Figure 47: Japan APAC Industrial Air Cleaners Market Revenue (million), by Type 2025 & 2033
- Figure 48: Japan APAC Industrial Air Cleaners Market Volume (K Unit), by Type 2025 & 2033
- Figure 49: Japan APAC Industrial Air Cleaners Market Revenue Share (%), by Type 2025 & 2033
- Figure 50: Japan APAC Industrial Air Cleaners Market Volume Share (%), by Type 2025 & 2033
- Figure 51: Japan APAC Industrial Air Cleaners Market Revenue (million), by End User 2025 & 2033
- Figure 52: Japan APAC Industrial Air Cleaners Market Volume (K Unit), by End User 2025 & 2033
- Figure 53: Japan APAC Industrial Air Cleaners Market Revenue Share (%), by End User 2025 & 2033
- Figure 54: Japan APAC Industrial Air Cleaners Market Volume Share (%), by End User 2025 & 2033
- Figure 55: Japan APAC Industrial Air Cleaners Market Revenue (million), by Geography 2025 & 2033
- Figure 56: Japan APAC Industrial Air Cleaners Market Volume (K Unit), by Geography 2025 & 2033
- Figure 57: Japan APAC Industrial Air Cleaners Market Revenue Share (%), by Geography 2025 & 2033
- Figure 58: Japan APAC Industrial Air Cleaners Market Volume Share (%), by Geography 2025 & 2033
- Figure 59: Japan APAC Industrial Air Cleaners Market Revenue (million), by Country 2025 & 2033
- Figure 60: Japan APAC Industrial Air Cleaners Market Volume (K Unit), by Country 2025 & 2033
- Figure 61: Japan APAC Industrial Air Cleaners Market Revenue Share (%), by Country 2025 & 2033
- Figure 62: Japan APAC Industrial Air Cleaners Market Volume Share (%), by Country 2025 & 2033
- Figure 63: Rest of Asia Pacific APAC Industrial Air Cleaners Market Revenue (million), by Filtration Technology 2025 & 2033
- Figure 64: Rest of Asia Pacific APAC Industrial Air Cleaners Market Volume (K Unit), by Filtration Technology 2025 & 2033
- Figure 65: Rest of Asia Pacific APAC Industrial Air Cleaners Market Revenue Share (%), by Filtration Technology 2025 & 2033
- Figure 66: Rest of Asia Pacific APAC Industrial Air Cleaners Market Volume Share (%), by Filtration Technology 2025 & 2033
- Figure 67: Rest of Asia Pacific APAC Industrial Air Cleaners Market Revenue (million), by Type 2025 & 2033
- Figure 68: Rest of Asia Pacific APAC Industrial Air Cleaners Market Volume (K Unit), by Type 2025 & 2033
- Figure 69: Rest of Asia Pacific APAC Industrial Air Cleaners Market Revenue Share (%), by Type 2025 & 2033
- Figure 70: Rest of Asia Pacific APAC Industrial Air Cleaners Market Volume Share (%), by Type 2025 & 2033
- Figure 71: Rest of Asia Pacific APAC Industrial Air Cleaners Market Revenue (million), by End User 2025 & 2033
- Figure 72: Rest of Asia Pacific APAC Industrial Air Cleaners Market Volume (K Unit), by End User 2025 & 2033
- Figure 73: Rest of Asia Pacific APAC Industrial Air Cleaners Market Revenue Share (%), by End User 2025 & 2033
- Figure 74: Rest of Asia Pacific APAC Industrial Air Cleaners Market Volume Share (%), by End User 2025 & 2033
- Figure 75: Rest of Asia Pacific APAC Industrial Air Cleaners Market Revenue (million), by Geography 2025 & 2033
- Figure 76: Rest of Asia Pacific APAC Industrial Air Cleaners Market Volume (K Unit), by Geography 2025 & 2033
- Figure 77: Rest of Asia Pacific APAC Industrial Air Cleaners Market Revenue Share (%), by Geography 2025 & 2033
- Figure 78: Rest of Asia Pacific APAC Industrial Air Cleaners Market Volume Share (%), by Geography 2025 & 2033
- Figure 79: Rest of Asia Pacific APAC Industrial Air Cleaners Market Revenue (million), by Country 2025 & 2033
- Figure 80: Rest of Asia Pacific APAC Industrial Air Cleaners Market Volume (K Unit), by Country 2025 & 2033
- Figure 81: Rest of Asia Pacific APAC Industrial Air Cleaners Market Revenue Share (%), by Country 2025 & 2033
- Figure 82: Rest of Asia Pacific APAC Industrial Air Cleaners Market Volume Share (%), by Country 2025 & 2033
List of Tables
- Table 1: Global APAC Industrial Air Cleaners Market Revenue million Forecast, by Filtration Technology 2020 & 2033
- Table 2: Global APAC Industrial Air Cleaners Market Volume K Unit Forecast, by Filtration Technology 2020 & 2033
- Table 3: Global APAC Industrial Air Cleaners Market Revenue million Forecast, by Type 2020 & 2033
- Table 4: Global APAC Industrial Air Cleaners Market Volume K Unit Forecast, by Type 2020 & 2033
- Table 5: Global APAC Industrial Air Cleaners Market Revenue million Forecast, by End User 2020 & 2033
- Table 6: Global APAC Industrial Air Cleaners Market Volume K Unit Forecast, by End User 2020 & 2033
- Table 7: Global APAC Industrial Air Cleaners Market Revenue million Forecast, by Geography 2020 & 2033
- Table 8: Global APAC Industrial Air Cleaners Market Volume K Unit Forecast, by Geography 2020 & 2033
- Table 9: Global APAC Industrial Air Cleaners Market Revenue million Forecast, by Region 2020 & 2033
- Table 10: Global APAC Industrial Air Cleaners Market Volume K Unit Forecast, by Region 2020 & 2033
- Table 11: Global APAC Industrial Air Cleaners Market Revenue million Forecast, by Filtration Technology 2020 & 2033
- Table 12: Global APAC Industrial Air Cleaners Market Volume K Unit Forecast, by Filtration Technology 2020 & 2033
- Table 13: Global APAC Industrial Air Cleaners Market Revenue million Forecast, by Type 2020 & 2033
- Table 14: Global APAC Industrial Air Cleaners Market Volume K Unit Forecast, by Type 2020 & 2033
- Table 15: Global APAC Industrial Air Cleaners Market Revenue million Forecast, by End User 2020 & 2033
- Table 16: Global APAC Industrial Air Cleaners Market Volume K Unit Forecast, by End User 2020 & 2033
- Table 17: Global APAC Industrial Air Cleaners Market Revenue million Forecast, by Geography 2020 & 2033
- Table 18: Global APAC Industrial Air Cleaners Market Volume K Unit Forecast, by Geography 2020 & 2033
- Table 19: Global APAC Industrial Air Cleaners Market Revenue million Forecast, by Country 2020 & 2033
- Table 20: Global APAC Industrial Air Cleaners Market Volume K Unit Forecast, by Country 2020 & 2033
- Table 21: Global APAC Industrial Air Cleaners Market Revenue million Forecast, by Filtration Technology 2020 & 2033
- Table 22: Global APAC Industrial Air Cleaners Market Volume K Unit Forecast, by Filtration Technology 2020 & 2033
- Table 23: Global APAC Industrial Air Cleaners Market Revenue million Forecast, by Type 2020 & 2033
- Table 24: Global APAC Industrial Air Cleaners Market Volume K Unit Forecast, by Type 2020 & 2033
- Table 25: Global APAC Industrial Air Cleaners Market Revenue million Forecast, by End User 2020 & 2033
- Table 26: Global APAC Industrial Air Cleaners Market Volume K Unit Forecast, by End User 2020 & 2033
- Table 27: Global APAC Industrial Air Cleaners Market Revenue million Forecast, by Geography 2020 & 2033
- Table 28: Global APAC Industrial Air Cleaners Market Volume K Unit Forecast, by Geography 2020 & 2033
- Table 29: Global APAC Industrial Air Cleaners Market Revenue million Forecast, by Country 2020 & 2033
- Table 30: Global APAC Industrial Air Cleaners Market Volume K Unit Forecast, by Country 2020 & 2033
- Table 31: Global APAC Industrial Air Cleaners Market Revenue million Forecast, by Filtration Technology 2020 & 2033
- Table 32: Global APAC Industrial Air Cleaners Market Volume K Unit Forecast, by Filtration Technology 2020 & 2033
- Table 33: Global APAC Industrial Air Cleaners Market Revenue million Forecast, by Type 2020 & 2033
- Table 34: Global APAC Industrial Air Cleaners Market Volume K Unit Forecast, by Type 2020 & 2033
- Table 35: Global APAC Industrial Air Cleaners Market Revenue million Forecast, by End User 2020 & 2033
- Table 36: Global APAC Industrial Air Cleaners Market Volume K Unit Forecast, by End User 2020 & 2033
- Table 37: Global APAC Industrial Air Cleaners Market Revenue million Forecast, by Geography 2020 & 2033
- Table 38: Global APAC Industrial Air Cleaners Market Volume K Unit Forecast, by Geography 2020 & 2033
- Table 39: Global APAC Industrial Air Cleaners Market Revenue million Forecast, by Country 2020 & 2033
- Table 40: Global APAC Industrial Air Cleaners Market Volume K Unit Forecast, by Country 2020 & 2033
- Table 41: Global APAC Industrial Air Cleaners Market Revenue million Forecast, by Filtration Technology 2020 & 2033
- Table 42: Global APAC Industrial Air Cleaners Market Volume K Unit Forecast, by Filtration Technology 2020 & 2033
- Table 43: Global APAC Industrial Air Cleaners Market Revenue million Forecast, by Type 2020 & 2033
- Table 44: Global APAC Industrial Air Cleaners Market Volume K Unit Forecast, by Type 2020 & 2033
- Table 45: Global APAC Industrial Air Cleaners Market Revenue million Forecast, by End User 2020 & 2033
- Table 46: Global APAC Industrial Air Cleaners Market Volume K Unit Forecast, by End User 2020 & 2033
- Table 47: Global APAC Industrial Air Cleaners Market Revenue million Forecast, by Geography 2020 & 2033
- Table 48: Global APAC Industrial Air Cleaners Market Volume K Unit Forecast, by Geography 2020 & 2033
- Table 49: Global APAC Industrial Air Cleaners Market Revenue million Forecast, by Country 2020 & 2033
- Table 50: Global APAC Industrial Air Cleaners Market Volume K Unit Forecast, by Country 2020 & 2033
Frequently Asked Questions
1. What is the projected Compound Annual Growth Rate (CAGR) of the APAC Industrial Air Cleaners Market?
The projected CAGR is approximately 7.3%.
2. Which companies are prominent players in the APAC Industrial Air Cleaners Market?
Key companies in the market include Dyson Ltd, Whirlpool Corporation, Unilever PLC (erstwhile BlueAir AB), Honeywell International Inc, Daikin Industries Ltd, LG Electronics Inc, AllerAir Industries Inc*List Not Exhaustive, Samsung Electronics Co Ltd, Xiaomi Corp, Koninklijke Philips NV, Panasonic Corporation, IQAir.
3. What are the main segments of the APAC Industrial Air Cleaners Market?
The market segments include Filtration Technology, Type, End User, Geography.
4. Can you provide details about the market size?
The market size is estimated to be USD 6689.8 million as of 2022.
5. What are some drivers contributing to market growth?
4.; Increasing Number of Automobiles4.; The Government Policy Regarding Pollution Emission Control Parameters.
6. What are the notable trends driving market growth?
Residential Segment Expected to Dominate the Market.
7. Are there any restraints impacting market growth?
4.; The Technological Limitations of Air Filters.
8. Can you provide examples of recent developments in the market?
November 2022: Havells Studio launched a new product, the Meditate air purifier. The company said the air purifier is tested and verified by Equinox Lab for efficacy against the removal of hazardous gaseous pollutants as well as microorganisms like bacteria, viruses, and fungal strains.
9. What pricing options are available for accessing the report?
Pricing options include single-user, multi-user, and enterprise licenses priced at USD 4750, USD 5250, and USD 8750 respectively.
10. Is the market size provided in terms of value or volume?
The market size is provided in terms of value, measured in million and volume, measured in K Unit.
11. Are there any specific market keywords associated with the report?
Yes, the market keyword associated with the report is "APAC Industrial Air Cleaners Market," which aids in identifying and referencing the specific market segment covered.
12. How do I determine which pricing option suits my needs best?
The pricing options vary based on user requirements and access needs. Individual users may opt for single-user licenses, while businesses requiring broader access may choose multi-user or enterprise licenses for cost-effective access to the report.
13. Are there any additional resources or data provided in the APAC Industrial Air Cleaners Market report?
While the report offers comprehensive insights, it's advisable to review the specific contents or supplementary materials provided to ascertain if additional resources or data are available.
14. How can I stay updated on further developments or reports in the APAC Industrial Air Cleaners Market?
To stay informed about further developments, trends, and reports in the APAC Industrial Air Cleaners Market, consider subscribing to industry newsletters, following relevant companies and organizations, or regularly checking reputable industry news sources and publications.
Methodology
Step 1 - Identification of Relevant Samples Size from Population Database


Step 2 - Approaches for Defining Global Market Size (Value, Volume* & Price*)

Note*: In applicable scenarios
Step 3 - Data Sources
Primary Research
- Web Analytics
- Survey Reports
- Research Institute
- Latest Research Reports
- Opinion Leaders
Secondary Research
- Annual Reports
- White Paper
- Latest Press Release
- Industry Association
- Paid Database
- Investor Presentations

Step 4 - Data Triangulation
Involves using different sources of information in order to increase the validity of a study
These sources are likely to be stakeholders in a program - participants, other researchers, program staff, other community members, and so on.
Then we put all data in single framework & apply various statistical tools to find out the dynamic on the market.
During the analysis stage, feedback from the stakeholder groups would be compared to determine areas of agreement as well as areas of divergence