

Key Insights
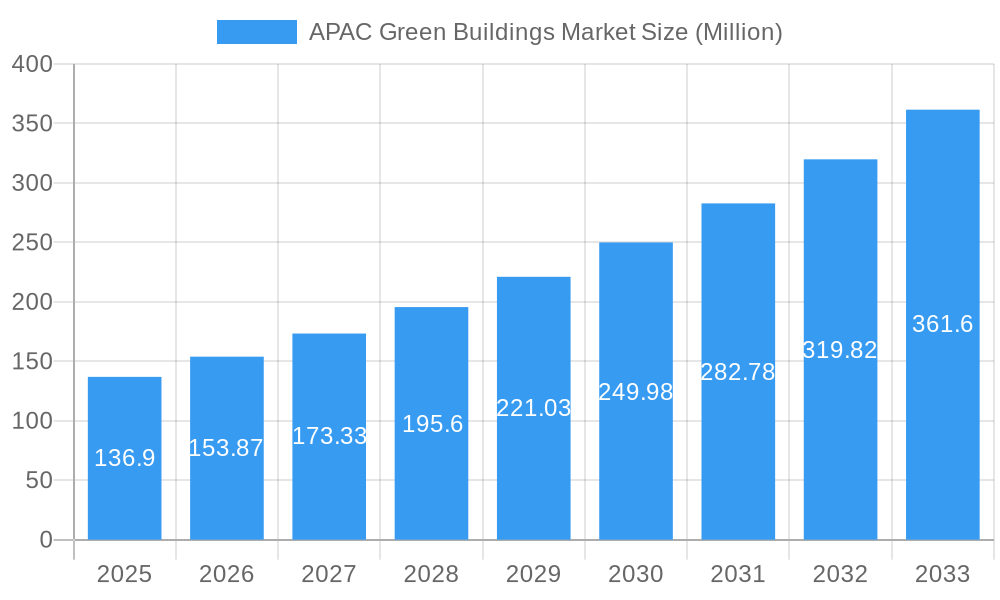
The APAC green building market, valued at $136.90 million in 2025, is experiencing robust growth, projected to expand at a Compound Annual Growth Rate (CAGR) of 12.23% from 2025 to 2033. This surge is driven by several key factors. Increasing government regulations promoting sustainable construction practices across China, Japan, India, Australia, and South Korea are creating significant demand. Furthermore, rising awareness among consumers and businesses regarding environmental sustainability and the long-term cost savings associated with green buildings are fueling market expansion. The increasing adoption of energy-efficient technologies, such as solar panels and building management systems, within both residential and commercial sectors is also a major contributor. Strong growth is anticipated in the exterior and interior product segments, particularly driven by demand for eco-friendly materials and innovative construction techniques. While initial investment costs for green building projects might be higher, the long-term benefits, including reduced operational costs and improved property values, are proving increasingly attractive to developers and investors.
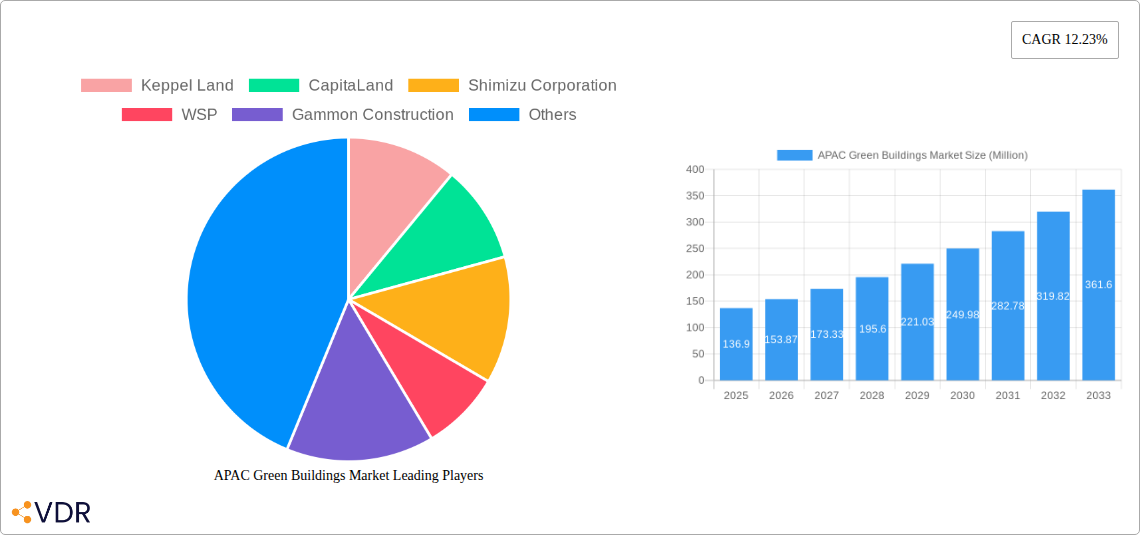
APAC Green Buildings Market Market Size (In Million)
The market segmentation reveals diverse opportunities. The residential sector is expected to dominate, followed by the office and retail segments. Key players like Keppel Land, CapitaLand, Shimizu Corporation, and others are driving innovation and market penetration through strategic partnerships, technological advancements, and the development of sustainable building solutions. While challenges such as high upfront investment costs and a lack of skilled labor in certain regions remain, the overall market outlook remains positive, underpinned by supportive government policies, technological advancements, and growing environmental consciousness within the APAC region. Future growth will likely see a more balanced distribution across the various end-user segments as green building standards become increasingly mainstream and accessible. The "Other Products" segment, encompassing building systems and solar systems, is projected to witness significant growth fueled by the increasing integration of smart technologies and renewable energy sources.
APAC Green Buildings Market Company Market Share
APAC Green Buildings Market: A Comprehensive Report (2019-2033)
This in-depth report provides a comprehensive analysis of the Asia-Pacific (APAC) green buildings market, encompassing market dynamics, growth trends, regional dominance, product landscape, key players, and future outlook. The study period covers 2019-2033, with a base year of 2025 and a forecast period of 2025-2033. The report is invaluable for industry professionals, investors, and policymakers seeking to understand and capitalize on the booming green building sector in the dynamic APAC region. The market is segmented by product (Exterior Products, Interior Products, Other Products – including Building Systems and Solar Systems) and end-user (Residential, Office, Retail, Institutional, and Other End Users). The total market size is projected to reach xx Million by 2033.
APAC Green Buildings Market Dynamics & Structure
The APAC green buildings market is characterized by increasing market concentration, driven by large multinational companies and local players. Technological innovation, particularly in sustainable materials and energy-efficient systems, is a key driver. Stringent government regulations promoting green building practices further fuel market growth. While traditional building materials face substitution pressure from eco-friendly alternatives, the market witnesses significant mergers and acquisitions (M&A) activity consolidating market share.
- Market Concentration: The market exhibits a moderately concentrated structure, with major players holding significant shares. The top 10 companies account for approximately xx% of the market share in 2025.
- Technological Innovation: Continuous advancements in green building technologies, such as Building Information Modeling (BIM) and smart building solutions, are accelerating adoption. However, high initial investment costs and lack of skilled workforce remain barriers to innovation.
- Regulatory Framework: Governments across APAC are implementing stricter environmental regulations and incentives, promoting the construction of green buildings. Carbon emission reduction targets are influencing building codes and standards, impacting market growth positively.
- Competitive Product Substitutes: Eco-friendly materials like bamboo, recycled steel, and sustainable timber are emerging as substitutes for conventional construction materials, impacting the traditional building materials market.
- End-User Demographics: Growing urbanization and rising middle-class incomes are driving demand for sustainable and energy-efficient housing and commercial spaces in major APAC cities.
- M&A Trends: The APAC green building sector is experiencing a significant increase in M&A activity, with strategic acquisitions driving consolidation and expansion within the industry. The number of M&A deals is projected to reach xx in 2025.
APAC Green Buildings Market Growth Trends & Insights
The APAC green buildings market is experiencing robust growth, driven by increasing environmental awareness, supportive government policies, and technological advancements. The market size expanded from xx Million in 2019 to xx Million in 2024, exhibiting a Compound Annual Growth Rate (CAGR) of xx% during the historical period. The market is expected to maintain a strong growth trajectory, reaching xx Million by 2033, with a projected CAGR of xx% during the forecast period. This growth is fueled by rising adoption rates of green building certifications, growing demand for sustainable building materials, and technological disruptions leading to cost-effective solutions. Consumer behavior is shifting towards environmentally conscious choices, impacting the demand for green buildings positively. Market penetration of green building practices is projected to increase from xx% in 2025 to xx% by 2033.
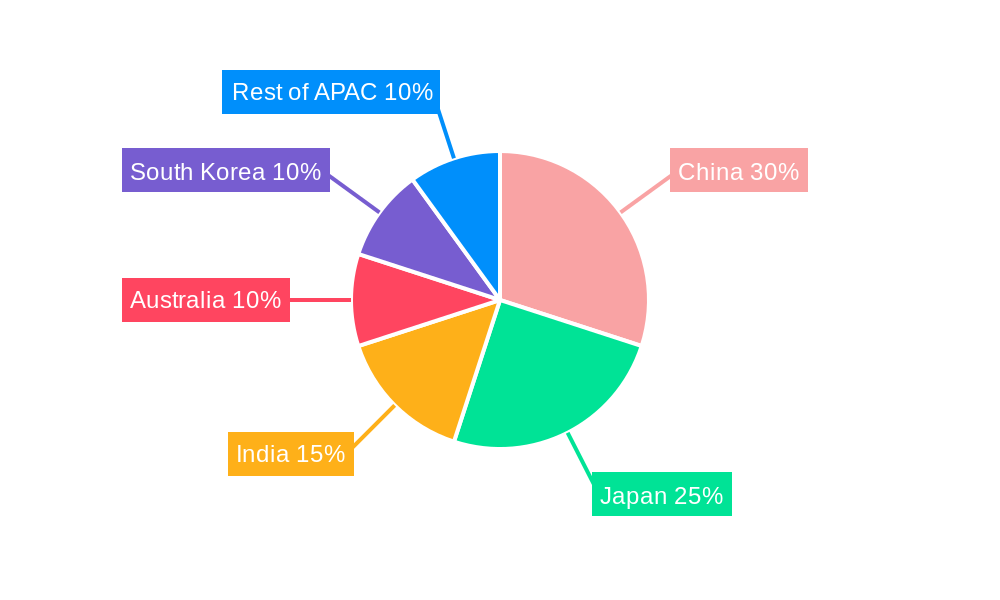
Dominant Regions, Countries, or Segments in APAC Green Buildings Market
China, Singapore, and Australia are leading the APAC green buildings market, driven by robust economic growth, supportive government policies, and significant investments in infrastructure development. The residential segment is currently the largest end-user segment but the office and institutional segments are witnessing rapid growth. Among product segments, the exterior products segment holds a considerable market share due to high demand for energy-efficient building envelopes.
- China: Government initiatives such as the "Green Building Action Plan" are driving significant growth in the Chinese green building sector. Strong economic growth and urbanization create a huge demand for sustainable infrastructure.
- Singapore: Singapore’s proactive green building policies and strong commitment to sustainability have positioned it as a regional leader in green building adoption.
- Australia: Stringent environmental regulations and growing awareness of climate change are driving the growth of the green building sector in Australia.
- Residential Segment: High demand for energy-efficient and environmentally friendly housing is driving growth in this segment.
- Office Segment: Corporates are increasingly adopting green building standards to enhance brand image and reduce operational costs.
- Exterior Products: Growing demand for energy-efficient building envelopes drives growth in this product segment.
APAC Green Buildings Market Product Landscape
The APAC green building market showcases a diverse product landscape, encompassing innovative materials, energy-efficient systems, and smart building technologies. Advancements in sustainable building materials, such as recycled concrete and bamboo composites, offer superior performance and reduced environmental impact compared to traditional counterparts. Solar panels and other renewable energy systems are increasingly integrated into building designs, reducing reliance on fossil fuels. Smart building technologies enhance energy efficiency and optimize building performance. Unique selling propositions focus on reducing carbon footprint, lowering operational costs, and improving occupant well-being.
Key Drivers, Barriers & Challenges in APAC Green Buildings Market
Key Drivers:
- Stringent environmental regulations and government incentives.
- Growing awareness of climate change and sustainability among consumers and businesses.
- Technological advancements in green building materials and technologies.
Challenges:
- High upfront costs associated with green building construction.
- Shortage of skilled labor and expertise in green building technologies.
- Supply chain disruptions affecting the availability of sustainable materials. This led to a xx% increase in material costs in 2024.
Emerging Opportunities in APAP Green Buildings Market
- Untapped potential in smaller cities and rural areas with government support.
- Growing demand for green retrofitting and renovation projects in existing buildings.
- Integration of advanced building automation systems and IoT technologies for enhanced energy efficiency.
Growth Accelerators in the APAC Green Buildings Market Industry
Strategic partnerships between technology providers, construction companies, and real estate developers are driving growth. Technological breakthroughs, such as the development of cost-effective and high-performance green building materials, are accelerating adoption rates. Expansion into new markets and product diversification are also contributing to market expansion.
Key Players Shaping the APAC Green Buildings Market Market
- Keppel Land
- CapitaLand
- Shimizu Corporation
- WSP
- Gammon Construction
- Obayashi Corporation
- Sun Hung Kai Properties
- Lendlease
- Swire Properties
- Sino Group
- 73 Other Companies
Notable Milestones in APAC Green Buildings Market Sector
- April 2023: Starbucks unveils its first greener stores in Asia-Pacific, signifying growing corporate commitment to sustainability and driving demand for green building solutions.
- February 2023: GHD's partnership with the GBCA strengthens industry collaboration and supports the adoption of circular economy principles in the green building sector.
In-Depth APAC Green Buildings Market Market Outlook
The APAC green buildings market is poised for sustained growth, driven by ongoing technological innovation, supportive government policies, and increasing environmental awareness. Strategic partnerships and market expansion initiatives will further fuel market expansion. The market presents lucrative opportunities for companies involved in sustainable building materials, energy-efficient technologies, and green building services. The potential for growth is significant, particularly in emerging markets and with the increasing demand for green retrofitting solutions.
APAC Green Buildings Market Segmentation
-
1. Product
- 1.1. Exterior Products
- 1.2. Interior products
- 1.3. Other Pr
-
2. End User
- 2.1. Residential
- 2.2. Office
- 2.3. Retail
- 2.4. Institutional
- 2.5. Other End Users
-
3. Geography
- 3.1. China
- 3.2. Japan
- 3.3. India
- 3.4. Australia
- 3.5. South Korea
- 3.6. Rest of APAC
APAC Green Buildings Market Segmentation By Geography
- 1. China
- 2. Japan
- 3. India
- 4. Australia
- 5. South Korea
- 6. Rest of APAC
APAC Green Buildings Market Regional Market Share
Geographic Coverage of APAC Green Buildings Market
APAC Green Buildings Market REPORT HIGHLIGHTS
| Aspects | Details |
|---|---|
| Study Period | 2020-2034 |
| Base Year | 2025 |
| Estimated Year | 2026 |
| Forecast Period | 2026-2034 |
| Historical Period | 2020-2025 |
| Growth Rate | CAGR of 12.23% from 2020-2034 |
| Segmentation |
|
Table of Contents
- 1. Introduction
- 1.1. Research Scope
- 1.2. Market Segmentation
- 1.3. Research Objective
- 1.4. Definitions and Assumptions
- 2. Executive Summary
- 2.1. Market Snapshot
- 3. Market Dynamics
- 3.1. Market Drivers
- 3.2. Market Restrains
- 3.3. Market Trends
- 3.4. Market Opportunities
- 4. Market Factor Analysis
- 4.1. Porters Five Forces
- 4.1.1. Bargaining Power of Suppliers
- 4.1.2. Bargaining Power of Buyers
- 4.1.3. Threat of New Entrants
- 4.1.4. Threat of Substitutes
- 4.1.5. Competitive Rivalry
- 4.2. PESTEL analysis
- 4.3. BCG Analysis
- 4.3.1. Stars (High Growth, High Market Share)
- 4.3.2. Cash Cows (Low Growth, High Market Share)
- 4.3.3. Question Mark (High Growth, Low Market Share)
- 4.3.4. Dogs (Low Growth, Low Market Share)
- 4.4. Ansoff Matrix Analysis
- 4.5. Supply Chain Analysis
- 4.6. Regulatory Landscape
- 4.7. Current Market Potential and Opportunity Assessment (TAM–SAM–SOM Framework)
- 4.8. VDR Analyst Note
- 4.1. Porters Five Forces
- 5. Market Analysis, Insights and Forecast 2021-2033
- 5.1. Market Analysis, Insights and Forecast - by Product
- 5.1.1. Exterior Products
- 5.1.2. Interior products
- 5.1.3. Other Pr
- 5.2. Market Analysis, Insights and Forecast - by End User
- 5.2.1. Residential
- 5.2.2. Office
- 5.2.3. Retail
- 5.2.4. Institutional
- 5.2.5. Other End Users
- 5.3. Market Analysis, Insights and Forecast - by Geography
- 5.3.1. China
- 5.3.2. Japan
- 5.3.3. India
- 5.3.4. Australia
- 5.3.5. South Korea
- 5.3.6. Rest of APAC
- 5.4. Market Analysis, Insights and Forecast - by Region
- 5.4.1. China
- 5.4.2. Japan
- 5.4.3. India
- 5.4.4. Australia
- 5.4.5. South Korea
- 5.4.6. Rest of APAC
- 5.1. Market Analysis, Insights and Forecast - by Product
- 6. Global APAC Green Buildings Market Analysis, Insights and Forecast, 2021-2033
- 6.1. Market Analysis, Insights and Forecast - by Product
- 6.1.1. Exterior Products
- 6.1.2. Interior products
- 6.1.3. Other Pr
- 6.2. Market Analysis, Insights and Forecast - by End User
- 6.2.1. Residential
- 6.2.2. Office
- 6.2.3. Retail
- 6.2.4. Institutional
- 6.2.5. Other End Users
- 6.3. Market Analysis, Insights and Forecast - by Geography
- 6.3.1. China
- 6.3.2. Japan
- 6.3.3. India
- 6.3.4. Australia
- 6.3.5. South Korea
- 6.3.6. Rest of APAC
- 6.1. Market Analysis, Insights and Forecast - by Product
- 7. China APAC Green Buildings Market Analysis, Insights and Forecast, 2021-2033
- 7.1. Market Analysis, Insights and Forecast - by Product
- 7.1.1. Exterior Products
- 7.1.2. Interior products
- 7.1.3. Other Pr
- 7.2. Market Analysis, Insights and Forecast - by End User
- 7.2.1. Residential
- 7.2.2. Office
- 7.2.3. Retail
- 7.2.4. Institutional
- 7.2.5. Other End Users
- 7.3. Market Analysis, Insights and Forecast - by Geography
- 7.3.1. China
- 7.3.2. Japan
- 7.3.3. India
- 7.3.4. Australia
- 7.3.5. South Korea
- 7.3.6. Rest of APAC
- 7.1. Market Analysis, Insights and Forecast - by Product
- 8. Japan APAC Green Buildings Market Analysis, Insights and Forecast, 2021-2033
- 8.1. Market Analysis, Insights and Forecast - by Product
- 8.1.1. Exterior Products
- 8.1.2. Interior products
- 8.1.3. Other Pr
- 8.2. Market Analysis, Insights and Forecast - by End User
- 8.2.1. Residential
- 8.2.2. Office
- 8.2.3. Retail
- 8.2.4. Institutional
- 8.2.5. Other End Users
- 8.3. Market Analysis, Insights and Forecast - by Geography
- 8.3.1. China
- 8.3.2. Japan
- 8.3.3. India
- 8.3.4. Australia
- 8.3.5. South Korea
- 8.3.6. Rest of APAC
- 8.1. Market Analysis, Insights and Forecast - by Product
- 9. India APAC Green Buildings Market Analysis, Insights and Forecast, 2021-2033
- 9.1. Market Analysis, Insights and Forecast - by Product
- 9.1.1. Exterior Products
- 9.1.2. Interior products
- 9.1.3. Other Pr
- 9.2. Market Analysis, Insights and Forecast - by End User
- 9.2.1. Residential
- 9.2.2. Office
- 9.2.3. Retail
- 9.2.4. Institutional
- 9.2.5. Other End Users
- 9.3. Market Analysis, Insights and Forecast - by Geography
- 9.3.1. China
- 9.3.2. Japan
- 9.3.3. India
- 9.3.4. Australia
- 9.3.5. South Korea
- 9.3.6. Rest of APAC
- 9.1. Market Analysis, Insights and Forecast - by Product
- 10. Australia APAC Green Buildings Market Analysis, Insights and Forecast, 2021-2033
- 10.1. Market Analysis, Insights and Forecast - by Product
- 10.1.1. Exterior Products
- 10.1.2. Interior products
- 10.1.3. Other Pr
- 10.2. Market Analysis, Insights and Forecast - by End User
- 10.2.1. Residential
- 10.2.2. Office
- 10.2.3. Retail
- 10.2.4. Institutional
- 10.2.5. Other End Users
- 10.3. Market Analysis, Insights and Forecast - by Geography
- 10.3.1. China
- 10.3.2. Japan
- 10.3.3. India
- 10.3.4. Australia
- 10.3.5. South Korea
- 10.3.6. Rest of APAC
- 10.1. Market Analysis, Insights and Forecast - by Product
- 11. South Korea APAC Green Buildings Market Analysis, Insights and Forecast, 2021-2033
- 11.1. Market Analysis, Insights and Forecast - by Product
- 11.1.1. Exterior Products
- 11.1.2. Interior products
- 11.1.3. Other Pr
- 11.2. Market Analysis, Insights and Forecast - by End User
- 11.2.1. Residential
- 11.2.2. Office
- 11.2.3. Retail
- 11.2.4. Institutional
- 11.2.5. Other End Users
- 11.3. Market Analysis, Insights and Forecast - by Geography
- 11.3.1. China
- 11.3.2. Japan
- 11.3.3. India
- 11.3.4. Australia
- 11.3.5. South Korea
- 11.3.6. Rest of APAC
- 11.1. Market Analysis, Insights and Forecast - by Product
- 12. Rest of APAC APAC Green Buildings Market Analysis, Insights and Forecast, 2021-2033
- 12.1. Market Analysis, Insights and Forecast - by Product
- 12.1.1. Exterior Products
- 12.1.2. Interior products
- 12.1.3. Other Pr
- 12.2. Market Analysis, Insights and Forecast - by End User
- 12.2.1. Residential
- 12.2.2. Office
- 12.2.3. Retail
- 12.2.4. Institutional
- 12.2.5. Other End Users
- 12.3. Market Analysis, Insights and Forecast - by Geography
- 12.3.1. China
- 12.3.2. Japan
- 12.3.3. India
- 12.3.4. Australia
- 12.3.5. South Korea
- 12.3.6. Rest of APAC
- 12.1. Market Analysis, Insights and Forecast - by Product
- 13. Competitive Analysis
- 13.1. Company Profiles
- 13.1.1 Keppel Land
- 13.1.1.1. Company Overview
- 13.1.1.2. Products
- 13.1.1.3. Company Financials
- 13.1.1.4. SWOT Analysis
- 13.1.2 CapitaLand
- 13.1.2.1. Company Overview
- 13.1.2.2. Products
- 13.1.2.3. Company Financials
- 13.1.2.4. SWOT Analysis
- 13.1.3 Shimizu Corporation
- 13.1.3.1. Company Overview
- 13.1.3.2. Products
- 13.1.3.3. Company Financials
- 13.1.3.4. SWOT Analysis
- 13.1.4 WSP
- 13.1.4.1. Company Overview
- 13.1.4.2. Products
- 13.1.4.3. Company Financials
- 13.1.4.4. SWOT Analysis
- 13.1.5 Gammon Construction
- 13.1.5.1. Company Overview
- 13.1.5.2. Products
- 13.1.5.3. Company Financials
- 13.1.5.4. SWOT Analysis
- 13.1.6 Obayashi Corporation
- 13.1.6.1. Company Overview
- 13.1.6.2. Products
- 13.1.6.3. Company Financials
- 13.1.6.4. SWOT Analysis
- 13.1.7 Sun Hung Kai Properties**List Not Exhaustive 7 3 Other Companie
- 13.1.7.1. Company Overview
- 13.1.7.2. Products
- 13.1.7.3. Company Financials
- 13.1.7.4. SWOT Analysis
- 13.1.8 Lendlease
- 13.1.8.1. Company Overview
- 13.1.8.2. Products
- 13.1.8.3. Company Financials
- 13.1.8.4. SWOT Analysis
- 13.1.9 Swire Properties
- 13.1.9.1. Company Overview
- 13.1.9.2. Products
- 13.1.9.3. Company Financials
- 13.1.9.4. SWOT Analysis
- 13.1.10 Sino Group
- 13.1.10.1. Company Overview
- 13.1.10.2. Products
- 13.1.10.3. Company Financials
- 13.1.10.4. SWOT Analysis
- 13.1.1 Keppel Land
- 13.2. Market Entropy
- 13.2.1 Company's Key Areas Served
- 13.2.2 Recent Developments
- 13.3. Company Market Share Analysis 2025
- 13.3.1 Top 5 Companies Market Share Analysis
- 13.3.2 Top 3 Companies Market Share Analysis
- 13.4. List of Potential Customers
- 14. Research Methodology
List of Figures
- Figure 1: Global APAC Green Buildings Market Revenue Breakdown (Million, %) by Region 2025 & 2033
- Figure 2: China APAC Green Buildings Market Revenue (Million), by Product 2025 & 2033
- Figure 3: China APAC Green Buildings Market Revenue Share (%), by Product 2025 & 2033
- Figure 4: China APAC Green Buildings Market Revenue (Million), by End User 2025 & 2033
- Figure 5: China APAC Green Buildings Market Revenue Share (%), by End User 2025 & 2033
- Figure 6: China APAC Green Buildings Market Revenue (Million), by Geography 2025 & 2033
- Figure 7: China APAC Green Buildings Market Revenue Share (%), by Geography 2025 & 2033
- Figure 8: China APAC Green Buildings Market Revenue (Million), by Country 2025 & 2033
- Figure 9: China APAC Green Buildings Market Revenue Share (%), by Country 2025 & 2033
- Figure 10: Japan APAC Green Buildings Market Revenue (Million), by Product 2025 & 2033
- Figure 11: Japan APAC Green Buildings Market Revenue Share (%), by Product 2025 & 2033
- Figure 12: Japan APAC Green Buildings Market Revenue (Million), by End User 2025 & 2033
- Figure 13: Japan APAC Green Buildings Market Revenue Share (%), by End User 2025 & 2033
- Figure 14: Japan APAC Green Buildings Market Revenue (Million), by Geography 2025 & 2033
- Figure 15: Japan APAC Green Buildings Market Revenue Share (%), by Geography 2025 & 2033
- Figure 16: Japan APAC Green Buildings Market Revenue (Million), by Country 2025 & 2033
- Figure 17: Japan APAC Green Buildings Market Revenue Share (%), by Country 2025 & 2033
- Figure 18: India APAC Green Buildings Market Revenue (Million), by Product 2025 & 2033
- Figure 19: India APAC Green Buildings Market Revenue Share (%), by Product 2025 & 2033
- Figure 20: India APAC Green Buildings Market Revenue (Million), by End User 2025 & 2033
- Figure 21: India APAC Green Buildings Market Revenue Share (%), by End User 2025 & 2033
- Figure 22: India APAC Green Buildings Market Revenue (Million), by Geography 2025 & 2033
- Figure 23: India APAC Green Buildings Market Revenue Share (%), by Geography 2025 & 2033
- Figure 24: India APAC Green Buildings Market Revenue (Million), by Country 2025 & 2033
- Figure 25: India APAC Green Buildings Market Revenue Share (%), by Country 2025 & 2033
- Figure 26: Australia APAC Green Buildings Market Revenue (Million), by Product 2025 & 2033
- Figure 27: Australia APAC Green Buildings Market Revenue Share (%), by Product 2025 & 2033
- Figure 28: Australia APAC Green Buildings Market Revenue (Million), by End User 2025 & 2033
- Figure 29: Australia APAC Green Buildings Market Revenue Share (%), by End User 2025 & 2033
- Figure 30: Australia APAC Green Buildings Market Revenue (Million), by Geography 2025 & 2033
- Figure 31: Australia APAC Green Buildings Market Revenue Share (%), by Geography 2025 & 2033
- Figure 32: Australia APAC Green Buildings Market Revenue (Million), by Country 2025 & 2033
- Figure 33: Australia APAC Green Buildings Market Revenue Share (%), by Country 2025 & 2033
- Figure 34: South Korea APAC Green Buildings Market Revenue (Million), by Product 2025 & 2033
- Figure 35: South Korea APAC Green Buildings Market Revenue Share (%), by Product 2025 & 2033
- Figure 36: South Korea APAC Green Buildings Market Revenue (Million), by End User 2025 & 2033
- Figure 37: South Korea APAC Green Buildings Market Revenue Share (%), by End User 2025 & 2033
- Figure 38: South Korea APAC Green Buildings Market Revenue (Million), by Geography 2025 & 2033
- Figure 39: South Korea APAC Green Buildings Market Revenue Share (%), by Geography 2025 & 2033
- Figure 40: South Korea APAC Green Buildings Market Revenue (Million), by Country 2025 & 2033
- Figure 41: South Korea APAC Green Buildings Market Revenue Share (%), by Country 2025 & 2033
- Figure 42: Rest of APAC APAC Green Buildings Market Revenue (Million), by Product 2025 & 2033
- Figure 43: Rest of APAC APAC Green Buildings Market Revenue Share (%), by Product 2025 & 2033
- Figure 44: Rest of APAC APAC Green Buildings Market Revenue (Million), by End User 2025 & 2033
- Figure 45: Rest of APAC APAC Green Buildings Market Revenue Share (%), by End User 2025 & 2033
- Figure 46: Rest of APAC APAC Green Buildings Market Revenue (Million), by Geography 2025 & 2033
- Figure 47: Rest of APAC APAC Green Buildings Market Revenue Share (%), by Geography 2025 & 2033
- Figure 48: Rest of APAC APAC Green Buildings Market Revenue (Million), by Country 2025 & 2033
- Figure 49: Rest of APAC APAC Green Buildings Market Revenue Share (%), by Country 2025 & 2033
List of Tables
- Table 1: Global APAC Green Buildings Market Revenue Million Forecast, by Product 2020 & 2033
- Table 2: Global APAC Green Buildings Market Revenue Million Forecast, by End User 2020 & 2033
- Table 3: Global APAC Green Buildings Market Revenue Million Forecast, by Geography 2020 & 2033
- Table 4: Global APAC Green Buildings Market Revenue Million Forecast, by Region 2020 & 2033
- Table 5: Global APAC Green Buildings Market Revenue Million Forecast, by Product 2020 & 2033
- Table 6: Global APAC Green Buildings Market Revenue Million Forecast, by End User 2020 & 2033
- Table 7: Global APAC Green Buildings Market Revenue Million Forecast, by Geography 2020 & 2033
- Table 8: Global APAC Green Buildings Market Revenue Million Forecast, by Country 2020 & 2033
- Table 9: Global APAC Green Buildings Market Revenue Million Forecast, by Product 2020 & 2033
- Table 10: Global APAC Green Buildings Market Revenue Million Forecast, by End User 2020 & 2033
- Table 11: Global APAC Green Buildings Market Revenue Million Forecast, by Geography 2020 & 2033
- Table 12: Global APAC Green Buildings Market Revenue Million Forecast, by Country 2020 & 2033
- Table 13: Global APAC Green Buildings Market Revenue Million Forecast, by Product 2020 & 2033
- Table 14: Global APAC Green Buildings Market Revenue Million Forecast, by End User 2020 & 2033
- Table 15: Global APAC Green Buildings Market Revenue Million Forecast, by Geography 2020 & 2033
- Table 16: Global APAC Green Buildings Market Revenue Million Forecast, by Country 2020 & 2033
- Table 17: Global APAC Green Buildings Market Revenue Million Forecast, by Product 2020 & 2033
- Table 18: Global APAC Green Buildings Market Revenue Million Forecast, by End User 2020 & 2033
- Table 19: Global APAC Green Buildings Market Revenue Million Forecast, by Geography 2020 & 2033
- Table 20: Global APAC Green Buildings Market Revenue Million Forecast, by Country 2020 & 2033
- Table 21: Global APAC Green Buildings Market Revenue Million Forecast, by Product 2020 & 2033
- Table 22: Global APAC Green Buildings Market Revenue Million Forecast, by End User 2020 & 2033
- Table 23: Global APAC Green Buildings Market Revenue Million Forecast, by Geography 2020 & 2033
- Table 24: Global APAC Green Buildings Market Revenue Million Forecast, by Country 2020 & 2033
- Table 25: Global APAC Green Buildings Market Revenue Million Forecast, by Product 2020 & 2033
- Table 26: Global APAC Green Buildings Market Revenue Million Forecast, by End User 2020 & 2033
- Table 27: Global APAC Green Buildings Market Revenue Million Forecast, by Geography 2020 & 2033
- Table 28: Global APAC Green Buildings Market Revenue Million Forecast, by Country 2020 & 2033
Frequently Asked Questions
1. What is the projected Compound Annual Growth Rate (CAGR) of the APAC Green Buildings Market?
The projected CAGR is approximately 12.23%.
2. Which companies are prominent players in the APAC Green Buildings Market?
Key companies in the market include Keppel Land, CapitaLand, Shimizu Corporation, WSP, Gammon Construction, Obayashi Corporation, Sun Hung Kai Properties**List Not Exhaustive 7 3 Other Companie, Lendlease, Swire Properties, Sino Group.
3. What are the main segments of the APAC Green Buildings Market?
The market segments include Product, End User, Geography.
4. Can you provide details about the market size?
The market size is estimated to be USD 136.90 Million as of 2022.
5. What are some drivers contributing to market growth?
Energy Efficiency in Construction Driving the Market; Flexibility and Customization Options Driving the Market.
6. What are the notable trends driving market growth?
The Commercial Segment’s Increasing Demand for Green Buildings.
7. Are there any restraints impacting market growth?
Limited Availability of Suitable Land for Construction Hindering the Market; Lower Quality Compared to Traditional Construction.
8. Can you provide examples of recent developments in the market?
April 2023: The world’s largest coffee company, Starbucks, has unveiled its first greener stores in Asia-Pacific as a part of a global rollout of its greener store framework that has grown to more than 3,500 locations across 20 markets. The five new greener stores, located in Singapore (Singapore), Thailand (Thailand), and Vietnam (Vietnam), are among the first in Starbucks Asia-Pacific region. More than 20 other Starbucks stores are expected to receive greener store certifications later this year. With this latest round of certifications, Starbucks is well on track to reaching its goal of having 10,000 greener stores worldwide by 2025.
9. What pricing options are available for accessing the report?
Pricing options include single-user, multi-user, and enterprise licenses priced at USD 4750, USD 5250, and USD 8750 respectively.
10. Is the market size provided in terms of value or volume?
The market size is provided in terms of value, measured in Million.
11. Are there any specific market keywords associated with the report?
Yes, the market keyword associated with the report is "APAC Green Buildings Market," which aids in identifying and referencing the specific market segment covered.
12. How do I determine which pricing option suits my needs best?
The pricing options vary based on user requirements and access needs. Individual users may opt for single-user licenses, while businesses requiring broader access may choose multi-user or enterprise licenses for cost-effective access to the report.
13. Are there any additional resources or data provided in the APAC Green Buildings Market report?
While the report offers comprehensive insights, it's advisable to review the specific contents or supplementary materials provided to ascertain if additional resources or data are available.
14. How can I stay updated on further developments or reports in the APAC Green Buildings Market?
To stay informed about further developments, trends, and reports in the APAC Green Buildings Market, consider subscribing to industry newsletters, following relevant companies and organizations, or regularly checking reputable industry news sources and publications.
Methodology
Step 1 - Identification of Relevant Samples Size from Population Database


Step 2 - Approaches for Defining Global Market Size (Value, Volume* & Price*)

Note*: In applicable scenarios
Step 3 - Data Sources
Primary Research
- Web Analytics
- Survey Reports
- Research Institute
- Latest Research Reports
- Opinion Leaders
Secondary Research
- Annual Reports
- White Paper
- Latest Press Release
- Industry Association
- Paid Database
- Investor Presentations

Step 4 - Data Triangulation
Involves using different sources of information in order to increase the validity of a study
These sources are likely to be stakeholders in a program - participants, other researchers, program staff, other community members, and so on.
Then we put all data in single framework & apply various statistical tools to find out the dynamic on the market.
During the analysis stage, feedback from the stakeholder groups would be compared to determine areas of agreement as well as areas of divergence