
Key Insights
The Asia-Pacific (APAC) fruit and vegetable ingredients market is experiencing robust growth, driven by increasing demand for convenient and healthy food products. The region's large and growing population, coupled with rising disposable incomes and changing dietary habits, are key factors fueling this expansion. The preference for natural and minimally processed foods is boosting the demand for products like NFC (Not From Concentrate) juices, fruit purees, and vegetable concentrates. Innovation in product development is also a significant driver, with manufacturers introducing new and exciting ingredient combinations and formulations to cater to evolving consumer tastes. While challenges such as fluctuating raw material prices and supply chain disruptions exist, the overall market outlook remains positive. The segment's growth is further propelled by the flourishing food processing and beverage industries in countries like India, China, and Southeast Asia, which are significant consumers of these ingredients. The market is segmented by ingredient type (fruits, vegetables), product type (concentrates, pastes and purees, pieces and powders, NFC juices), and application (beverages, confectionery, bakery, soups & sauces, dairy, RTE products). This diversification reflects the versatility of fruit and vegetable ingredients across various food categories. The projected CAGR of 4.98% suggests sustained growth throughout the forecast period (2025-2033), making it an attractive market for both established players and new entrants. Competition is likely to intensify as companies strive to innovate and capture market share within this dynamic landscape.
The significant growth within the APAC region is partly attributed to the increasing popularity of processed foods incorporating these ingredients. The convenience factor associated with these products appeals to busy consumers, driving sales. Furthermore, the rising awareness of health and wellness is prompting consumers to seek out natural ingredients, boosting the demand for fruit and vegetable-based options. Governments in many APAC countries are also promoting healthier eating habits, further strengthening the market. However, factors such as seasonal variations in fruit and vegetable availability and the need for robust cold chain infrastructure to maintain product quality pose challenges to market growth. Effective supply chain management and technological advancements in preservation techniques are critical to mitigating these challenges and ensuring consistent product quality and availability. The focus on sustainability and ethical sourcing is also gaining traction, with consumers increasingly demanding transparency and traceability in the supply chain. Companies are responding by implementing sustainable practices throughout their operations, ensuring environmentally and socially responsible sourcing of raw materials.
APAC Fruit and Vegetable Ingredients Market: A Comprehensive Market Report (2019-2033)
This comprehensive report provides an in-depth analysis of the Asia-Pacific (APAC) fruit and vegetable ingredients market, encompassing market dynamics, growth trends, dominant segments, and key players. The study period covers 2019-2033, with 2025 as the base year and a forecast period of 2025-2033. The report is designed for industry professionals, investors, and strategic decision-makers seeking to understand and capitalize on the opportunities within this rapidly evolving market. Market value is presented in Million units.
APAC Fruit and Vegetable Ingredients Market Market Dynamics & Structure
The APAC fruit and vegetable ingredients market is characterized by a moderately concentrated structure with several large multinational players and numerous regional players competing. Technological innovation, particularly in processing and preservation techniques, is a key driver, alongside increasing demand for convenient, healthy food products. Regulatory frameworks concerning food safety and labeling significantly influence market operations. Competitive substitutes, such as artificial flavorings and colorings, present a challenge, but the growing consumer preference for natural ingredients is offsetting this. The market is also witnessing a rise in M&A activity, with larger companies seeking to expand their product portfolios and geographic reach.
- Market Concentration: Moderately concentrated, with top 5 players holding approximately xx% market share in 2025.
- Technological Innovation: Focus on improved extraction methods, preservation technologies (e.g., high-pressure processing, freeze-drying), and ingredient standardization.
- Regulatory Framework: Stringent food safety regulations in several APAC countries, impacting ingredient sourcing and processing.
- Competitive Substitutes: Artificial flavorings and colorings offer cost-competitive alternatives, but natural options are gaining preference.
- End-User Demographics: Growing middle class and changing consumer preferences towards health and wellness are key drivers.
- M&A Trends: xx M&A deals recorded in the APAC region between 2019 and 2024, with an estimated xx deals predicted for 2025-2033.
APAC Fruit and Vegetable Ingredients Market Growth Trends & Insights
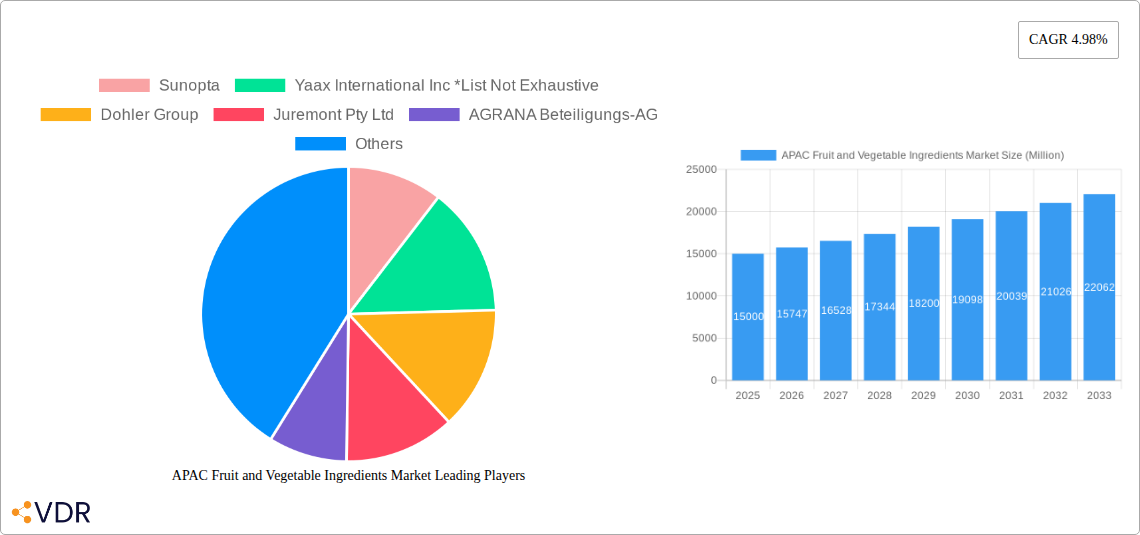
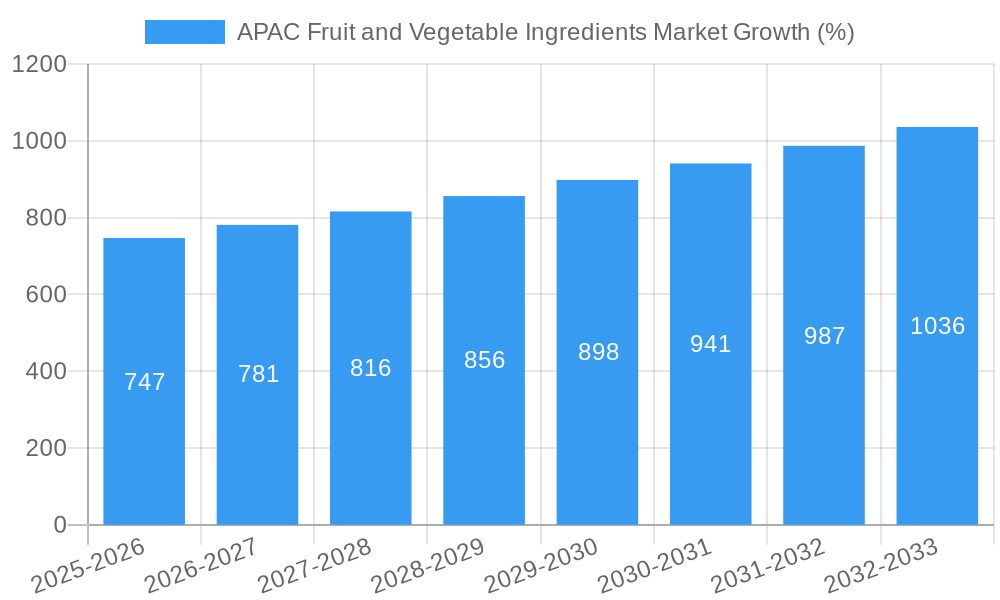
The APAC fruit and vegetable ingredients market is experiencing robust growth, driven by several factors. Market size expanded from xx Million in 2019 to xx Million in 2024, exhibiting a CAGR of xx%. This growth is projected to continue, with a forecasted CAGR of xx% from 2025 to 2033, reaching a market size of xx Million by 2033. Technological advancements are increasing efficiency and expanding product offerings, while shifting consumer preferences toward natural and convenient foods are fueling demand. The adoption rate of fruit and vegetable-based ingredients in various food and beverage categories is steadily rising, particularly in rapidly developing economies. Specific market segments, like functional foods and beverages, are witnessing exceptionally high growth. Consumer behavior is increasingly influenced by health and wellness concerns, creating a significant opportunity for manufacturers to provide natural and clean-label ingredients.
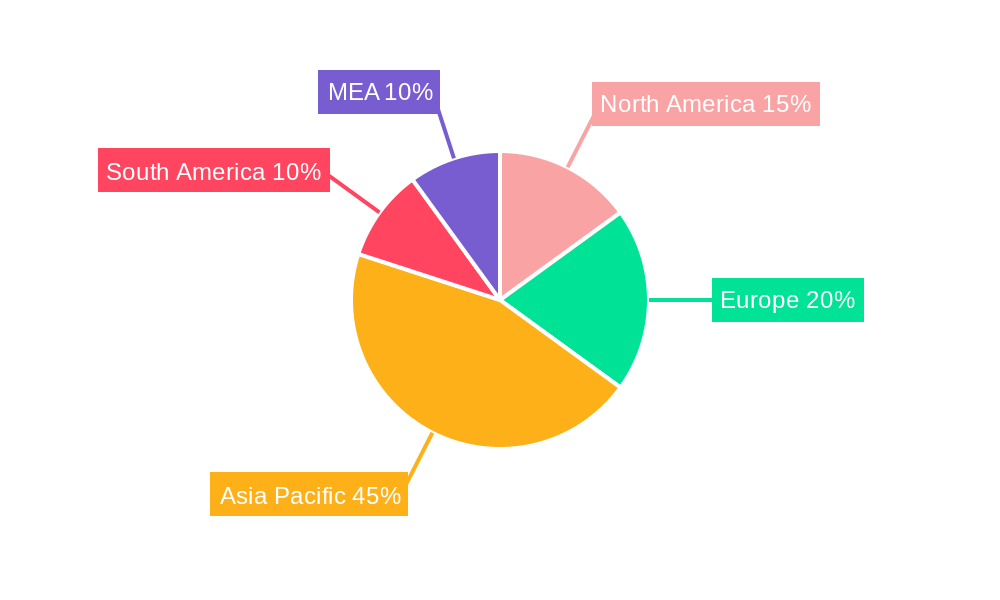
Dominant Regions, Countries, or Segments in APAC Fruit and Vegetable Ingredients Market
China and India dominate the APAC fruit and vegetable ingredients market, driven by factors like high population density, rising disposable incomes, and expanding food processing industries. Within the segments, Fruits holds a larger market share compared to Vegetables due to higher consumer demand and versatility in applications. Concentrates, pastes, and purees are the dominant product type, owing to their cost-effectiveness and suitability for various applications. Beverages remain the leading application segment, followed by confectionery products and bakery products. Southeast Asian nations are expected to experience rapid growth in the forecast period due to the burgeoning food and beverage sector.
- Key Drivers in China & India:
- Large and growing population.
- Increasing disposable incomes.
- Expanding food processing and manufacturing industries.
- Favorable government policies supporting agricultural development.
- Dominant Segments:
- By Ingredient Type: Fruits (xx% market share in 2025)
- By Product Type: Concentrates, Pastes & Purees (xx% market share in 2025)
- By Application: Beverages (xx% market share in 2025)
APAC Fruit and Vegetable Ingredients Market Product Landscape
The market features a wide range of fruit and vegetable ingredients, with a focus on innovation in processing and preservation methods to enhance product quality, shelf life, and nutritional value. Concentrated juices, NFC (Not From Concentrate) juices, purees, pastes, powders, and pieces are common forms. The trend is towards clean-label, functional ingredients with added health benefits, such as antioxidants or specific vitamins. Technological advancements like high-pressure processing (HPP) and freeze-drying are improving product quality and extending shelf life.
Key Drivers, Barriers & Challenges in APAP Fruit and Vegetable Ingredients Market
Key Drivers: Growing consumer demand for healthy and natural food products, increasing disposable incomes in developing economies, expanding food and beverage industry, and technological advancements improving processing efficiency.
Key Challenges: Fluctuations in raw material prices and availability, stringent food safety regulations, competition from synthetic substitutes, and maintaining supply chain integrity. Supply chain disruptions can impact the market negatively by xx% based on past disruptions.
Emerging Opportunities in APAP Fruit and Vegetable Ingredients Market
Growing demand for functional foods and beverages, increasing popularity of plant-based diets, and opportunities in emerging markets such as Vietnam and Indonesia present significant growth potential. Innovations in ingredient extraction and preservation are creating new product possibilities, and customized ingredient solutions tailored to specific consumer needs are gaining traction.
Growth Accelerators in the APAC Fruit and Vegetable Ingredients Market Industry
Strategic partnerships between ingredient suppliers and food manufacturers, investments in research and development for innovative products, and market expansion into new regions are key catalysts driving long-term growth. Technological advancements in processing and preservation enhance product quality and expand application opportunities, fueling market expansion.
Key Players Shaping the APAC Fruit and Vegetable Ingredients Market Market
- Sunopta
- Yaax International Inc
- Dohler Group
- Juremont Pty Ltd
- AGRANA Beteiligungs-AG
- Archer Daniels Midland Company
- Sensient Technologies Corporation
- Frutarom (Taura Natural Ingredient)
Notable Milestones in APAC Fruit and Vegetable Ingredients Market Sector
- 2022-Q3: Launch of a new line of organic fruit purees by [Company Name].
- 2023-Q1: Acquisition of [Company A] by [Company B], expanding market presence in Southeast Asia.
- 2024-Q4: Introduction of a novel fruit and vegetable powder blend with enhanced nutritional benefits by [Company Name].
In-Depth APAC Fruit and Vegetable Ingredients Market Market Outlook
The APAC fruit and vegetable ingredients market holds significant long-term growth potential, driven by sustained consumer demand for natural and healthy food products, technological advancements, and market expansion across the region. Strategic partnerships, innovation in product development, and a focus on efficient supply chains will be crucial for success in this dynamic market. The market's future is bright, with projected growth exceeding xx% in the coming decade.
APAC Fruit and Vegetable Ingredients Market Segmentation
-
1. Ingredient Type
- 1.1. Fruits
- 1.2. Vegetables
-
2. Product Type
- 2.1. Concentrates
- 2.2. Pastes and Purees
- 2.3. Pieces and Powders
- 2.4. NFC Juices
-
3. Application
- 3.1. Beverages
- 3.2. Confectionery Products
- 3.3. Bakery Products
- 3.4. Soups and Sauces
- 3.5. Dairy Products
- 3.6. RTE Products
-
4. Geography
- 4.1. China
- 4.2. Japan
- 4.3. India
- 4.4. Australia
- 4.5. Rest of Asia-Pacific
APAC Fruit and Vegetable Ingredients Market Segmentation By Geography
- 1. China
- 2. Japan
- 3. India
- 4. Australia
- 5. Rest of Asia Pacific
APAC Fruit and Vegetable Ingredients Market REPORT HIGHLIGHTS
| Aspects | Details |
|---|---|
| Study Period | 2019-2033 |
| Base Year | 2024 |
| Estimated Year | 2025 |
| Forecast Period | 2025-2033 |
| Historical Period | 2019-2024 |
| Growth Rate | CAGR of 4.98% from 2019-2033 |
| Segmentation |
|
Table of Contents
- 1. Introduction
- 1.1. Research Scope
- 1.2. Market Segmentation
- 1.3. Research Methodology
- 1.4. Definitions and Assumptions
- 2. Executive Summary
- 2.1. Introduction
- 3. Market Dynamics
- 3.1. Introduction
- 3.2. Market Drivers
- 3.2.1. Increasing Demand for Protein-Rich Food; Increasing Demand for Plant-Based and Organic Ingredients
- 3.3. Market Restrains
- 3.3.1. Presence of Alternative Proteins
- 3.4. Market Trends
- 3.4.1. Growing Application of Natural Ingredients
- 4. Market Factor Analysis
- 4.1. Porters Five Forces
- 4.2. Supply/Value Chain
- 4.3. PESTEL analysis
- 4.4. Market Entropy
- 4.5. Patent/Trademark Analysis
- 5. Global APAC Fruit and Vegetable Ingredients Market Analysis, Insights and Forecast, 2019-2031
- 5.1. Market Analysis, Insights and Forecast - by Ingredient Type
- 5.1.1. Fruits
- 5.1.2. Vegetables
- 5.2. Market Analysis, Insights and Forecast - by Product Type
- 5.2.1. Concentrates
- 5.2.2. Pastes and Purees
- 5.2.3. Pieces and Powders
- 5.2.4. NFC Juices
- 5.3. Market Analysis, Insights and Forecast - by Application
- 5.3.1. Beverages
- 5.3.2. Confectionery Products
- 5.3.3. Bakery Products
- 5.3.4. Soups and Sauces
- 5.3.5. Dairy Products
- 5.3.6. RTE Products
- 5.4. Market Analysis, Insights and Forecast - by Geography
- 5.4.1. China
- 5.4.2. Japan
- 5.4.3. India
- 5.4.4. Australia
- 5.4.5. Rest of Asia-Pacific
- 5.5. Market Analysis, Insights and Forecast - by Region
- 5.5.1. China
- 5.5.2. Japan
- 5.5.3. India
- 5.5.4. Australia
- 5.5.5. Rest of Asia Pacific
- 5.1. Market Analysis, Insights and Forecast - by Ingredient Type
- 6. China APAC Fruit and Vegetable Ingredients Market Analysis, Insights and Forecast, 2019-2031
- 6.1. Market Analysis, Insights and Forecast - by Ingredient Type
- 6.1.1. Fruits
- 6.1.2. Vegetables
- 6.2. Market Analysis, Insights and Forecast - by Product Type
- 6.2.1. Concentrates
- 6.2.2. Pastes and Purees
- 6.2.3. Pieces and Powders
- 6.2.4. NFC Juices
- 6.3. Market Analysis, Insights and Forecast - by Application
- 6.3.1. Beverages
- 6.3.2. Confectionery Products
- 6.3.3. Bakery Products
- 6.3.4. Soups and Sauces
- 6.3.5. Dairy Products
- 6.3.6. RTE Products
- 6.4. Market Analysis, Insights and Forecast - by Geography
- 6.4.1. China
- 6.4.2. Japan
- 6.4.3. India
- 6.4.4. Australia
- 6.4.5. Rest of Asia-Pacific
- 6.1. Market Analysis, Insights and Forecast - by Ingredient Type
- 7. Japan APAC Fruit and Vegetable Ingredients Market Analysis, Insights and Forecast, 2019-2031
- 7.1. Market Analysis, Insights and Forecast - by Ingredient Type
- 7.1.1. Fruits
- 7.1.2. Vegetables
- 7.2. Market Analysis, Insights and Forecast - by Product Type
- 7.2.1. Concentrates
- 7.2.2. Pastes and Purees
- 7.2.3. Pieces and Powders
- 7.2.4. NFC Juices
- 7.3. Market Analysis, Insights and Forecast - by Application
- 7.3.1. Beverages
- 7.3.2. Confectionery Products
- 7.3.3. Bakery Products
- 7.3.4. Soups and Sauces
- 7.3.5. Dairy Products
- 7.3.6. RTE Products
- 7.4. Market Analysis, Insights and Forecast - by Geography
- 7.4.1. China
- 7.4.2. Japan
- 7.4.3. India
- 7.4.4. Australia
- 7.4.5. Rest of Asia-Pacific
- 7.1. Market Analysis, Insights and Forecast - by Ingredient Type
- 8. India APAC Fruit and Vegetable Ingredients Market Analysis, Insights and Forecast, 2019-2031
- 8.1. Market Analysis, Insights and Forecast - by Ingredient Type
- 8.1.1. Fruits
- 8.1.2. Vegetables
- 8.2. Market Analysis, Insights and Forecast - by Product Type
- 8.2.1. Concentrates
- 8.2.2. Pastes and Purees
- 8.2.3. Pieces and Powders
- 8.2.4. NFC Juices
- 8.3. Market Analysis, Insights and Forecast - by Application
- 8.3.1. Beverages
- 8.3.2. Confectionery Products
- 8.3.3. Bakery Products
- 8.3.4. Soups and Sauces
- 8.3.5. Dairy Products
- 8.3.6. RTE Products
- 8.4. Market Analysis, Insights and Forecast - by Geography
- 8.4.1. China
- 8.4.2. Japan
- 8.4.3. India
- 8.4.4. Australia
- 8.4.5. Rest of Asia-Pacific
- 8.1. Market Analysis, Insights and Forecast - by Ingredient Type
- 9. Australia APAC Fruit and Vegetable Ingredients Market Analysis, Insights and Forecast, 2019-2031
- 9.1. Market Analysis, Insights and Forecast - by Ingredient Type
- 9.1.1. Fruits
- 9.1.2. Vegetables
- 9.2. Market Analysis, Insights and Forecast - by Product Type
- 9.2.1. Concentrates
- 9.2.2. Pastes and Purees
- 9.2.3. Pieces and Powders
- 9.2.4. NFC Juices
- 9.3. Market Analysis, Insights and Forecast - by Application
- 9.3.1. Beverages
- 9.3.2. Confectionery Products
- 9.3.3. Bakery Products
- 9.3.4. Soups and Sauces
- 9.3.5. Dairy Products
- 9.3.6. RTE Products
- 9.4. Market Analysis, Insights and Forecast - by Geography
- 9.4.1. China
- 9.4.2. Japan
- 9.4.3. India
- 9.4.4. Australia
- 9.4.5. Rest of Asia-Pacific
- 9.1. Market Analysis, Insights and Forecast - by Ingredient Type
- 10. Rest of Asia Pacific APAC Fruit and Vegetable Ingredients Market Analysis, Insights and Forecast, 2019-2031
- 10.1. Market Analysis, Insights and Forecast - by Ingredient Type
- 10.1.1. Fruits
- 10.1.2. Vegetables
- 10.2. Market Analysis, Insights and Forecast - by Product Type
- 10.2.1. Concentrates
- 10.2.2. Pastes and Purees
- 10.2.3. Pieces and Powders
- 10.2.4. NFC Juices
- 10.3. Market Analysis, Insights and Forecast - by Application
- 10.3.1. Beverages
- 10.3.2. Confectionery Products
- 10.3.3. Bakery Products
- 10.3.4. Soups and Sauces
- 10.3.5. Dairy Products
- 10.3.6. RTE Products
- 10.4. Market Analysis, Insights and Forecast - by Geography
- 10.4.1. China
- 10.4.2. Japan
- 10.4.3. India
- 10.4.4. Australia
- 10.4.5. Rest of Asia-Pacific
- 10.1. Market Analysis, Insights and Forecast - by Ingredient Type
- 11. North America APAC Fruit and Vegetable Ingredients Market Analysis, Insights and Forecast, 2019-2031
- 11.1. Market Analysis, Insights and Forecast - By Country/Sub-region
- 11.1.1 United States
- 11.1.2 Canada
- 11.1.3 Mexico
- 12. Europe APAC Fruit and Vegetable Ingredients Market Analysis, Insights and Forecast, 2019-2031
- 12.1. Market Analysis, Insights and Forecast - By Country/Sub-region
- 12.1.1 Germany
- 12.1.2 United Kingdom
- 12.1.3 France
- 12.1.4 Spain
- 12.1.5 Italy
- 12.1.6 Spain
- 12.1.7 Belgium
- 12.1.8 Netherland
- 12.1.9 Nordics
- 12.1.10 Rest of Europe
- 13. Asia Pacific APAC Fruit and Vegetable Ingredients Market Analysis, Insights and Forecast, 2019-2031
- 13.1. Market Analysis, Insights and Forecast - By Country/Sub-region
- 13.1.1 China
- 13.1.2 Japan
- 13.1.3 India
- 13.1.4 South Korea
- 13.1.5 Southeast Asia
- 13.1.6 Australia
- 13.1.7 Indonesia
- 13.1.8 Phillipes
- 13.1.9 Singapore
- 13.1.10 Thailandc
- 13.1.11 Rest of Asia Pacific
- 14. South America APAC Fruit and Vegetable Ingredients Market Analysis, Insights and Forecast, 2019-2031
- 14.1. Market Analysis, Insights and Forecast - By Country/Sub-region
- 14.1.1 Brazil
- 14.1.2 Argentina
- 14.1.3 Peru
- 14.1.4 Chile
- 14.1.5 Colombia
- 14.1.6 Ecuador
- 14.1.7 Venezuela
- 14.1.8 Rest of South America
- 15. North America APAC Fruit and Vegetable Ingredients Market Analysis, Insights and Forecast, 2019-2031
- 15.1. Market Analysis, Insights and Forecast - By Country/Sub-region
- 15.1.1 United States
- 15.1.2 Canada
- 15.1.3 Mexico
- 16. MEA APAC Fruit and Vegetable Ingredients Market Analysis, Insights and Forecast, 2019-2031
- 16.1. Market Analysis, Insights and Forecast - By Country/Sub-region
- 16.1.1 United Arab Emirates
- 16.1.2 Saudi Arabia
- 16.1.3 South Africa
- 16.1.4 Rest of Middle East and Africa
- 17. Competitive Analysis
- 17.1. Global Market Share Analysis 2024
- 17.2. Company Profiles
- 17.2.1 Sunopta
- 17.2.1.1. Overview
- 17.2.1.2. Products
- 17.2.1.3. SWOT Analysis
- 17.2.1.4. Recent Developments
- 17.2.1.5. Financials (Based on Availability)
- 17.2.2 Yaax International Inc *List Not Exhaustive
- 17.2.2.1. Overview
- 17.2.2.2. Products
- 17.2.2.3. SWOT Analysis
- 17.2.2.4. Recent Developments
- 17.2.2.5. Financials (Based on Availability)
- 17.2.3 Dohler Group
- 17.2.3.1. Overview
- 17.2.3.2. Products
- 17.2.3.3. SWOT Analysis
- 17.2.3.4. Recent Developments
- 17.2.3.5. Financials (Based on Availability)
- 17.2.4 Juremont Pty Ltd
- 17.2.4.1. Overview
- 17.2.4.2. Products
- 17.2.4.3. SWOT Analysis
- 17.2.4.4. Recent Developments
- 17.2.4.5. Financials (Based on Availability)
- 17.2.5 AGRANA Beteiligungs-AG
- 17.2.5.1. Overview
- 17.2.5.2. Products
- 17.2.5.3. SWOT Analysis
- 17.2.5.4. Recent Developments
- 17.2.5.5. Financials (Based on Availability)
- 17.2.6 Archer Daniels Midland Company
- 17.2.6.1. Overview
- 17.2.6.2. Products
- 17.2.6.3. SWOT Analysis
- 17.2.6.4. Recent Developments
- 17.2.6.5. Financials (Based on Availability)
- 17.2.7 Sensient Technologies Corporation
- 17.2.7.1. Overview
- 17.2.7.2. Products
- 17.2.7.3. SWOT Analysis
- 17.2.7.4. Recent Developments
- 17.2.7.5. Financials (Based on Availability)
- 17.2.8 Frutarom (Taura Natural Ingredient)
- 17.2.8.1. Overview
- 17.2.8.2. Products
- 17.2.8.3. SWOT Analysis
- 17.2.8.4. Recent Developments
- 17.2.8.5. Financials (Based on Availability)
- 17.2.1 Sunopta
List of Figures
- Figure 1: Global APAC Fruit and Vegetable Ingredients Market Revenue Breakdown (Million, %) by Region 2024 & 2032
- Figure 2: Global APAC Fruit and Vegetable Ingredients Market Volume Breakdown (K Tons, %) by Region 2024 & 2032
- Figure 3: North America APAC Fruit and Vegetable Ingredients Market Revenue (Million), by Country 2024 & 2032
- Figure 4: North America APAC Fruit and Vegetable Ingredients Market Volume (K Tons), by Country 2024 & 2032
- Figure 5: North America APAC Fruit and Vegetable Ingredients Market Revenue Share (%), by Country 2024 & 2032
- Figure 6: North America APAC Fruit and Vegetable Ingredients Market Volume Share (%), by Country 2024 & 2032
- Figure 7: Europe APAC Fruit and Vegetable Ingredients Market Revenue (Million), by Country 2024 & 2032
- Figure 8: Europe APAC Fruit and Vegetable Ingredients Market Volume (K Tons), by Country 2024 & 2032
- Figure 9: Europe APAC Fruit and Vegetable Ingredients Market Revenue Share (%), by Country 2024 & 2032
- Figure 10: Europe APAC Fruit and Vegetable Ingredients Market Volume Share (%), by Country 2024 & 2032
- Figure 11: Asia Pacific APAC Fruit and Vegetable Ingredients Market Revenue (Million), by Country 2024 & 2032
- Figure 12: Asia Pacific APAC Fruit and Vegetable Ingredients Market Volume (K Tons), by Country 2024 & 2032
- Figure 13: Asia Pacific APAC Fruit and Vegetable Ingredients Market Revenue Share (%), by Country 2024 & 2032
- Figure 14: Asia Pacific APAC Fruit and Vegetable Ingredients Market Volume Share (%), by Country 2024 & 2032
- Figure 15: South America APAC Fruit and Vegetable Ingredients Market Revenue (Million), by Country 2024 & 2032
- Figure 16: South America APAC Fruit and Vegetable Ingredients Market Volume (K Tons), by Country 2024 & 2032
- Figure 17: South America APAC Fruit and Vegetable Ingredients Market Revenue Share (%), by Country 2024 & 2032
- Figure 18: South America APAC Fruit and Vegetable Ingredients Market Volume Share (%), by Country 2024 & 2032
- Figure 19: North America APAC Fruit and Vegetable Ingredients Market Revenue (Million), by Country 2024 & 2032
- Figure 20: North America APAC Fruit and Vegetable Ingredients Market Volume (K Tons), by Country 2024 & 2032
- Figure 21: North America APAC Fruit and Vegetable Ingredients Market Revenue Share (%), by Country 2024 & 2032
- Figure 22: North America APAC Fruit and Vegetable Ingredients Market Volume Share (%), by Country 2024 & 2032
- Figure 23: MEA APAC Fruit and Vegetable Ingredients Market Revenue (Million), by Country 2024 & 2032
- Figure 24: MEA APAC Fruit and Vegetable Ingredients Market Volume (K Tons), by Country 2024 & 2032
- Figure 25: MEA APAC Fruit and Vegetable Ingredients Market Revenue Share (%), by Country 2024 & 2032
- Figure 26: MEA APAC Fruit and Vegetable Ingredients Market Volume Share (%), by Country 2024 & 2032
- Figure 27: China APAC Fruit and Vegetable Ingredients Market Revenue (Million), by Ingredient Type 2024 & 2032
- Figure 28: China APAC Fruit and Vegetable Ingredients Market Volume (K Tons), by Ingredient Type 2024 & 2032
- Figure 29: China APAC Fruit and Vegetable Ingredients Market Revenue Share (%), by Ingredient Type 2024 & 2032
- Figure 30: China APAC Fruit and Vegetable Ingredients Market Volume Share (%), by Ingredient Type 2024 & 2032
- Figure 31: China APAC Fruit and Vegetable Ingredients Market Revenue (Million), by Product Type 2024 & 2032
- Figure 32: China APAC Fruit and Vegetable Ingredients Market Volume (K Tons), by Product Type 2024 & 2032
- Figure 33: China APAC Fruit and Vegetable Ingredients Market Revenue Share (%), by Product Type 2024 & 2032
- Figure 34: China APAC Fruit and Vegetable Ingredients Market Volume Share (%), by Product Type 2024 & 2032
- Figure 35: China APAC Fruit and Vegetable Ingredients Market Revenue (Million), by Application 2024 & 2032
- Figure 36: China APAC Fruit and Vegetable Ingredients Market Volume (K Tons), by Application 2024 & 2032
- Figure 37: China APAC Fruit and Vegetable Ingredients Market Revenue Share (%), by Application 2024 & 2032
- Figure 38: China APAC Fruit and Vegetable Ingredients Market Volume Share (%), by Application 2024 & 2032
- Figure 39: China APAC Fruit and Vegetable Ingredients Market Revenue (Million), by Geography 2024 & 2032
- Figure 40: China APAC Fruit and Vegetable Ingredients Market Volume (K Tons), by Geography 2024 & 2032
- Figure 41: China APAC Fruit and Vegetable Ingredients Market Revenue Share (%), by Geography 2024 & 2032
- Figure 42: China APAC Fruit and Vegetable Ingredients Market Volume Share (%), by Geography 2024 & 2032
- Figure 43: China APAC Fruit and Vegetable Ingredients Market Revenue (Million), by Country 2024 & 2032
- Figure 44: China APAC Fruit and Vegetable Ingredients Market Volume (K Tons), by Country 2024 & 2032
- Figure 45: China APAC Fruit and Vegetable Ingredients Market Revenue Share (%), by Country 2024 & 2032
- Figure 46: China APAC Fruit and Vegetable Ingredients Market Volume Share (%), by Country 2024 & 2032
- Figure 47: Japan APAC Fruit and Vegetable Ingredients Market Revenue (Million), by Ingredient Type 2024 & 2032
- Figure 48: Japan APAC Fruit and Vegetable Ingredients Market Volume (K Tons), by Ingredient Type 2024 & 2032
- Figure 49: Japan APAC Fruit and Vegetable Ingredients Market Revenue Share (%), by Ingredient Type 2024 & 2032
- Figure 50: Japan APAC Fruit and Vegetable Ingredients Market Volume Share (%), by Ingredient Type 2024 & 2032
- Figure 51: Japan APAC Fruit and Vegetable Ingredients Market Revenue (Million), by Product Type 2024 & 2032
- Figure 52: Japan APAC Fruit and Vegetable Ingredients Market Volume (K Tons), by Product Type 2024 & 2032
- Figure 53: Japan APAC Fruit and Vegetable Ingredients Market Revenue Share (%), by Product Type 2024 & 2032
- Figure 54: Japan APAC Fruit and Vegetable Ingredients Market Volume Share (%), by Product Type 2024 & 2032
- Figure 55: Japan APAC Fruit and Vegetable Ingredients Market Revenue (Million), by Application 2024 & 2032
- Figure 56: Japan APAC Fruit and Vegetable Ingredients Market Volume (K Tons), by Application 2024 & 2032
- Figure 57: Japan APAC Fruit and Vegetable Ingredients Market Revenue Share (%), by Application 2024 & 2032
- Figure 58: Japan APAC Fruit and Vegetable Ingredients Market Volume Share (%), by Application 2024 & 2032
- Figure 59: Japan APAC Fruit and Vegetable Ingredients Market Revenue (Million), by Geography 2024 & 2032
- Figure 60: Japan APAC Fruit and Vegetable Ingredients Market Volume (K Tons), by Geography 2024 & 2032
- Figure 61: Japan APAC Fruit and Vegetable Ingredients Market Revenue Share (%), by Geography 2024 & 2032
- Figure 62: Japan APAC Fruit and Vegetable Ingredients Market Volume Share (%), by Geography 2024 & 2032
- Figure 63: Japan APAC Fruit and Vegetable Ingredients Market Revenue (Million), by Country 2024 & 2032
- Figure 64: Japan APAC Fruit and Vegetable Ingredients Market Volume (K Tons), by Country 2024 & 2032
- Figure 65: Japan APAC Fruit and Vegetable Ingredients Market Revenue Share (%), by Country 2024 & 2032
- Figure 66: Japan APAC Fruit and Vegetable Ingredients Market Volume Share (%), by Country 2024 & 2032
- Figure 67: India APAC Fruit and Vegetable Ingredients Market Revenue (Million), by Ingredient Type 2024 & 2032
- Figure 68: India APAC Fruit and Vegetable Ingredients Market Volume (K Tons), by Ingredient Type 2024 & 2032
- Figure 69: India APAC Fruit and Vegetable Ingredients Market Revenue Share (%), by Ingredient Type 2024 & 2032
- Figure 70: India APAC Fruit and Vegetable Ingredients Market Volume Share (%), by Ingredient Type 2024 & 2032
- Figure 71: India APAC Fruit and Vegetable Ingredients Market Revenue (Million), by Product Type 2024 & 2032
- Figure 72: India APAC Fruit and Vegetable Ingredients Market Volume (K Tons), by Product Type 2024 & 2032
- Figure 73: India APAC Fruit and Vegetable Ingredients Market Revenue Share (%), by Product Type 2024 & 2032
- Figure 74: India APAC Fruit and Vegetable Ingredients Market Volume Share (%), by Product Type 2024 & 2032
- Figure 75: India APAC Fruit and Vegetable Ingredients Market Revenue (Million), by Application 2024 & 2032
- Figure 76: India APAC Fruit and Vegetable Ingredients Market Volume (K Tons), by Application 2024 & 2032
- Figure 77: India APAC Fruit and Vegetable Ingredients Market Revenue Share (%), by Application 2024 & 2032
- Figure 78: India APAC Fruit and Vegetable Ingredients Market Volume Share (%), by Application 2024 & 2032
- Figure 79: India APAC Fruit and Vegetable Ingredients Market Revenue (Million), by Geography 2024 & 2032
- Figure 80: India APAC Fruit and Vegetable Ingredients Market Volume (K Tons), by Geography 2024 & 2032
- Figure 81: India APAC Fruit and Vegetable Ingredients Market Revenue Share (%), by Geography 2024 & 2032
- Figure 82: India APAC Fruit and Vegetable Ingredients Market Volume Share (%), by Geography 2024 & 2032
- Figure 83: India APAC Fruit and Vegetable Ingredients Market Revenue (Million), by Country 2024 & 2032
- Figure 84: India APAC Fruit and Vegetable Ingredients Market Volume (K Tons), by Country 2024 & 2032
- Figure 85: India APAC Fruit and Vegetable Ingredients Market Revenue Share (%), by Country 2024 & 2032
- Figure 86: India APAC Fruit and Vegetable Ingredients Market Volume Share (%), by Country 2024 & 2032
- Figure 87: Australia APAC Fruit and Vegetable Ingredients Market Revenue (Million), by Ingredient Type 2024 & 2032
- Figure 88: Australia APAC Fruit and Vegetable Ingredients Market Volume (K Tons), by Ingredient Type 2024 & 2032
- Figure 89: Australia APAC Fruit and Vegetable Ingredients Market Revenue Share (%), by Ingredient Type 2024 & 2032
- Figure 90: Australia APAC Fruit and Vegetable Ingredients Market Volume Share (%), by Ingredient Type 2024 & 2032
- Figure 91: Australia APAC Fruit and Vegetable Ingredients Market Revenue (Million), by Product Type 2024 & 2032
- Figure 92: Australia APAC Fruit and Vegetable Ingredients Market Volume (K Tons), by Product Type 2024 & 2032
- Figure 93: Australia APAC Fruit and Vegetable Ingredients Market Revenue Share (%), by Product Type 2024 & 2032
- Figure 94: Australia APAC Fruit and Vegetable Ingredients Market Volume Share (%), by Product Type 2024 & 2032
- Figure 95: Australia APAC Fruit and Vegetable Ingredients Market Revenue (Million), by Application 2024 & 2032
- Figure 96: Australia APAC Fruit and Vegetable Ingredients Market Volume (K Tons), by Application 2024 & 2032
- Figure 97: Australia APAC Fruit and Vegetable Ingredients Market Revenue Share (%), by Application 2024 & 2032
- Figure 98: Australia APAC Fruit and Vegetable Ingredients Market Volume Share (%), by Application 2024 & 2032
- Figure 99: Australia APAC Fruit and Vegetable Ingredients Market Revenue (Million), by Geography 2024 & 2032
- Figure 100: Australia APAC Fruit and Vegetable Ingredients Market Volume (K Tons), by Geography 2024 & 2032
- Figure 101: Australia APAC Fruit and Vegetable Ingredients Market Revenue Share (%), by Geography 2024 & 2032
- Figure 102: Australia APAC Fruit and Vegetable Ingredients Market Volume Share (%), by Geography 2024 & 2032
- Figure 103: Australia APAC Fruit and Vegetable Ingredients Market Revenue (Million), by Country 2024 & 2032
- Figure 104: Australia APAC Fruit and Vegetable Ingredients Market Volume (K Tons), by Country 2024 & 2032
- Figure 105: Australia APAC Fruit and Vegetable Ingredients Market Revenue Share (%), by Country 2024 & 2032
- Figure 106: Australia APAC Fruit and Vegetable Ingredients Market Volume Share (%), by Country 2024 & 2032
- Figure 107: Rest of Asia Pacific APAC Fruit and Vegetable Ingredients Market Revenue (Million), by Ingredient Type 2024 & 2032
- Figure 108: Rest of Asia Pacific APAC Fruit and Vegetable Ingredients Market Volume (K Tons), by Ingredient Type 2024 & 2032
- Figure 109: Rest of Asia Pacific APAC Fruit and Vegetable Ingredients Market Revenue Share (%), by Ingredient Type 2024 & 2032
- Figure 110: Rest of Asia Pacific APAC Fruit and Vegetable Ingredients Market Volume Share (%), by Ingredient Type 2024 & 2032
- Figure 111: Rest of Asia Pacific APAC Fruit and Vegetable Ingredients Market Revenue (Million), by Product Type 2024 & 2032
- Figure 112: Rest of Asia Pacific APAC Fruit and Vegetable Ingredients Market Volume (K Tons), by Product Type 2024 & 2032
- Figure 113: Rest of Asia Pacific APAC Fruit and Vegetable Ingredients Market Revenue Share (%), by Product Type 2024 & 2032
- Figure 114: Rest of Asia Pacific APAC Fruit and Vegetable Ingredients Market Volume Share (%), by Product Type 2024 & 2032
- Figure 115: Rest of Asia Pacific APAC Fruit and Vegetable Ingredients Market Revenue (Million), by Application 2024 & 2032
- Figure 116: Rest of Asia Pacific APAC Fruit and Vegetable Ingredients Market Volume (K Tons), by Application 2024 & 2032
- Figure 117: Rest of Asia Pacific APAC Fruit and Vegetable Ingredients Market Revenue Share (%), by Application 2024 & 2032
- Figure 118: Rest of Asia Pacific APAC Fruit and Vegetable Ingredients Market Volume Share (%), by Application 2024 & 2032
- Figure 119: Rest of Asia Pacific APAC Fruit and Vegetable Ingredients Market Revenue (Million), by Geography 2024 & 2032
- Figure 120: Rest of Asia Pacific APAC Fruit and Vegetable Ingredients Market Volume (K Tons), by Geography 2024 & 2032
- Figure 121: Rest of Asia Pacific APAC Fruit and Vegetable Ingredients Market Revenue Share (%), by Geography 2024 & 2032
- Figure 122: Rest of Asia Pacific APAC Fruit and Vegetable Ingredients Market Volume Share (%), by Geography 2024 & 2032
- Figure 123: Rest of Asia Pacific APAC Fruit and Vegetable Ingredients Market Revenue (Million), by Country 2024 & 2032
- Figure 124: Rest of Asia Pacific APAC Fruit and Vegetable Ingredients Market Volume (K Tons), by Country 2024 & 2032
- Figure 125: Rest of Asia Pacific APAC Fruit and Vegetable Ingredients Market Revenue Share (%), by Country 2024 & 2032
- Figure 126: Rest of Asia Pacific APAC Fruit and Vegetable Ingredients Market Volume Share (%), by Country 2024 & 2032
List of Tables
- Table 1: Global APAC Fruit and Vegetable Ingredients Market Revenue Million Forecast, by Region 2019 & 2032
- Table 2: Global APAC Fruit and Vegetable Ingredients Market Volume K Tons Forecast, by Region 2019 & 2032
- Table 3: Global APAC Fruit and Vegetable Ingredients Market Revenue Million Forecast, by Ingredient Type 2019 & 2032
- Table 4: Global APAC Fruit and Vegetable Ingredients Market Volume K Tons Forecast, by Ingredient Type 2019 & 2032
- Table 5: Global APAC Fruit and Vegetable Ingredients Market Revenue Million Forecast, by Product Type 2019 & 2032
- Table 6: Global APAC Fruit and Vegetable Ingredients Market Volume K Tons Forecast, by Product Type 2019 & 2032
- Table 7: Global APAC Fruit and Vegetable Ingredients Market Revenue Million Forecast, by Application 2019 & 2032
- Table 8: Global APAC Fruit and Vegetable Ingredients Market Volume K Tons Forecast, by Application 2019 & 2032
- Table 9: Global APAC Fruit and Vegetable Ingredients Market Revenue Million Forecast, by Geography 2019 & 2032
- Table 10: Global APAC Fruit and Vegetable Ingredients Market Volume K Tons Forecast, by Geography 2019 & 2032
- Table 11: Global APAC Fruit and Vegetable Ingredients Market Revenue Million Forecast, by Region 2019 & 2032
- Table 12: Global APAC Fruit and Vegetable Ingredients Market Volume K Tons Forecast, by Region 2019 & 2032
- Table 13: Global APAC Fruit and Vegetable Ingredients Market Revenue Million Forecast, by Country 2019 & 2032
- Table 14: Global APAC Fruit and Vegetable Ingredients Market Volume K Tons Forecast, by Country 2019 & 2032
- Table 15: United States APAC Fruit and Vegetable Ingredients Market Revenue (Million) Forecast, by Application 2019 & 2032
- Table 16: United States APAC Fruit and Vegetable Ingredients Market Volume (K Tons) Forecast, by Application 2019 & 2032
- Table 17: Canada APAC Fruit and Vegetable Ingredients Market Revenue (Million) Forecast, by Application 2019 & 2032
- Table 18: Canada APAC Fruit and Vegetable Ingredients Market Volume (K Tons) Forecast, by Application 2019 & 2032
- Table 19: Mexico APAC Fruit and Vegetable Ingredients Market Revenue (Million) Forecast, by Application 2019 & 2032
- Table 20: Mexico APAC Fruit and Vegetable Ingredients Market Volume (K Tons) Forecast, by Application 2019 & 2032
- Table 21: Global APAC Fruit and Vegetable Ingredients Market Revenue Million Forecast, by Country 2019 & 2032
- Table 22: Global APAC Fruit and Vegetable Ingredients Market Volume K Tons Forecast, by Country 2019 & 2032
- Table 23: Germany APAC Fruit and Vegetable Ingredients Market Revenue (Million) Forecast, by Application 2019 & 2032
- Table 24: Germany APAC Fruit and Vegetable Ingredients Market Volume (K Tons) Forecast, by Application 2019 & 2032
- Table 25: United Kingdom APAC Fruit and Vegetable Ingredients Market Revenue (Million) Forecast, by Application 2019 & 2032
- Table 26: United Kingdom APAC Fruit and Vegetable Ingredients Market Volume (K Tons) Forecast, by Application 2019 & 2032
- Table 27: France APAC Fruit and Vegetable Ingredients Market Revenue (Million) Forecast, by Application 2019 & 2032
- Table 28: France APAC Fruit and Vegetable Ingredients Market Volume (K Tons) Forecast, by Application 2019 & 2032
- Table 29: Spain APAC Fruit and Vegetable Ingredients Market Revenue (Million) Forecast, by Application 2019 & 2032
- Table 30: Spain APAC Fruit and Vegetable Ingredients Market Volume (K Tons) Forecast, by Application 2019 & 2032
- Table 31: Italy APAC Fruit and Vegetable Ingredients Market Revenue (Million) Forecast, by Application 2019 & 2032
- Table 32: Italy APAC Fruit and Vegetable Ingredients Market Volume (K Tons) Forecast, by Application 2019 & 2032
- Table 33: Spain APAC Fruit and Vegetable Ingredients Market Revenue (Million) Forecast, by Application 2019 & 2032
- Table 34: Spain APAC Fruit and Vegetable Ingredients Market Volume (K Tons) Forecast, by Application 2019 & 2032
- Table 35: Belgium APAC Fruit and Vegetable Ingredients Market Revenue (Million) Forecast, by Application 2019 & 2032
- Table 36: Belgium APAC Fruit and Vegetable Ingredients Market Volume (K Tons) Forecast, by Application 2019 & 2032
- Table 37: Netherland APAC Fruit and Vegetable Ingredients Market Revenue (Million) Forecast, by Application 2019 & 2032
- Table 38: Netherland APAC Fruit and Vegetable Ingredients Market Volume (K Tons) Forecast, by Application 2019 & 2032
- Table 39: Nordics APAC Fruit and Vegetable Ingredients Market Revenue (Million) Forecast, by Application 2019 & 2032
- Table 40: Nordics APAC Fruit and Vegetable Ingredients Market Volume (K Tons) Forecast, by Application 2019 & 2032
- Table 41: Rest of Europe APAC Fruit and Vegetable Ingredients Market Revenue (Million) Forecast, by Application 2019 & 2032
- Table 42: Rest of Europe APAC Fruit and Vegetable Ingredients Market Volume (K Tons) Forecast, by Application 2019 & 2032
- Table 43: Global APAC Fruit and Vegetable Ingredients Market Revenue Million Forecast, by Country 2019 & 2032
- Table 44: Global APAC Fruit and Vegetable Ingredients Market Volume K Tons Forecast, by Country 2019 & 2032
- Table 45: China APAC Fruit and Vegetable Ingredients Market Revenue (Million) Forecast, by Application 2019 & 2032
- Table 46: China APAC Fruit and Vegetable Ingredients Market Volume (K Tons) Forecast, by Application 2019 & 2032
- Table 47: Japan APAC Fruit and Vegetable Ingredients Market Revenue (Million) Forecast, by Application 2019 & 2032
- Table 48: Japan APAC Fruit and Vegetable Ingredients Market Volume (K Tons) Forecast, by Application 2019 & 2032
- Table 49: India APAC Fruit and Vegetable Ingredients Market Revenue (Million) Forecast, by Application 2019 & 2032
- Table 50: India APAC Fruit and Vegetable Ingredients Market Volume (K Tons) Forecast, by Application 2019 & 2032
- Table 51: South Korea APAC Fruit and Vegetable Ingredients Market Revenue (Million) Forecast, by Application 2019 & 2032
- Table 52: South Korea APAC Fruit and Vegetable Ingredients Market Volume (K Tons) Forecast, by Application 2019 & 2032
- Table 53: Southeast Asia APAC Fruit and Vegetable Ingredients Market Revenue (Million) Forecast, by Application 2019 & 2032
- Table 54: Southeast Asia APAC Fruit and Vegetable Ingredients Market Volume (K Tons) Forecast, by Application 2019 & 2032
- Table 55: Australia APAC Fruit and Vegetable Ingredients Market Revenue (Million) Forecast, by Application 2019 & 2032
- Table 56: Australia APAC Fruit and Vegetable Ingredients Market Volume (K Tons) Forecast, by Application 2019 & 2032
- Table 57: Indonesia APAC Fruit and Vegetable Ingredients Market Revenue (Million) Forecast, by Application 2019 & 2032
- Table 58: Indonesia APAC Fruit and Vegetable Ingredients Market Volume (K Tons) Forecast, by Application 2019 & 2032
- Table 59: Phillipes APAC Fruit and Vegetable Ingredients Market Revenue (Million) Forecast, by Application 2019 & 2032
- Table 60: Phillipes APAC Fruit and Vegetable Ingredients Market Volume (K Tons) Forecast, by Application 2019 & 2032
- Table 61: Singapore APAC Fruit and Vegetable Ingredients Market Revenue (Million) Forecast, by Application 2019 & 2032
- Table 62: Singapore APAC Fruit and Vegetable Ingredients Market Volume (K Tons) Forecast, by Application 2019 & 2032
- Table 63: Thailandc APAC Fruit and Vegetable Ingredients Market Revenue (Million) Forecast, by Application 2019 & 2032
- Table 64: Thailandc APAC Fruit and Vegetable Ingredients Market Volume (K Tons) Forecast, by Application 2019 & 2032
- Table 65: Rest of Asia Pacific APAC Fruit and Vegetable Ingredients Market Revenue (Million) Forecast, by Application 2019 & 2032
- Table 66: Rest of Asia Pacific APAC Fruit and Vegetable Ingredients Market Volume (K Tons) Forecast, by Application 2019 & 2032
- Table 67: Global APAC Fruit and Vegetable Ingredients Market Revenue Million Forecast, by Country 2019 & 2032
- Table 68: Global APAC Fruit and Vegetable Ingredients Market Volume K Tons Forecast, by Country 2019 & 2032
- Table 69: Brazil APAC Fruit and Vegetable Ingredients Market Revenue (Million) Forecast, by Application 2019 & 2032
- Table 70: Brazil APAC Fruit and Vegetable Ingredients Market Volume (K Tons) Forecast, by Application 2019 & 2032
- Table 71: Argentina APAC Fruit and Vegetable Ingredients Market Revenue (Million) Forecast, by Application 2019 & 2032
- Table 72: Argentina APAC Fruit and Vegetable Ingredients Market Volume (K Tons) Forecast, by Application 2019 & 2032
- Table 73: Peru APAC Fruit and Vegetable Ingredients Market Revenue (Million) Forecast, by Application 2019 & 2032
- Table 74: Peru APAC Fruit and Vegetable Ingredients Market Volume (K Tons) Forecast, by Application 2019 & 2032
- Table 75: Chile APAC Fruit and Vegetable Ingredients Market Revenue (Million) Forecast, by Application 2019 & 2032
- Table 76: Chile APAC Fruit and Vegetable Ingredients Market Volume (K Tons) Forecast, by Application 2019 & 2032
- Table 77: Colombia APAC Fruit and Vegetable Ingredients Market Revenue (Million) Forecast, by Application 2019 & 2032
- Table 78: Colombia APAC Fruit and Vegetable Ingredients Market Volume (K Tons) Forecast, by Application 2019 & 2032
- Table 79: Ecuador APAC Fruit and Vegetable Ingredients Market Revenue (Million) Forecast, by Application 2019 & 2032
- Table 80: Ecuador APAC Fruit and Vegetable Ingredients Market Volume (K Tons) Forecast, by Application 2019 & 2032
- Table 81: Venezuela APAC Fruit and Vegetable Ingredients Market Revenue (Million) Forecast, by Application 2019 & 2032
- Table 82: Venezuela APAC Fruit and Vegetable Ingredients Market Volume (K Tons) Forecast, by Application 2019 & 2032
- Table 83: Rest of South America APAC Fruit and Vegetable Ingredients Market Revenue (Million) Forecast, by Application 2019 & 2032
- Table 84: Rest of South America APAC Fruit and Vegetable Ingredients Market Volume (K Tons) Forecast, by Application 2019 & 2032
- Table 85: Global APAC Fruit and Vegetable Ingredients Market Revenue Million Forecast, by Country 2019 & 2032
- Table 86: Global APAC Fruit and Vegetable Ingredients Market Volume K Tons Forecast, by Country 2019 & 2032
- Table 87: United States APAC Fruit and Vegetable Ingredients Market Revenue (Million) Forecast, by Application 2019 & 2032
- Table 88: United States APAC Fruit and Vegetable Ingredients Market Volume (K Tons) Forecast, by Application 2019 & 2032
- Table 89: Canada APAC Fruit and Vegetable Ingredients Market Revenue (Million) Forecast, by Application 2019 & 2032
- Table 90: Canada APAC Fruit and Vegetable Ingredients Market Volume (K Tons) Forecast, by Application 2019 & 2032
- Table 91: Mexico APAC Fruit and Vegetable Ingredients Market Revenue (Million) Forecast, by Application 2019 & 2032
- Table 92: Mexico APAC Fruit and Vegetable Ingredients Market Volume (K Tons) Forecast, by Application 2019 & 2032
- Table 93: Global APAC Fruit and Vegetable Ingredients Market Revenue Million Forecast, by Country 2019 & 2032
- Table 94: Global APAC Fruit and Vegetable Ingredients Market Volume K Tons Forecast, by Country 2019 & 2032
- Table 95: United Arab Emirates APAC Fruit and Vegetable Ingredients Market Revenue (Million) Forecast, by Application 2019 & 2032
- Table 96: United Arab Emirates APAC Fruit and Vegetable Ingredients Market Volume (K Tons) Forecast, by Application 2019 & 2032
- Table 97: Saudi Arabia APAC Fruit and Vegetable Ingredients Market Revenue (Million) Forecast, by Application 2019 & 2032
- Table 98: Saudi Arabia APAC Fruit and Vegetable Ingredients Market Volume (K Tons) Forecast, by Application 2019 & 2032
- Table 99: South Africa APAC Fruit and Vegetable Ingredients Market Revenue (Million) Forecast, by Application 2019 & 2032
- Table 100: South Africa APAC Fruit and Vegetable Ingredients Market Volume (K Tons) Forecast, by Application 2019 & 2032
- Table 101: Rest of Middle East and Africa APAC Fruit and Vegetable Ingredients Market Revenue (Million) Forecast, by Application 2019 & 2032
- Table 102: Rest of Middle East and Africa APAC Fruit and Vegetable Ingredients Market Volume (K Tons) Forecast, by Application 2019 & 2032
- Table 103: Global APAC Fruit and Vegetable Ingredients Market Revenue Million Forecast, by Ingredient Type 2019 & 2032
- Table 104: Global APAC Fruit and Vegetable Ingredients Market Volume K Tons Forecast, by Ingredient Type 2019 & 2032
- Table 105: Global APAC Fruit and Vegetable Ingredients Market Revenue Million Forecast, by Product Type 2019 & 2032
- Table 106: Global APAC Fruit and Vegetable Ingredients Market Volume K Tons Forecast, by Product Type 2019 & 2032
- Table 107: Global APAC Fruit and Vegetable Ingredients Market Revenue Million Forecast, by Application 2019 & 2032
- Table 108: Global APAC Fruit and Vegetable Ingredients Market Volume K Tons Forecast, by Application 2019 & 2032
- Table 109: Global APAC Fruit and Vegetable Ingredients Market Revenue Million Forecast, by Geography 2019 & 2032
- Table 110: Global APAC Fruit and Vegetable Ingredients Market Volume K Tons Forecast, by Geography 2019 & 2032
- Table 111: Global APAC Fruit and Vegetable Ingredients Market Revenue Million Forecast, by Country 2019 & 2032
- Table 112: Global APAC Fruit and Vegetable Ingredients Market Volume K Tons Forecast, by Country 2019 & 2032
- Table 113: Global APAC Fruit and Vegetable Ingredients Market Revenue Million Forecast, by Ingredient Type 2019 & 2032
- Table 114: Global APAC Fruit and Vegetable Ingredients Market Volume K Tons Forecast, by Ingredient Type 2019 & 2032
- Table 115: Global APAC Fruit and Vegetable Ingredients Market Revenue Million Forecast, by Product Type 2019 & 2032
- Table 116: Global APAC Fruit and Vegetable Ingredients Market Volume K Tons Forecast, by Product Type 2019 & 2032
- Table 117: Global APAC Fruit and Vegetable Ingredients Market Revenue Million Forecast, by Application 2019 & 2032
- Table 118: Global APAC Fruit and Vegetable Ingredients Market Volume K Tons Forecast, by Application 2019 & 2032
- Table 119: Global APAC Fruit and Vegetable Ingredients Market Revenue Million Forecast, by Geography 2019 & 2032
- Table 120: Global APAC Fruit and Vegetable Ingredients Market Volume K Tons Forecast, by Geography 2019 & 2032
- Table 121: Global APAC Fruit and Vegetable Ingredients Market Revenue Million Forecast, by Country 2019 & 2032
- Table 122: Global APAC Fruit and Vegetable Ingredients Market Volume K Tons Forecast, by Country 2019 & 2032
- Table 123: Global APAC Fruit and Vegetable Ingredients Market Revenue Million Forecast, by Ingredient Type 2019 & 2032
- Table 124: Global APAC Fruit and Vegetable Ingredients Market Volume K Tons Forecast, by Ingredient Type 2019 & 2032
- Table 125: Global APAC Fruit and Vegetable Ingredients Market Revenue Million Forecast, by Product Type 2019 & 2032
- Table 126: Global APAC Fruit and Vegetable Ingredients Market Volume K Tons Forecast, by Product Type 2019 & 2032
- Table 127: Global APAC Fruit and Vegetable Ingredients Market Revenue Million Forecast, by Application 2019 & 2032
- Table 128: Global APAC Fruit and Vegetable Ingredients Market Volume K Tons Forecast, by Application 2019 & 2032
- Table 129: Global APAC Fruit and Vegetable Ingredients Market Revenue Million Forecast, by Geography 2019 & 2032
- Table 130: Global APAC Fruit and Vegetable Ingredients Market Volume K Tons Forecast, by Geography 2019 & 2032
- Table 131: Global APAC Fruit and Vegetable Ingredients Market Revenue Million Forecast, by Country 2019 & 2032
- Table 132: Global APAC Fruit and Vegetable Ingredients Market Volume K Tons Forecast, by Country 2019 & 2032
- Table 133: Global APAC Fruit and Vegetable Ingredients Market Revenue Million Forecast, by Ingredient Type 2019 & 2032
- Table 134: Global APAC Fruit and Vegetable Ingredients Market Volume K Tons Forecast, by Ingredient Type 2019 & 2032
- Table 135: Global APAC Fruit and Vegetable Ingredients Market Revenue Million Forecast, by Product Type 2019 & 2032
- Table 136: Global APAC Fruit and Vegetable Ingredients Market Volume K Tons Forecast, by Product Type 2019 & 2032
- Table 137: Global APAC Fruit and Vegetable Ingredients Market Revenue Million Forecast, by Application 2019 & 2032
- Table 138: Global APAC Fruit and Vegetable Ingredients Market Volume K Tons Forecast, by Application 2019 & 2032
- Table 139: Global APAC Fruit and Vegetable Ingredients Market Revenue Million Forecast, by Geography 2019 & 2032
- Table 140: Global APAC Fruit and Vegetable Ingredients Market Volume K Tons Forecast, by Geography 2019 & 2032
- Table 141: Global APAC Fruit and Vegetable Ingredients Market Revenue Million Forecast, by Country 2019 & 2032
- Table 142: Global APAC Fruit and Vegetable Ingredients Market Volume K Tons Forecast, by Country 2019 & 2032
- Table 143: Global APAC Fruit and Vegetable Ingredients Market Revenue Million Forecast, by Ingredient Type 2019 & 2032
- Table 144: Global APAC Fruit and Vegetable Ingredients Market Volume K Tons Forecast, by Ingredient Type 2019 & 2032
- Table 145: Global APAC Fruit and Vegetable Ingredients Market Revenue Million Forecast, by Product Type 2019 & 2032
- Table 146: Global APAC Fruit and Vegetable Ingredients Market Volume K Tons Forecast, by Product Type 2019 & 2032
- Table 147: Global APAC Fruit and Vegetable Ingredients Market Revenue Million Forecast, by Application 2019 & 2032
- Table 148: Global APAC Fruit and Vegetable Ingredients Market Volume K Tons Forecast, by Application 2019 & 2032
- Table 149: Global APAC Fruit and Vegetable Ingredients Market Revenue Million Forecast, by Geography 2019 & 2032
- Table 150: Global APAC Fruit and Vegetable Ingredients Market Volume K Tons Forecast, by Geography 2019 & 2032
- Table 151: Global APAC Fruit and Vegetable Ingredients Market Revenue Million Forecast, by Country 2019 & 2032
- Table 152: Global APAC Fruit and Vegetable Ingredients Market Volume K Tons Forecast, by Country 2019 & 2032
Frequently Asked Questions
1. What is the projected Compound Annual Growth Rate (CAGR) of the APAC Fruit and Vegetable Ingredients Market?
The projected CAGR is approximately 4.98%.
2. Which companies are prominent players in the APAC Fruit and Vegetable Ingredients Market?
Key companies in the market include Sunopta, Yaax International Inc *List Not Exhaustive, Dohler Group, Juremont Pty Ltd, AGRANA Beteiligungs-AG, Archer Daniels Midland Company, Sensient Technologies Corporation, Frutarom (Taura Natural Ingredient).
3. What are the main segments of the APAC Fruit and Vegetable Ingredients Market?
The market segments include Ingredient Type, Product Type, Application, Geography.
4. Can you provide details about the market size?
The market size is estimated to be USD XX Million as of 2022.
5. What are some drivers contributing to market growth?
Increasing Demand for Protein-Rich Food; Increasing Demand for Plant-Based and Organic Ingredients.
6. What are the notable trends driving market growth?
Growing Application of Natural Ingredients.
7. Are there any restraints impacting market growth?
Presence of Alternative Proteins.
8. Can you provide examples of recent developments in the market?
N/A
9. What pricing options are available for accessing the report?
Pricing options include single-user, multi-user, and enterprise licenses priced at USD 4750, USD 5250, and USD 8750 respectively.
10. Is the market size provided in terms of value or volume?
The market size is provided in terms of value, measured in Million and volume, measured in K Tons.
11. Are there any specific market keywords associated with the report?
Yes, the market keyword associated with the report is "APAC Fruit and Vegetable Ingredients Market," which aids in identifying and referencing the specific market segment covered.
12. How do I determine which pricing option suits my needs best?
The pricing options vary based on user requirements and access needs. Individual users may opt for single-user licenses, while businesses requiring broader access may choose multi-user or enterprise licenses for cost-effective access to the report.
13. Are there any additional resources or data provided in the APAC Fruit and Vegetable Ingredients Market report?
While the report offers comprehensive insights, it's advisable to review the specific contents or supplementary materials provided to ascertain if additional resources or data are available.
14. How can I stay updated on further developments or reports in the APAC Fruit and Vegetable Ingredients Market?
To stay informed about further developments, trends, and reports in the APAC Fruit and Vegetable Ingredients Market, consider subscribing to industry newsletters, following relevant companies and organizations, or regularly checking reputable industry news sources and publications.
Methodology
Step 1 - Identification of Relevant Samples Size from Population Database


Step 2 - Approaches for Defining Global Market Size (Value, Volume* & Price*)

Note*: In applicable scenarios
Step 3 - Data Sources
Primary Research
- Web Analytics
- Survey Reports
- Research Institute
- Latest Research Reports
- Opinion Leaders
Secondary Research
- Annual Reports
- White Paper
- Latest Press Release
- Industry Association
- Paid Database
- Investor Presentations

Step 4 - Data Triangulation
Involves using different sources of information in order to increase the validity of a study
These sources are likely to be stakeholders in a program - participants, other researchers, program staff, other community members, and so on.
Then we put all data in single framework & apply various statistical tools to find out the dynamic on the market.
During the analysis stage, feedback from the stakeholder groups would be compared to determine areas of agreement as well as areas of divergence


