

Key Insights
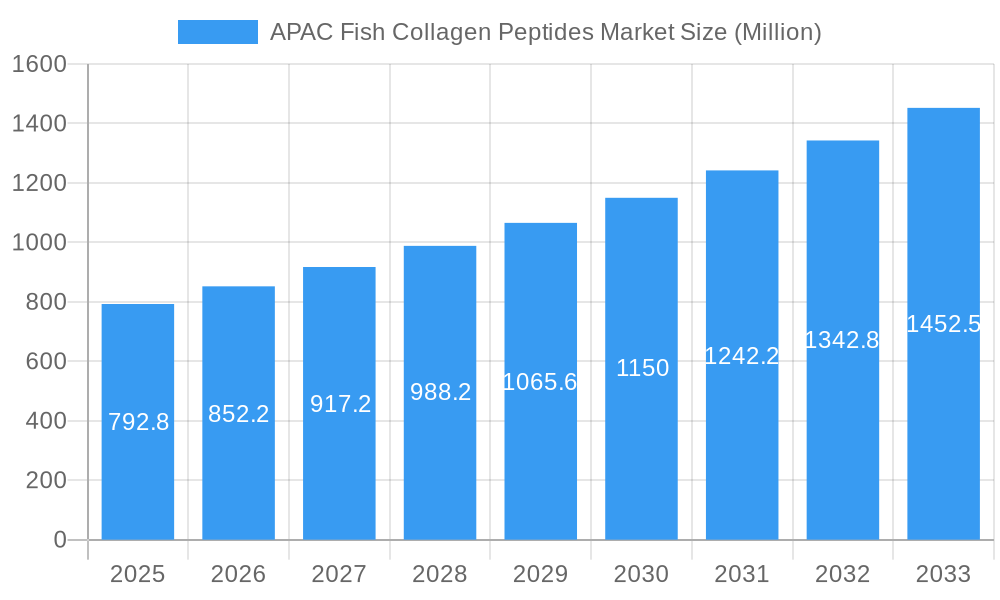
The Asia-Pacific (APAC) fish collagen peptides market is experiencing robust growth, projected to reach \$792.8 million in 2025 and maintain a Compound Annual Growth Rate (CAGR) of 7.6% from 2025 to 2033. This expansion is driven by several key factors. The rising awareness of collagen's benefits for skin health, joint mobility, and overall well-being fuels consumer demand, particularly amongst the increasingly health-conscious populations of China, Japan, South Korea, and India. The preference for natural and sustainable ingredients further bolsters the market, with fish collagen peptides offering a readily available and ethically sourced alternative to animal-based collagen. Furthermore, the expanding e-commerce sector provides convenient access to these products, fueling growth in online retail channels. While the market faces challenges including fluctuating raw material prices and potential regulatory hurdles, the strong consumer interest and innovative product development (e.g., incorporating collagen peptides into functional foods and beverages) are expected to mitigate these restraints and propel continued growth.
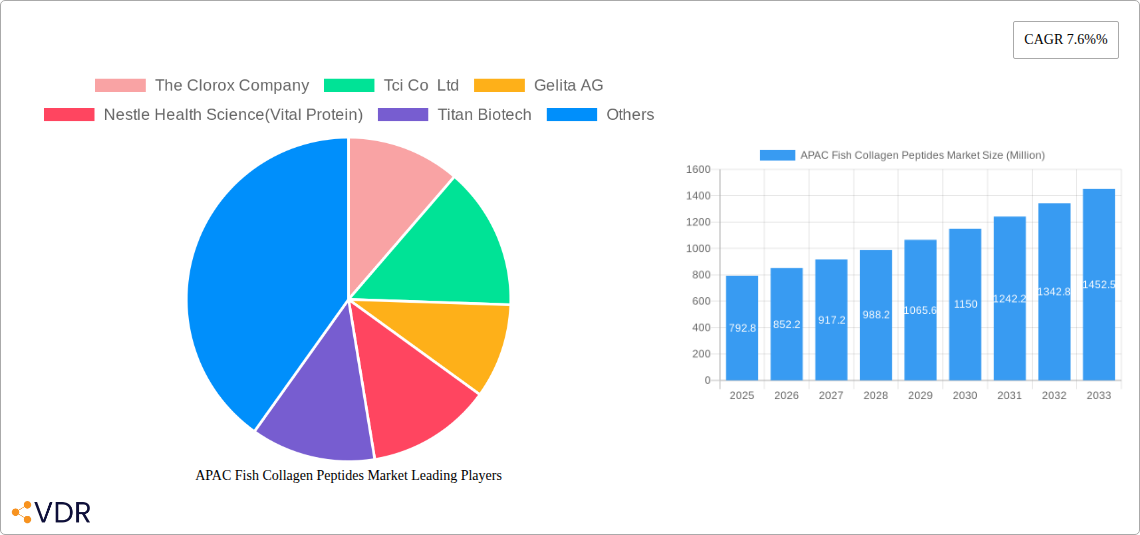
APAC Fish Collagen Peptides Market Market Size (In Million)
The market segmentation reveals a dynamic landscape. While animal-based collagen maintains a significant share, marine-based collagen, including fish collagen peptides, is experiencing faster growth due to its sustainability and ethical appeal. Distribution channels are diverse, encompassing hypermarkets/supermarkets, pharmacies, and a rapidly expanding online presence. Key players like Nestle Health Science (Vital Protein), Gelita AG, and The Clorox Company, along with several regional players, are actively shaping the market through product innovation, strategic partnerships, and aggressive marketing. The APAC region's large and growing population, coupled with increasing disposable incomes and heightened health awareness, positions the fish collagen peptides market for substantial future growth. The competitive landscape is expected to intensify, leading to innovations in product formulations, delivery systems, and marketing strategies.
APAC Fish Collagen Peptides Market Company Market Share
APAC Fish Collagen Peptides Market: A Comprehensive Market Report (2019-2033)
This comprehensive report provides an in-depth analysis of the Asia-Pacific (APAC) fish collagen peptides market, offering invaluable insights for industry professionals, investors, and strategic planners. Covering the period 2019-2033, with a focus on 2025, this report meticulously examines market dynamics, growth trends, dominant segments, and key players, providing a 360° view of this burgeoning sector. The report delves into both the parent market (APAC dietary supplements market) and the child market (APAC fish collagen peptides market) to provide a holistic understanding.
APAC Fish Collagen Peptides Market Dynamics & Structure
The APAC fish collagen peptides market is characterized by moderate concentration, with several key players vying for market share. Technological advancements in extraction and processing methods are driving innovation, while evolving regulatory frameworks influence product development and market access. The market faces competition from alternative protein sources and other joint health supplements. Consumer demographics, particularly the rising middle class with increased health consciousness, are key drivers. M&A activity remains moderate, with a predicted xx number of deals in 2025, primarily focused on expanding product portfolios and geographic reach.
- Market Concentration: Moderately concentrated, with top 5 players holding approximately xx% market share in 2025.
- Technological Innovation: Focus on improved extraction techniques, enhanced bioavailability, and functionalized collagen peptides.
- Regulatory Landscape: Varying regulations across APAC nations impacting product labeling and claims.
- Competitive Substitutes: Plant-based collagen alternatives, other joint health supplements (glucosamine, chondroitin).
- End-User Demographics: Growing middle class, increased health awareness, and aging population fueling demand.
- M&A Activity: xx M&A deals predicted in 2025, primarily driven by expansion strategies.
APAC Fish Collagen Peptides Market Growth Trends & Insights
The APAC fish collagen peptides market experienced robust growth during the historical period (2019-2024), with a CAGR of xx%. This growth is expected to continue through the forecast period (2025-2033), driven by increasing consumer awareness of collagen's benefits for skin health, joint health, and overall wellness. Technological advancements enabling the production of higher-quality, more bioavailable collagen peptides are further propelling market expansion. Changing consumer behavior, favoring natural and functional foods, presents a significant opportunity. Market penetration is expected to reach xx% by 2033. The increasing popularity of online retail channels is also contributing to market growth. Specific consumer segments showing highest adoption rates are xx and xx.
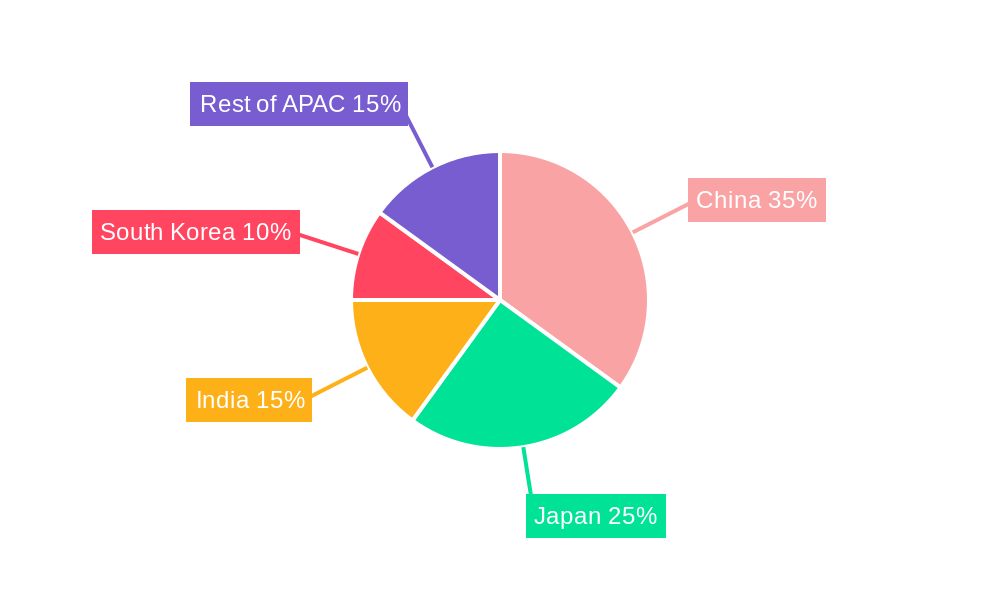
Dominant Regions, Countries, or Segments in APAC Fish Collagen Peptides Market
China and Japan are currently the dominant markets within APAC, driven by high consumer spending on health and wellness products and well-established distribution networks. Within the segment breakdown: Marine-based collagen holds a larger market share (approximately xx%) compared to animal-based collagen, reflecting the strong consumer preference for sustainably sourced ingredients. Internet retailing is a rapidly growing distribution channel, exceeding the growth rates of hypermarkets/supermarkets and pharmacies.
- Key Drivers in China: Strong economic growth, rising disposable incomes, and increasing health consciousness.
- Key Drivers in Japan: Aging population, high awareness of collagen's benefits, and strong demand for premium products.
- Marine-based Collagen Dominance: Consumer preference for sustainability and perceived higher quality.
- Internet Retailing Growth: Convenience, wider product selection, and targeted marketing campaigns.
APAC Fish Collagen Peptides Market Product Landscape
The APAC fish collagen peptides market features a range of products with varying levels of purity, bioavailability, and functional properties. Innovations focus on developing collagen peptides with enhanced absorption rates, unique flavor profiles (e.g., Vital Protein’s Lemon Collagen Peptides), and incorporation into various food and beverage products. Many products emphasize the use of sustainably sourced fish and highlight specific health benefits (e.g., joint support, skin elasticity). The market is witnessing an increase in products combining collagen peptides with other functional ingredients for synergistic effects.
Key Drivers, Barriers & Challenges in APAP Fish Collagen Peptides Market
Key Drivers: Growing awareness of collagen's health benefits, increasing demand for beauty-from-within products, rising disposable incomes in several APAC countries, and expanding online retail channels.
Key Challenges: Fluctuations in raw material prices, stringent regulatory requirements, ensuring consistent product quality, and competition from other health supplements. Supply chain disruptions can lead to price volatility, impacting market growth, estimated at xx% annually.
Emerging Opportunities in APAC Fish Collagen Peptides Market
Untapped markets in Southeast Asia, particularly Indonesia and Vietnam, present significant growth opportunities. The rising popularity of personalized nutrition and functional foods creates avenues for developing customized collagen peptide products. Innovative applications, including incorporation into skincare and haircare products, further expand market potential. Evolving consumer preferences towards plant-based and vegan alternatives are driving the development of novel, sustainable collagen sources.
Growth Accelerators in the APAC Fish Collagen Peptides Market Industry
Technological advancements in collagen extraction and processing, strategic partnerships between ingredient suppliers and consumer goods companies, and successful marketing campaigns highlighting the proven benefits of collagen peptides will drive long-term market expansion. Efforts to improve the sustainability of sourcing fish collagen and address consumer concerns about environmental impact are key to maintaining market growth.
Key Players Shaping the APAC Fish Collagen Peptides Market Market
- The Clorox Company
- Tci Co Ltd
- Gelita AG
- Nestle Health Science (Vital Protein)
- Titan Biotech
- Hangzhou Nutrition Biotechnology Co Ltd
- Optimum Nutrition
- Nature's Bounty Co
- Shiseido Co Ltd
- Ori Bionature (Malaysia) Sdn Bhd
Notable Milestones in APAC Fish Collagen Peptides Market Sector
- February 2022: Vital Protein launched Vital Proteins Lemon Collagen Peptides.
- March 2022: Pura Collagen launched new immune supplements containing bioactive collagen peptides Immupept.
- March 2022: ByHealth launched a new collagen supplement under its Highflex joint health brand.
In-Depth APAC Fish Collagen Peptides Market Market Outlook
The APAC fish collagen peptides market is poised for continued strong growth, driven by several factors including increasing consumer awareness, technological advancements, and expanding distribution channels. Strategic partnerships and new product innovations will be crucial for maintaining a competitive edge. The market presents lucrative opportunities for both established players and new entrants, particularly in emerging markets within the region. The forecast suggests a market value of xx million units by 2033.
APAC Fish Collagen Peptides Market Segmentation
-
1. Source
- 1.1. Animal-based Collagen
- 1.2. Marine-based Collagen
-
2. Distribution Channel
- 2.1. Hypermarket/Supermarket
- 2.2. Pharmacies
- 2.3. Internet Retailing
- 2.4. Other Distribution Channels
APAC Fish Collagen Peptides Market Segmentation By Geography
-
1. North America
- 1.1. United States
- 1.2. Canada
- 1.3. Mexico
-
2. South America
- 2.1. Brazil
- 2.2. Argentina
- 2.3. Rest of South America
-
3. Europe
- 3.1. United Kingdom
- 3.2. Germany
- 3.3. France
- 3.4. Italy
- 3.5. Spain
- 3.6. Russia
- 3.7. Benelux
- 3.8. Nordics
- 3.9. Rest of Europe
-
4. Middle East & Africa
- 4.1. Turkey
- 4.2. Israel
- 4.3. GCC
- 4.4. North Africa
- 4.5. South Africa
- 4.6. Rest of Middle East & Africa
-
5. Asia Pacific
- 5.1. China
- 5.2. India
- 5.3. Japan
- 5.4. South Korea
- 5.5. ASEAN
- 5.6. Oceania
- 5.7. Rest of Asia Pacific
APAC Fish Collagen Peptides Market Regional Market Share
Geographic Coverage of APAC Fish Collagen Peptides Market
APAC Fish Collagen Peptides Market REPORT HIGHLIGHTS
| Aspects | Details |
|---|---|
| Study Period | 2020-2034 |
| Base Year | 2025 |
| Estimated Year | 2026 |
| Forecast Period | 2026-2034 |
| Historical Period | 2020-2025 |
| Growth Rate | CAGR of 7.6%% from 2020-2034 |
| Segmentation |
|
Table of Contents
- 1. Introduction
- 1.1. Research Scope
- 1.2. Market Segmentation
- 1.3. Research Objective
- 1.4. Definitions and Assumptions
- 2. Executive Summary
- 2.1. Market Snapshot
- 3. Market Dynamics
- 3.1. Market Drivers
- 3.2. Market Restrains
- 3.3. Market Trends
- 3.4. Market Opportunities
- 4. Market Factor Analysis
- 4.1. Porters Five Forces
- 4.1.1. Bargaining Power of Suppliers
- 4.1.2. Bargaining Power of Buyers
- 4.1.3. Threat of New Entrants
- 4.1.4. Threat of Substitutes
- 4.1.5. Competitive Rivalry
- 4.2. PESTEL analysis
- 4.3. BCG Analysis
- 4.3.1. Stars (High Growth, High Market Share)
- 4.3.2. Cash Cows (Low Growth, High Market Share)
- 4.3.3. Question Mark (High Growth, Low Market Share)
- 4.3.4. Dogs (Low Growth, Low Market Share)
- 4.4. Ansoff Matrix Analysis
- 4.5. Supply Chain Analysis
- 4.6. Regulatory Landscape
- 4.7. Current Market Potential and Opportunity Assessment (TAM–SAM–SOM Framework)
- 4.8. VDR Analyst Note
- 4.1. Porters Five Forces
- 5. Market Analysis, Insights and Forecast 2021-2033
- 5.1. Market Analysis, Insights and Forecast - by Source
- 5.1.1. Animal-based Collagen
- 5.1.2. Marine-based Collagen
- 5.2. Market Analysis, Insights and Forecast - by Distribution Channel
- 5.2.1. Hypermarket/Supermarket
- 5.2.2. Pharmacies
- 5.2.3. Internet Retailing
- 5.2.4. Other Distribution Channels
- 5.3. Market Analysis, Insights and Forecast - by Region
- 5.3.1. North America
- 5.3.2. South America
- 5.3.3. Europe
- 5.3.4. Middle East & Africa
- 5.3.5. Asia Pacific
- 5.1. Market Analysis, Insights and Forecast - by Source
- 6. Global APAC Fish Collagen Peptides Market Analysis, Insights and Forecast, 2021-2033
- 6.1. Market Analysis, Insights and Forecast - by Source
- 6.1.1. Animal-based Collagen
- 6.1.2. Marine-based Collagen
- 6.2. Market Analysis, Insights and Forecast - by Distribution Channel
- 6.2.1. Hypermarket/Supermarket
- 6.2.2. Pharmacies
- 6.2.3. Internet Retailing
- 6.2.4. Other Distribution Channels
- 6.1. Market Analysis, Insights and Forecast - by Source
- 7. North America APAC Fish Collagen Peptides Market Analysis, Insights and Forecast, 2021-2033
- 7.1. Market Analysis, Insights and Forecast - by Source
- 7.1.1. Animal-based Collagen
- 7.1.2. Marine-based Collagen
- 7.2. Market Analysis, Insights and Forecast - by Distribution Channel
- 7.2.1. Hypermarket/Supermarket
- 7.2.2. Pharmacies
- 7.2.3. Internet Retailing
- 7.2.4. Other Distribution Channels
- 7.1. Market Analysis, Insights and Forecast - by Source
- 8. South America APAC Fish Collagen Peptides Market Analysis, Insights and Forecast, 2021-2033
- 8.1. Market Analysis, Insights and Forecast - by Source
- 8.1.1. Animal-based Collagen
- 8.1.2. Marine-based Collagen
- 8.2. Market Analysis, Insights and Forecast - by Distribution Channel
- 8.2.1. Hypermarket/Supermarket
- 8.2.2. Pharmacies
- 8.2.3. Internet Retailing
- 8.2.4. Other Distribution Channels
- 8.1. Market Analysis, Insights and Forecast - by Source
- 9. Europe APAC Fish Collagen Peptides Market Analysis, Insights and Forecast, 2021-2033
- 9.1. Market Analysis, Insights and Forecast - by Source
- 9.1.1. Animal-based Collagen
- 9.1.2. Marine-based Collagen
- 9.2. Market Analysis, Insights and Forecast - by Distribution Channel
- 9.2.1. Hypermarket/Supermarket
- 9.2.2. Pharmacies
- 9.2.3. Internet Retailing
- 9.2.4. Other Distribution Channels
- 9.1. Market Analysis, Insights and Forecast - by Source
- 10. Middle East & Africa APAC Fish Collagen Peptides Market Analysis, Insights and Forecast, 2021-2033
- 10.1. Market Analysis, Insights and Forecast - by Source
- 10.1.1. Animal-based Collagen
- 10.1.2. Marine-based Collagen
- 10.2. Market Analysis, Insights and Forecast - by Distribution Channel
- 10.2.1. Hypermarket/Supermarket
- 10.2.2. Pharmacies
- 10.2.3. Internet Retailing
- 10.2.4. Other Distribution Channels
- 10.1. Market Analysis, Insights and Forecast - by Source
- 11. Asia Pacific APAC Fish Collagen Peptides Market Analysis, Insights and Forecast, 2021-2033
- 11.1. Market Analysis, Insights and Forecast - by Source
- 11.1.1. Animal-based Collagen
- 11.1.2. Marine-based Collagen
- 11.2. Market Analysis, Insights and Forecast - by Distribution Channel
- 11.2.1. Hypermarket/Supermarket
- 11.2.2. Pharmacies
- 11.2.3. Internet Retailing
- 11.2.4. Other Distribution Channels
- 11.1. Market Analysis, Insights and Forecast - by Source
- 12. Competitive Analysis
- 12.1. Company Profiles
- 12.1.1 The Clorox Company
- 12.1.1.1. Company Overview
- 12.1.1.2. Products
- 12.1.1.3. Company Financials
- 12.1.1.4. SWOT Analysis
- 12.1.2 Tci Co Ltd
- 12.1.2.1. Company Overview
- 12.1.2.2. Products
- 12.1.2.3. Company Financials
- 12.1.2.4. SWOT Analysis
- 12.1.3 Gelita AG
- 12.1.3.1. Company Overview
- 12.1.3.2. Products
- 12.1.3.3. Company Financials
- 12.1.3.4. SWOT Analysis
- 12.1.4 Nestle Health Science(Vital Protein)
- 12.1.4.1. Company Overview
- 12.1.4.2. Products
- 12.1.4.3. Company Financials
- 12.1.4.4. SWOT Analysis
- 12.1.5 Titan Biotech
- 12.1.5.1. Company Overview
- 12.1.5.2. Products
- 12.1.5.3. Company Financials
- 12.1.5.4. SWOT Analysis
- 12.1.6 Hangzhou Nutrition Biotechnology Co Ltd
- 12.1.6.1. Company Overview
- 12.1.6.2. Products
- 12.1.6.3. Company Financials
- 12.1.6.4. SWOT Analysis
- 12.1.7 Optimum Nutrition*List Not Exhaustive
- 12.1.7.1. Company Overview
- 12.1.7.2. Products
- 12.1.7.3. Company Financials
- 12.1.7.4. SWOT Analysis
- 12.1.8 Nature's Bounty Co
- 12.1.8.1. Company Overview
- 12.1.8.2. Products
- 12.1.8.3. Company Financials
- 12.1.8.4. SWOT Analysis
- 12.1.9 Shiseido Co Ltd
- 12.1.9.1. Company Overview
- 12.1.9.2. Products
- 12.1.9.3. Company Financials
- 12.1.9.4. SWOT Analysis
- 12.1.10 Ori Bionature (Malaysia) Sdn Bhd
- 12.1.10.1. Company Overview
- 12.1.10.2. Products
- 12.1.10.3. Company Financials
- 12.1.10.4. SWOT Analysis
- 12.1.1 The Clorox Company
- 12.2. Market Entropy
- 12.2.1 Company's Key Areas Served
- 12.2.2 Recent Developments
- 12.3. Company Market Share Analysis 2025
- 12.3.1 Top 5 Companies Market Share Analysis
- 12.3.2 Top 3 Companies Market Share Analysis
- 12.4. List of Potential Customers
- 13. Research Methodology
List of Figures
- Figure 1: Global APAC Fish Collagen Peptides Market Revenue Breakdown (Million, %) by Region 2025 & 2033
- Figure 2: Global APAC Fish Collagen Peptides Market Volume Breakdown (K Tons, %) by Region 2025 & 2033
- Figure 3: North America APAC Fish Collagen Peptides Market Revenue (Million), by Source 2025 & 2033
- Figure 4: North America APAC Fish Collagen Peptides Market Volume (K Tons), by Source 2025 & 2033
- Figure 5: North America APAC Fish Collagen Peptides Market Revenue Share (%), by Source 2025 & 2033
- Figure 6: North America APAC Fish Collagen Peptides Market Volume Share (%), by Source 2025 & 2033
- Figure 7: North America APAC Fish Collagen Peptides Market Revenue (Million), by Distribution Channel 2025 & 2033
- Figure 8: North America APAC Fish Collagen Peptides Market Volume (K Tons), by Distribution Channel 2025 & 2033
- Figure 9: North America APAC Fish Collagen Peptides Market Revenue Share (%), by Distribution Channel 2025 & 2033
- Figure 10: North America APAC Fish Collagen Peptides Market Volume Share (%), by Distribution Channel 2025 & 2033
- Figure 11: North America APAC Fish Collagen Peptides Market Revenue (Million), by Country 2025 & 2033
- Figure 12: North America APAC Fish Collagen Peptides Market Volume (K Tons), by Country 2025 & 2033
- Figure 13: North America APAC Fish Collagen Peptides Market Revenue Share (%), by Country 2025 & 2033
- Figure 14: North America APAC Fish Collagen Peptides Market Volume Share (%), by Country 2025 & 2033
- Figure 15: South America APAC Fish Collagen Peptides Market Revenue (Million), by Source 2025 & 2033
- Figure 16: South America APAC Fish Collagen Peptides Market Volume (K Tons), by Source 2025 & 2033
- Figure 17: South America APAC Fish Collagen Peptides Market Revenue Share (%), by Source 2025 & 2033
- Figure 18: South America APAC Fish Collagen Peptides Market Volume Share (%), by Source 2025 & 2033
- Figure 19: South America APAC Fish Collagen Peptides Market Revenue (Million), by Distribution Channel 2025 & 2033
- Figure 20: South America APAC Fish Collagen Peptides Market Volume (K Tons), by Distribution Channel 2025 & 2033
- Figure 21: South America APAC Fish Collagen Peptides Market Revenue Share (%), by Distribution Channel 2025 & 2033
- Figure 22: South America APAC Fish Collagen Peptides Market Volume Share (%), by Distribution Channel 2025 & 2033
- Figure 23: South America APAC Fish Collagen Peptides Market Revenue (Million), by Country 2025 & 2033
- Figure 24: South America APAC Fish Collagen Peptides Market Volume (K Tons), by Country 2025 & 2033
- Figure 25: South America APAC Fish Collagen Peptides Market Revenue Share (%), by Country 2025 & 2033
- Figure 26: South America APAC Fish Collagen Peptides Market Volume Share (%), by Country 2025 & 2033
- Figure 27: Europe APAC Fish Collagen Peptides Market Revenue (Million), by Source 2025 & 2033
- Figure 28: Europe APAC Fish Collagen Peptides Market Volume (K Tons), by Source 2025 & 2033
- Figure 29: Europe APAC Fish Collagen Peptides Market Revenue Share (%), by Source 2025 & 2033
- Figure 30: Europe APAC Fish Collagen Peptides Market Volume Share (%), by Source 2025 & 2033
- Figure 31: Europe APAC Fish Collagen Peptides Market Revenue (Million), by Distribution Channel 2025 & 2033
- Figure 32: Europe APAC Fish Collagen Peptides Market Volume (K Tons), by Distribution Channel 2025 & 2033
- Figure 33: Europe APAC Fish Collagen Peptides Market Revenue Share (%), by Distribution Channel 2025 & 2033
- Figure 34: Europe APAC Fish Collagen Peptides Market Volume Share (%), by Distribution Channel 2025 & 2033
- Figure 35: Europe APAC Fish Collagen Peptides Market Revenue (Million), by Country 2025 & 2033
- Figure 36: Europe APAC Fish Collagen Peptides Market Volume (K Tons), by Country 2025 & 2033
- Figure 37: Europe APAC Fish Collagen Peptides Market Revenue Share (%), by Country 2025 & 2033
- Figure 38: Europe APAC Fish Collagen Peptides Market Volume Share (%), by Country 2025 & 2033
- Figure 39: Middle East & Africa APAC Fish Collagen Peptides Market Revenue (Million), by Source 2025 & 2033
- Figure 40: Middle East & Africa APAC Fish Collagen Peptides Market Volume (K Tons), by Source 2025 & 2033
- Figure 41: Middle East & Africa APAC Fish Collagen Peptides Market Revenue Share (%), by Source 2025 & 2033
- Figure 42: Middle East & Africa APAC Fish Collagen Peptides Market Volume Share (%), by Source 2025 & 2033
- Figure 43: Middle East & Africa APAC Fish Collagen Peptides Market Revenue (Million), by Distribution Channel 2025 & 2033
- Figure 44: Middle East & Africa APAC Fish Collagen Peptides Market Volume (K Tons), by Distribution Channel 2025 & 2033
- Figure 45: Middle East & Africa APAC Fish Collagen Peptides Market Revenue Share (%), by Distribution Channel 2025 & 2033
- Figure 46: Middle East & Africa APAC Fish Collagen Peptides Market Volume Share (%), by Distribution Channel 2025 & 2033
- Figure 47: Middle East & Africa APAC Fish Collagen Peptides Market Revenue (Million), by Country 2025 & 2033
- Figure 48: Middle East & Africa APAC Fish Collagen Peptides Market Volume (K Tons), by Country 2025 & 2033
- Figure 49: Middle East & Africa APAC Fish Collagen Peptides Market Revenue Share (%), by Country 2025 & 2033
- Figure 50: Middle East & Africa APAC Fish Collagen Peptides Market Volume Share (%), by Country 2025 & 2033
- Figure 51: Asia Pacific APAC Fish Collagen Peptides Market Revenue (Million), by Source 2025 & 2033
- Figure 52: Asia Pacific APAC Fish Collagen Peptides Market Volume (K Tons), by Source 2025 & 2033
- Figure 53: Asia Pacific APAC Fish Collagen Peptides Market Revenue Share (%), by Source 2025 & 2033
- Figure 54: Asia Pacific APAC Fish Collagen Peptides Market Volume Share (%), by Source 2025 & 2033
- Figure 55: Asia Pacific APAC Fish Collagen Peptides Market Revenue (Million), by Distribution Channel 2025 & 2033
- Figure 56: Asia Pacific APAC Fish Collagen Peptides Market Volume (K Tons), by Distribution Channel 2025 & 2033
- Figure 57: Asia Pacific APAC Fish Collagen Peptides Market Revenue Share (%), by Distribution Channel 2025 & 2033
- Figure 58: Asia Pacific APAC Fish Collagen Peptides Market Volume Share (%), by Distribution Channel 2025 & 2033
- Figure 59: Asia Pacific APAC Fish Collagen Peptides Market Revenue (Million), by Country 2025 & 2033
- Figure 60: Asia Pacific APAC Fish Collagen Peptides Market Volume (K Tons), by Country 2025 & 2033
- Figure 61: Asia Pacific APAC Fish Collagen Peptides Market Revenue Share (%), by Country 2025 & 2033
- Figure 62: Asia Pacific APAC Fish Collagen Peptides Market Volume Share (%), by Country 2025 & 2033
List of Tables
- Table 1: Global APAC Fish Collagen Peptides Market Revenue Million Forecast, by Source 2020 & 2033
- Table 2: Global APAC Fish Collagen Peptides Market Volume K Tons Forecast, by Source 2020 & 2033
- Table 3: Global APAC Fish Collagen Peptides Market Revenue Million Forecast, by Distribution Channel 2020 & 2033
- Table 4: Global APAC Fish Collagen Peptides Market Volume K Tons Forecast, by Distribution Channel 2020 & 2033
- Table 5: Global APAC Fish Collagen Peptides Market Revenue Million Forecast, by Region 2020 & 2033
- Table 6: Global APAC Fish Collagen Peptides Market Volume K Tons Forecast, by Region 2020 & 2033
- Table 7: Global APAC Fish Collagen Peptides Market Revenue Million Forecast, by Source 2020 & 2033
- Table 8: Global APAC Fish Collagen Peptides Market Volume K Tons Forecast, by Source 2020 & 2033
- Table 9: Global APAC Fish Collagen Peptides Market Revenue Million Forecast, by Distribution Channel 2020 & 2033
- Table 10: Global APAC Fish Collagen Peptides Market Volume K Tons Forecast, by Distribution Channel 2020 & 2033
- Table 11: Global APAC Fish Collagen Peptides Market Revenue Million Forecast, by Country 2020 & 2033
- Table 12: Global APAC Fish Collagen Peptides Market Volume K Tons Forecast, by Country 2020 & 2033
- Table 13: United States APAC Fish Collagen Peptides Market Revenue (Million) Forecast, by Application 2020 & 2033
- Table 14: United States APAC Fish Collagen Peptides Market Volume (K Tons) Forecast, by Application 2020 & 2033
- Table 15: Canada APAC Fish Collagen Peptides Market Revenue (Million) Forecast, by Application 2020 & 2033
- Table 16: Canada APAC Fish Collagen Peptides Market Volume (K Tons) Forecast, by Application 2020 & 2033
- Table 17: Mexico APAC Fish Collagen Peptides Market Revenue (Million) Forecast, by Application 2020 & 2033
- Table 18: Mexico APAC Fish Collagen Peptides Market Volume (K Tons) Forecast, by Application 2020 & 2033
- Table 19: Global APAC Fish Collagen Peptides Market Revenue Million Forecast, by Source 2020 & 2033
- Table 20: Global APAC Fish Collagen Peptides Market Volume K Tons Forecast, by Source 2020 & 2033
- Table 21: Global APAC Fish Collagen Peptides Market Revenue Million Forecast, by Distribution Channel 2020 & 2033
- Table 22: Global APAC Fish Collagen Peptides Market Volume K Tons Forecast, by Distribution Channel 2020 & 2033
- Table 23: Global APAC Fish Collagen Peptides Market Revenue Million Forecast, by Country 2020 & 2033
- Table 24: Global APAC Fish Collagen Peptides Market Volume K Tons Forecast, by Country 2020 & 2033
- Table 25: Brazil APAC Fish Collagen Peptides Market Revenue (Million) Forecast, by Application 2020 & 2033
- Table 26: Brazil APAC Fish Collagen Peptides Market Volume (K Tons) Forecast, by Application 2020 & 2033
- Table 27: Argentina APAC Fish Collagen Peptides Market Revenue (Million) Forecast, by Application 2020 & 2033
- Table 28: Argentina APAC Fish Collagen Peptides Market Volume (K Tons) Forecast, by Application 2020 & 2033
- Table 29: Rest of South America APAC Fish Collagen Peptides Market Revenue (Million) Forecast, by Application 2020 & 2033
- Table 30: Rest of South America APAC Fish Collagen Peptides Market Volume (K Tons) Forecast, by Application 2020 & 2033
- Table 31: Global APAC Fish Collagen Peptides Market Revenue Million Forecast, by Source 2020 & 2033
- Table 32: Global APAC Fish Collagen Peptides Market Volume K Tons Forecast, by Source 2020 & 2033
- Table 33: Global APAC Fish Collagen Peptides Market Revenue Million Forecast, by Distribution Channel 2020 & 2033
- Table 34: Global APAC Fish Collagen Peptides Market Volume K Tons Forecast, by Distribution Channel 2020 & 2033
- Table 35: Global APAC Fish Collagen Peptides Market Revenue Million Forecast, by Country 2020 & 2033
- Table 36: Global APAC Fish Collagen Peptides Market Volume K Tons Forecast, by Country 2020 & 2033
- Table 37: United Kingdom APAC Fish Collagen Peptides Market Revenue (Million) Forecast, by Application 2020 & 2033
- Table 38: United Kingdom APAC Fish Collagen Peptides Market Volume (K Tons) Forecast, by Application 2020 & 2033
- Table 39: Germany APAC Fish Collagen Peptides Market Revenue (Million) Forecast, by Application 2020 & 2033
- Table 40: Germany APAC Fish Collagen Peptides Market Volume (K Tons) Forecast, by Application 2020 & 2033
- Table 41: France APAC Fish Collagen Peptides Market Revenue (Million) Forecast, by Application 2020 & 2033
- Table 42: France APAC Fish Collagen Peptides Market Volume (K Tons) Forecast, by Application 2020 & 2033
- Table 43: Italy APAC Fish Collagen Peptides Market Revenue (Million) Forecast, by Application 2020 & 2033
- Table 44: Italy APAC Fish Collagen Peptides Market Volume (K Tons) Forecast, by Application 2020 & 2033
- Table 45: Spain APAC Fish Collagen Peptides Market Revenue (Million) Forecast, by Application 2020 & 2033
- Table 46: Spain APAC Fish Collagen Peptides Market Volume (K Tons) Forecast, by Application 2020 & 2033
- Table 47: Russia APAC Fish Collagen Peptides Market Revenue (Million) Forecast, by Application 2020 & 2033
- Table 48: Russia APAC Fish Collagen Peptides Market Volume (K Tons) Forecast, by Application 2020 & 2033
- Table 49: Benelux APAC Fish Collagen Peptides Market Revenue (Million) Forecast, by Application 2020 & 2033
- Table 50: Benelux APAC Fish Collagen Peptides Market Volume (K Tons) Forecast, by Application 2020 & 2033
- Table 51: Nordics APAC Fish Collagen Peptides Market Revenue (Million) Forecast, by Application 2020 & 2033
- Table 52: Nordics APAC Fish Collagen Peptides Market Volume (K Tons) Forecast, by Application 2020 & 2033
- Table 53: Rest of Europe APAC Fish Collagen Peptides Market Revenue (Million) Forecast, by Application 2020 & 2033
- Table 54: Rest of Europe APAC Fish Collagen Peptides Market Volume (K Tons) Forecast, by Application 2020 & 2033
- Table 55: Global APAC Fish Collagen Peptides Market Revenue Million Forecast, by Source 2020 & 2033
- Table 56: Global APAC Fish Collagen Peptides Market Volume K Tons Forecast, by Source 2020 & 2033
- Table 57: Global APAC Fish Collagen Peptides Market Revenue Million Forecast, by Distribution Channel 2020 & 2033
- Table 58: Global APAC Fish Collagen Peptides Market Volume K Tons Forecast, by Distribution Channel 2020 & 2033
- Table 59: Global APAC Fish Collagen Peptides Market Revenue Million Forecast, by Country 2020 & 2033
- Table 60: Global APAC Fish Collagen Peptides Market Volume K Tons Forecast, by Country 2020 & 2033
- Table 61: Turkey APAC Fish Collagen Peptides Market Revenue (Million) Forecast, by Application 2020 & 2033
- Table 62: Turkey APAC Fish Collagen Peptides Market Volume (K Tons) Forecast, by Application 2020 & 2033
- Table 63: Israel APAC Fish Collagen Peptides Market Revenue (Million) Forecast, by Application 2020 & 2033
- Table 64: Israel APAC Fish Collagen Peptides Market Volume (K Tons) Forecast, by Application 2020 & 2033
- Table 65: GCC APAC Fish Collagen Peptides Market Revenue (Million) Forecast, by Application 2020 & 2033
- Table 66: GCC APAC Fish Collagen Peptides Market Volume (K Tons) Forecast, by Application 2020 & 2033
- Table 67: North Africa APAC Fish Collagen Peptides Market Revenue (Million) Forecast, by Application 2020 & 2033
- Table 68: North Africa APAC Fish Collagen Peptides Market Volume (K Tons) Forecast, by Application 2020 & 2033
- Table 69: South Africa APAC Fish Collagen Peptides Market Revenue (Million) Forecast, by Application 2020 & 2033
- Table 70: South Africa APAC Fish Collagen Peptides Market Volume (K Tons) Forecast, by Application 2020 & 2033
- Table 71: Rest of Middle East & Africa APAC Fish Collagen Peptides Market Revenue (Million) Forecast, by Application 2020 & 2033
- Table 72: Rest of Middle East & Africa APAC Fish Collagen Peptides Market Volume (K Tons) Forecast, by Application 2020 & 2033
- Table 73: Global APAC Fish Collagen Peptides Market Revenue Million Forecast, by Source 2020 & 2033
- Table 74: Global APAC Fish Collagen Peptides Market Volume K Tons Forecast, by Source 2020 & 2033
- Table 75: Global APAC Fish Collagen Peptides Market Revenue Million Forecast, by Distribution Channel 2020 & 2033
- Table 76: Global APAC Fish Collagen Peptides Market Volume K Tons Forecast, by Distribution Channel 2020 & 2033
- Table 77: Global APAC Fish Collagen Peptides Market Revenue Million Forecast, by Country 2020 & 2033
- Table 78: Global APAC Fish Collagen Peptides Market Volume K Tons Forecast, by Country 2020 & 2033
- Table 79: China APAC Fish Collagen Peptides Market Revenue (Million) Forecast, by Application 2020 & 2033
- Table 80: China APAC Fish Collagen Peptides Market Volume (K Tons) Forecast, by Application 2020 & 2033
- Table 81: India APAC Fish Collagen Peptides Market Revenue (Million) Forecast, by Application 2020 & 2033
- Table 82: India APAC Fish Collagen Peptides Market Volume (K Tons) Forecast, by Application 2020 & 2033
- Table 83: Japan APAC Fish Collagen Peptides Market Revenue (Million) Forecast, by Application 2020 & 2033
- Table 84: Japan APAC Fish Collagen Peptides Market Volume (K Tons) Forecast, by Application 2020 & 2033
- Table 85: South Korea APAC Fish Collagen Peptides Market Revenue (Million) Forecast, by Application 2020 & 2033
- Table 86: South Korea APAC Fish Collagen Peptides Market Volume (K Tons) Forecast, by Application 2020 & 2033
- Table 87: ASEAN APAC Fish Collagen Peptides Market Revenue (Million) Forecast, by Application 2020 & 2033
- Table 88: ASEAN APAC Fish Collagen Peptides Market Volume (K Tons) Forecast, by Application 2020 & 2033
- Table 89: Oceania APAC Fish Collagen Peptides Market Revenue (Million) Forecast, by Application 2020 & 2033
- Table 90: Oceania APAC Fish Collagen Peptides Market Volume (K Tons) Forecast, by Application 2020 & 2033
- Table 91: Rest of Asia Pacific APAC Fish Collagen Peptides Market Revenue (Million) Forecast, by Application 2020 & 2033
- Table 92: Rest of Asia Pacific APAC Fish Collagen Peptides Market Volume (K Tons) Forecast, by Application 2020 & 2033
Frequently Asked Questions
1. What is the projected Compound Annual Growth Rate (CAGR) of the APAC Fish Collagen Peptides Market?
The projected CAGR is approximately 7.6%%.
2. Which companies are prominent players in the APAC Fish Collagen Peptides Market?
Key companies in the market include The Clorox Company, Tci Co Ltd, Gelita AG, Nestle Health Science(Vital Protein), Titan Biotech, Hangzhou Nutrition Biotechnology Co Ltd, Optimum Nutrition*List Not Exhaustive, Nature's Bounty Co, Shiseido Co Ltd, Ori Bionature (Malaysia) Sdn Bhd.
3. What are the main segments of the APAC Fish Collagen Peptides Market?
The market segments include Source, Distribution Channel.
4. Can you provide details about the market size?
The market size is estimated to be USD 792.8 Million as of 2022.
5. What are some drivers contributing to market growth?
Rising Demand for Marine-based Collagen.
6. What are the notable trends driving market growth?
Growing Need For Nutritional Supplements.
7. Are there any restraints impacting market growth?
High cost of collagen supplements.
8. Can you provide examples of recent developments in the market?
March 2022: ByHealth, China’s leading vitamin and dietary supplements company, launched a new collagen supplement its Highflex joint health brand.
9. What pricing options are available for accessing the report?
Pricing options include single-user, multi-user, and enterprise licenses priced at USD 4750, USD 5250, and USD 8750 respectively.
10. Is the market size provided in terms of value or volume?
The market size is provided in terms of value, measured in Million and volume, measured in K Tons.
11. Are there any specific market keywords associated with the report?
Yes, the market keyword associated with the report is "APAC Fish Collagen Peptides Market," which aids in identifying and referencing the specific market segment covered.
12. How do I determine which pricing option suits my needs best?
The pricing options vary based on user requirements and access needs. Individual users may opt for single-user licenses, while businesses requiring broader access may choose multi-user or enterprise licenses for cost-effective access to the report.
13. Are there any additional resources or data provided in the APAC Fish Collagen Peptides Market report?
While the report offers comprehensive insights, it's advisable to review the specific contents or supplementary materials provided to ascertain if additional resources or data are available.
14. How can I stay updated on further developments or reports in the APAC Fish Collagen Peptides Market?
To stay informed about further developments, trends, and reports in the APAC Fish Collagen Peptides Market, consider subscribing to industry newsletters, following relevant companies and organizations, or regularly checking reputable industry news sources and publications.
Methodology
Step 1 - Identification of Relevant Samples Size from Population Database


Step 2 - Approaches for Defining Global Market Size (Value, Volume* & Price*)

Note*: In applicable scenarios
Step 3 - Data Sources
Primary Research
- Web Analytics
- Survey Reports
- Research Institute
- Latest Research Reports
- Opinion Leaders
Secondary Research
- Annual Reports
- White Paper
- Latest Press Release
- Industry Association
- Paid Database
- Investor Presentations

Step 4 - Data Triangulation
Involves using different sources of information in order to increase the validity of a study
These sources are likely to be stakeholders in a program - participants, other researchers, program staff, other community members, and so on.
Then we put all data in single framework & apply various statistical tools to find out the dynamic on the market.
During the analysis stage, feedback from the stakeholder groups would be compared to determine areas of agreement as well as areas of divergence