

Key Insights
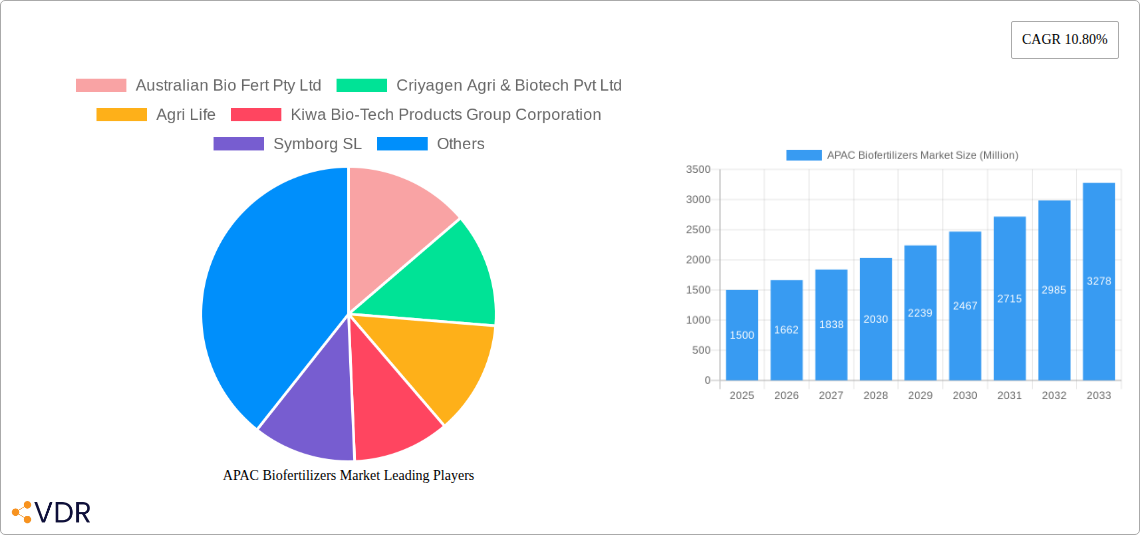
The Asia-Pacific (APAC) biofertilizers market is experiencing robust growth, driven by increasing demand for sustainable agricultural practices and a growing awareness of the environmental impact of chemical fertilizers. The region's large agricultural sector, coupled with rising food security concerns and government initiatives promoting eco-friendly farming methods, are significant catalysts for this expansion. A CAGR of 10.80% indicates a healthy trajectory, suggesting a substantial market expansion over the forecast period (2025-2033). Within APAC, countries like India, China, and Japan are major contributors, owing to their extensive agricultural lands and substantial investments in agricultural technology. The high adoption of biofertilizers in grains & cereals and pulses & oilseeds segments is further fueling market growth. Increased government support in the form of subsidies and awareness campaigns also contribute positively to market expansion. While challenges like inconsistent product quality and a lack of awareness in certain regions persist, the overall outlook for the APAC biofertilizers market remains positive, particularly considering the increasing focus on sustainable and environmentally conscious agricultural practices.
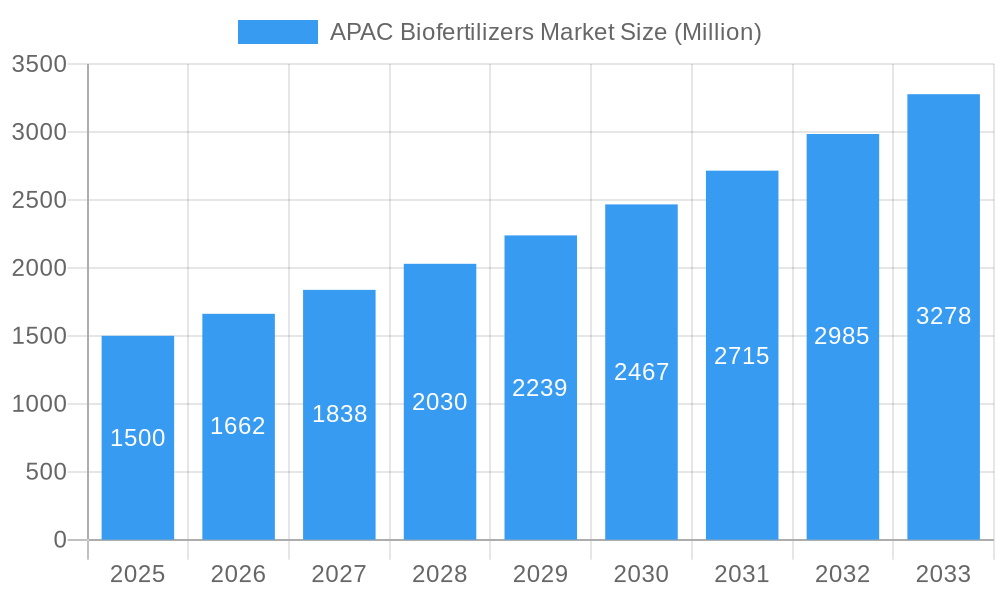
APAC Biofertilizers Market Market Size (In Billion)
The segmentation of the APAC biofertilizers market reveals that Rhizobium, Azospirillum, and other microorganisms are significant contributors due to their efficacy in nitrogen fixation. The application across various crops, particularly grains & cereals, is driving the market's overall growth. Competition amongst established players like Australian Bio Fert Pty Ltd, Criyagen Agri & Biotech Pvt Ltd, and Symborg SL, alongside emerging players, is fostering innovation and improving product quality. This competitive landscape is pushing companies to focus on research and development, leading to the development of more efficient and targeted biofertilizers. The forecast period will likely witness further market consolidation and an increased focus on strategic partnerships and collaborations to gain a wider market reach and distribution network. The market is expected to see significant growth in the adoption of advanced biofertilizers, benefiting from technological advancements and improved formulation techniques.
APAC Biofertilizers Market Company Market Share
APAC Biofertilizers Market: A Comprehensive Report (2019-2033)
This comprehensive report provides an in-depth analysis of the Asia-Pacific (APAC) biofertilizers market, offering invaluable insights for industry professionals, investors, and strategic decision-makers. The report covers the period from 2019 to 2033, with 2025 as the base year and a forecast period from 2025 to 2033. The market is segmented by Microorganism (Rhizobium, Azospirillum, Azotobacter, Blue-Green Algae, Phosphate Solubilizing Bacteria, Mycorrhiza, Other Microorganisms) and Application (Grains & Cereals, Pulses & Oilseeds, Commercial Crops, Fruits & Vegetables, Other Applications). Key players analyzed include Australian Bio Fert Pty Ltd, Criyagen Agri & Biotech Pvt Ltd, Agri Life, Kiwa Bio-Tech Products Group Corporation, Symborg SL, CBF China Biofertilizers AG, Biomax Naturals, Agrinos AS, BioAg Pty Ltd, Camson Biotechnologies Limited, and National Fertilizer Ltd. The total market size in 2025 is estimated at xx Million.
APAC Biofertilizers Market Dynamics & Structure
The APAC biofertilizers market is characterized by moderate concentration, with a few dominant players and numerous smaller regional companies. Technological innovation, particularly in enhancing microbial efficacy and delivery systems, is a key driver. Regulatory frameworks vary across APAC nations, impacting market access and product approvals. Chemical fertilizers remain a significant competitive substitute, but growing environmental concerns and government initiatives promoting sustainable agriculture are shifting the landscape. The end-user demographic is primarily comprised of farmers, with increasing adoption among large-scale commercial farms. M&A activity in the sector has been relatively low in recent years (xx deals in the last five years), but strategic partnerships and collaborations are on the rise.
- Market Concentration: Moderately concentrated, with a few major players holding significant market share (estimated at xx% for the top 3 players in 2025).
- Technological Innovation: Focus on enhanced microbial strains, improved formulation technologies, and targeted delivery systems.
- Regulatory Landscape: Varied across countries, impacting product registration and market entry.
- Competitive Substitutes: Chemical fertilizers remain a major competitor.
- M&A Activity: Relatively low but increasing strategic partnerships observed.
APAC Biofertilizers Market Growth Trends & Insights
The APAC biofertilizers market exhibits robust growth, driven by increasing awareness of sustainable agricultural practices, rising demand for organically produced food, and government support for eco-friendly farming techniques. The market size has grown significantly from xx Million in 2019 to an estimated xx Million in 2025, exhibiting a CAGR of xx% during the historical period (2019-2024). Technological advancements, including the development of novel microbial strains and improved formulation technologies, are further accelerating market growth. Consumer preference for environmentally friendly products is boosting adoption rates among farmers. The market penetration rate for biofertilizers is projected to reach xx% by 2033.
Dominant Regions, Countries, or Segments in APAC Biofertilizers Market
India and China are currently the dominant markets within APAC, accounting for a combined market share of approximately xx% in 2025. Growth is propelled by large agricultural sectors, supportive government policies, and increasing farmer awareness. Within the Microorganism segment, Rhizobium and Phosphate Solubilizing Bacteria exhibit the highest demand due to their widespread applicability across various crops. In terms of application, Grains & Cereals and Pulses & Oilseeds currently dominate, reflecting the large-scale cultivation of these crops in the region.
- Key Growth Drivers:
- Growing awareness of sustainable agriculture
- Increasing demand for organic food products
- Government support and subsidies for biofertilizer usage
- Favorable climatic conditions in certain regions
- Dominant Segments:
- Microorganism: Rhizobium and Phosphate Solubilizing Bacteria
- Application: Grains & Cereals and Pulses & Oilseeds
- Dominant Countries: India and China
APAC Biofertilizers Market Product Landscape
The APAC biofertilizer market showcases a diverse range of products, encompassing liquid and granular formulations tailored to specific crops and soil conditions. Recent innovations include enhanced microbial strains with improved efficacy, slow-release formulations to maximize nutrient availability, and biofertilizer blends optimized for specific nutrient requirements. These advancements are aimed at enhancing crop yields, reducing reliance on chemical inputs, and improving overall soil health. Unique selling propositions include higher nutrient use efficiency, improved stress tolerance in plants, and reduced environmental impact compared to traditional fertilizers.
Key Drivers, Barriers & Challenges in APAC Biofertilizers Market
Key Drivers: Growing environmental awareness, government support for sustainable agriculture, increasing demand for organic produce, technological advancements leading to improved product efficacy.
Key Challenges: High initial investment costs for farmers, inconsistent product quality across different manufacturers, lack of awareness among farmers in certain regions, competition from cheaper chemical fertilizers, and the need for better distribution networks in remote areas. These challenges impact market growth, particularly in less developed regions.
Emerging Opportunities in APAC Biofertilizers Market
Emerging opportunities exist in untapped markets within the APAC region, particularly in Southeast Asia, where the adoption of biofertilizers is still relatively low. Further, the development of biofertilizers tailored for specific niche crops and the integration of biofertilizers with other agricultural technologies present significant potential for market expansion. The growing demand for organic and sustainable agricultural practices creates a favorable environment for sustained market growth.
Growth Accelerators in the APAC Biofertilizers Market Industry
Technological breakthroughs, including advancements in microbial strain development and formulation technologies, are key growth accelerators. Strategic partnerships between biofertilizer companies and agricultural input suppliers can expand market reach and increase adoption rates. Government initiatives to promote sustainable agriculture and provide incentives for biofertilizer usage also significantly contribute to market growth. Market expansion strategies into underserved regions and diversification into new crop applications provide additional growth drivers.
Key Players Shaping the APAC Biofertilizers Market Market
- Australian Bio Fert Pty Ltd
- Criyagen Agri & Biotech Pvt Ltd
- Agri Life
- Kiwa Bio-Tech Products Group Corporation
- Symborg SL
- CBF China Biofertilizers AG
- Biomax Naturals
- Agrinos AS
- BioAg Pty Ltd
- Camson Biotechnologies Limited
- National Fertilizer Ltd
Notable Milestones in APAC Biofertilizers Market Sector
- 2020: Introduction of a new Rhizobium strain with enhanced nitrogen fixation capabilities by Symborg SL.
- 2022: Government of India announces new subsidies for biofertilizer usage.
- 2023: Agrinos AS launches a novel biofertilizer blend for rice cultivation in Southeast Asia.
In-Depth APAC Biofertilizers Market Market Outlook
The APAC biofertilizers market is poised for substantial growth over the forecast period (2025-2033), driven by increasing consumer demand for sustainable agricultural products and supportive government policies. Strategic investments in research and development, combined with effective market expansion strategies, will further accelerate growth. The continued development of innovative biofertilizer products with enhanced efficacy and targeted application will solidify the market's position as a crucial component of sustainable agricultural practices.
APAC Biofertilizers Market Segmentation
- 1. Production Analysis
- 2. Consumption Analysis
- 3. Import Market Analysis (Value & Volume)
- 4. Export Market Analysis (Value & Volume)
- 5. Price Trend Analysis
APAC Biofertilizers Market Segmentation By Geography
-
1. North America
- 1.1. United States
- 1.2. Canada
- 1.3. Mexico
-
2. South America
- 2.1. Brazil
- 2.2. Argentina
- 2.3. Rest of South America
-
3. Europe
- 3.1. United Kingdom
- 3.2. Germany
- 3.3. France
- 3.4. Italy
- 3.5. Spain
- 3.6. Russia
- 3.7. Benelux
- 3.8. Nordics
- 3.9. Rest of Europe
-
4. Middle East & Africa
- 4.1. Turkey
- 4.2. Israel
- 4.3. GCC
- 4.4. North Africa
- 4.5. South Africa
- 4.6. Rest of Middle East & Africa
-
5. Asia Pacific
- 5.1. China
- 5.2. India
- 5.3. Japan
- 5.4. South Korea
- 5.5. ASEAN
- 5.6. Oceania
- 5.7. Rest of Asia Pacific
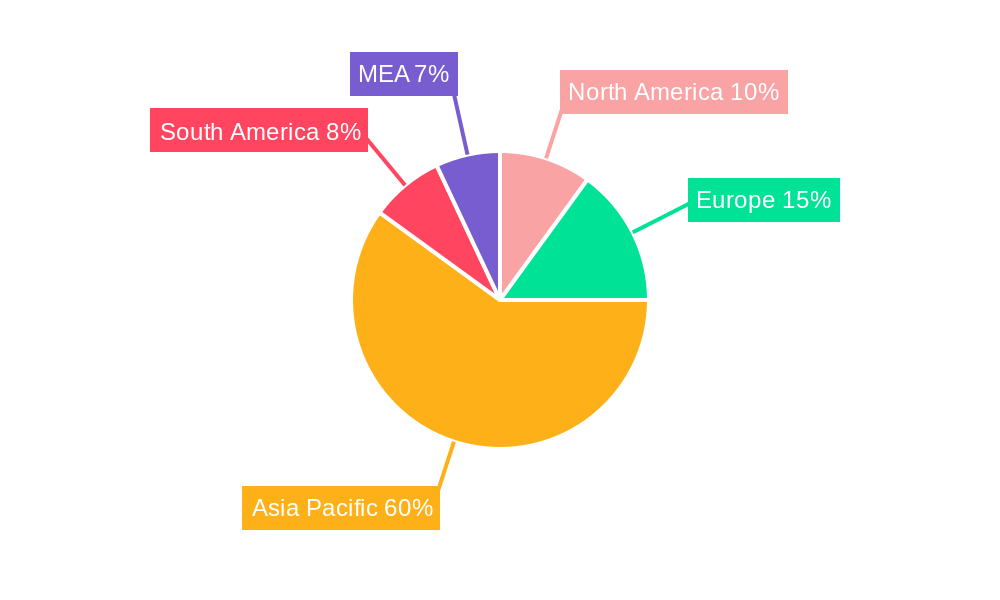
APAC Biofertilizers Market Regional Market Share
Geographic Coverage of APAC Biofertilizers Market
APAC Biofertilizers Market REPORT HIGHLIGHTS
| Aspects | Details |
|---|---|
| Study Period | 2020-2034 |
| Base Year | 2025 |
| Estimated Year | 2026 |
| Forecast Period | 2026-2034 |
| Historical Period | 2020-2025 |
| Growth Rate | CAGR of 13.6% from 2020-2034 |
| Segmentation |
|
Table of Contents
- 1. Introduction
- 1.1. Research Scope
- 1.2. Market Segmentation
- 1.3. Research Objective
- 1.4. Definitions and Assumptions
- 2. Executive Summary
- 2.1. Market Snapshot
- 3. Market Dynamics
- 3.1. Market Drivers
- 3.2. Market Restrains
- 3.3. Market Trends
- 3.4. Market Opportunities
- 4. Market Factor Analysis
- 4.1. Porters Five Forces
- 4.1.1. Bargaining Power of Suppliers
- 4.1.2. Bargaining Power of Buyers
- 4.1.3. Threat of New Entrants
- 4.1.4. Threat of Substitutes
- 4.1.5. Competitive Rivalry
- 4.2. PESTEL analysis
- 4.3. BCG Analysis
- 4.3.1. Stars (High Growth, High Market Share)
- 4.3.2. Cash Cows (Low Growth, High Market Share)
- 4.3.3. Question Mark (High Growth, Low Market Share)
- 4.3.4. Dogs (Low Growth, Low Market Share)
- 4.4. Ansoff Matrix Analysis
- 4.5. Supply Chain Analysis
- 4.6. Regulatory Landscape
- 4.7. Current Market Potential and Opportunity Assessment (TAM–SAM–SOM Framework)
- 4.8. VDR Analyst Note
- 4.1. Porters Five Forces
- 5. Market Analysis, Insights and Forecast 2021-2033
- 5.1. Market Analysis, Insights and Forecast - by Production Analysis
- 5.2. Market Analysis, Insights and Forecast - by Consumption Analysis
- 5.3. Market Analysis, Insights and Forecast - by Import Market Analysis (Value & Volume)
- 5.4. Market Analysis, Insights and Forecast - by Export Market Analysis (Value & Volume)
- 5.5. Market Analysis, Insights and Forecast - by Price Trend Analysis
- 5.6. Market Analysis, Insights and Forecast - by Region
- 5.6.1. North America
- 5.6.2. South America
- 5.6.3. Europe
- 5.6.4. Middle East & Africa
- 5.6.5. Asia Pacific
- 6. Global APAC Biofertilizers Market Analysis, Insights and Forecast, 2021-2033
- 6.1. Market Analysis, Insights and Forecast - by Production Analysis
- 6.2. Market Analysis, Insights and Forecast - by Consumption Analysis
- 6.3. Market Analysis, Insights and Forecast - by Import Market Analysis (Value & Volume)
- 6.4. Market Analysis, Insights and Forecast - by Export Market Analysis (Value & Volume)
- 6.5. Market Analysis, Insights and Forecast - by Price Trend Analysis
- 7. North America APAC Biofertilizers Market Analysis, Insights and Forecast, 2021-2033
- 7.1. Market Analysis, Insights and Forecast - by Production Analysis
- 7.2. Market Analysis, Insights and Forecast - by Consumption Analysis
- 7.3. Market Analysis, Insights and Forecast - by Import Market Analysis (Value & Volume)
- 7.4. Market Analysis, Insights and Forecast - by Export Market Analysis (Value & Volume)
- 7.5. Market Analysis, Insights and Forecast - by Price Trend Analysis
- 8. South America APAC Biofertilizers Market Analysis, Insights and Forecast, 2021-2033
- 8.1. Market Analysis, Insights and Forecast - by Production Analysis
- 8.2. Market Analysis, Insights and Forecast - by Consumption Analysis
- 8.3. Market Analysis, Insights and Forecast - by Import Market Analysis (Value & Volume)
- 8.4. Market Analysis, Insights and Forecast - by Export Market Analysis (Value & Volume)
- 8.5. Market Analysis, Insights and Forecast - by Price Trend Analysis
- 9. Europe APAC Biofertilizers Market Analysis, Insights and Forecast, 2021-2033
- 9.1. Market Analysis, Insights and Forecast - by Production Analysis
- 9.2. Market Analysis, Insights and Forecast - by Consumption Analysis
- 9.3. Market Analysis, Insights and Forecast - by Import Market Analysis (Value & Volume)
- 9.4. Market Analysis, Insights and Forecast - by Export Market Analysis (Value & Volume)
- 9.5. Market Analysis, Insights and Forecast - by Price Trend Analysis
- 10. Middle East & Africa APAC Biofertilizers Market Analysis, Insights and Forecast, 2021-2033
- 10.1. Market Analysis, Insights and Forecast - by Production Analysis
- 10.2. Market Analysis, Insights and Forecast - by Consumption Analysis
- 10.3. Market Analysis, Insights and Forecast - by Import Market Analysis (Value & Volume)
- 10.4. Market Analysis, Insights and Forecast - by Export Market Analysis (Value & Volume)
- 10.5. Market Analysis, Insights and Forecast - by Price Trend Analysis
- 11. Asia Pacific APAC Biofertilizers Market Analysis, Insights and Forecast, 2021-2033
- 11.1. Market Analysis, Insights and Forecast - by Production Analysis
- 11.2. Market Analysis, Insights and Forecast - by Consumption Analysis
- 11.3. Market Analysis, Insights and Forecast - by Import Market Analysis (Value & Volume)
- 11.4. Market Analysis, Insights and Forecast - by Export Market Analysis (Value & Volume)
- 11.5. Market Analysis, Insights and Forecast - by Price Trend Analysis
- 12. Competitive Analysis
- 12.1. Company Profiles
- 12.1.1 Australian Bio Fert Pty Ltd
- 12.1.1.1. Company Overview
- 12.1.1.2. Products
- 12.1.1.3. Company Financials
- 12.1.1.4. SWOT Analysis
- 12.1.2 Criyagen Agri & Biotech Pvt Ltd
- 12.1.2.1. Company Overview
- 12.1.2.2. Products
- 12.1.2.3. Company Financials
- 12.1.2.4. SWOT Analysis
- 12.1.3 Agri Life
- 12.1.3.1. Company Overview
- 12.1.3.2. Products
- 12.1.3.3. Company Financials
- 12.1.3.4. SWOT Analysis
- 12.1.4 Kiwa Bio-Tech Products Group Corporation
- 12.1.4.1. Company Overview
- 12.1.4.2. Products
- 12.1.4.3. Company Financials
- 12.1.4.4. SWOT Analysis
- 12.1.5 Symborg SL
- 12.1.5.1. Company Overview
- 12.1.5.2. Products
- 12.1.5.3. Company Financials
- 12.1.5.4. SWOT Analysis
- 12.1.6 CBF China Biofertilizers AG
- 12.1.6.1. Company Overview
- 12.1.6.2. Products
- 12.1.6.3. Company Financials
- 12.1.6.4. SWOT Analysis
- 12.1.7 Biomax Naturals
- 12.1.7.1. Company Overview
- 12.1.7.2. Products
- 12.1.7.3. Company Financials
- 12.1.7.4. SWOT Analysis
- 12.1.8 Agrinos AS
- 12.1.8.1. Company Overview
- 12.1.8.2. Products
- 12.1.8.3. Company Financials
- 12.1.8.4. SWOT Analysis
- 12.1.9 BioAg Pty Ltd
- 12.1.9.1. Company Overview
- 12.1.9.2. Products
- 12.1.9.3. Company Financials
- 12.1.9.4. SWOT Analysis
- 12.1.10 Camson Biotechnologies Limited
- 12.1.10.1. Company Overview
- 12.1.10.2. Products
- 12.1.10.3. Company Financials
- 12.1.10.4. SWOT Analysis
- 12.1.11 National Fertilizer Ltd
- 12.1.11.1. Company Overview
- 12.1.11.2. Products
- 12.1.11.3. Company Financials
- 12.1.11.4. SWOT Analysis
- 12.1.1 Australian Bio Fert Pty Ltd
- 12.2. Market Entropy
- 12.2.1 Company's Key Areas Served
- 12.2.2 Recent Developments
- 12.3. Company Market Share Analysis 2025
- 12.3.1 Top 5 Companies Market Share Analysis
- 12.3.2 Top 3 Companies Market Share Analysis
- 12.4. List of Potential Customers
- 13. Research Methodology
List of Figures
- Figure 1: Global APAC Biofertilizers Market Revenue Breakdown (million, %) by Region 2025 & 2033
- Figure 2: Global APAC Biofertilizers Market Volume Breakdown (Kiloton, %) by Region 2025 & 2033
- Figure 3: North America APAC Biofertilizers Market Revenue (million), by Production Analysis 2025 & 2033
- Figure 4: North America APAC Biofertilizers Market Volume (Kiloton), by Production Analysis 2025 & 2033
- Figure 5: North America APAC Biofertilizers Market Revenue Share (%), by Production Analysis 2025 & 2033
- Figure 6: North America APAC Biofertilizers Market Volume Share (%), by Production Analysis 2025 & 2033
- Figure 7: North America APAC Biofertilizers Market Revenue (million), by Consumption Analysis 2025 & 2033
- Figure 8: North America APAC Biofertilizers Market Volume (Kiloton), by Consumption Analysis 2025 & 2033
- Figure 9: North America APAC Biofertilizers Market Revenue Share (%), by Consumption Analysis 2025 & 2033
- Figure 10: North America APAC Biofertilizers Market Volume Share (%), by Consumption Analysis 2025 & 2033
- Figure 11: North America APAC Biofertilizers Market Revenue (million), by Import Market Analysis (Value & Volume) 2025 & 2033
- Figure 12: North America APAC Biofertilizers Market Volume (Kiloton), by Import Market Analysis (Value & Volume) 2025 & 2033
- Figure 13: North America APAC Biofertilizers Market Revenue Share (%), by Import Market Analysis (Value & Volume) 2025 & 2033
- Figure 14: North America APAC Biofertilizers Market Volume Share (%), by Import Market Analysis (Value & Volume) 2025 & 2033
- Figure 15: North America APAC Biofertilizers Market Revenue (million), by Export Market Analysis (Value & Volume) 2025 & 2033
- Figure 16: North America APAC Biofertilizers Market Volume (Kiloton), by Export Market Analysis (Value & Volume) 2025 & 2033
- Figure 17: North America APAC Biofertilizers Market Revenue Share (%), by Export Market Analysis (Value & Volume) 2025 & 2033
- Figure 18: North America APAC Biofertilizers Market Volume Share (%), by Export Market Analysis (Value & Volume) 2025 & 2033
- Figure 19: North America APAC Biofertilizers Market Revenue (million), by Price Trend Analysis 2025 & 2033
- Figure 20: North America APAC Biofertilizers Market Volume (Kiloton), by Price Trend Analysis 2025 & 2033
- Figure 21: North America APAC Biofertilizers Market Revenue Share (%), by Price Trend Analysis 2025 & 2033
- Figure 22: North America APAC Biofertilizers Market Volume Share (%), by Price Trend Analysis 2025 & 2033
- Figure 23: North America APAC Biofertilizers Market Revenue (million), by Country 2025 & 2033
- Figure 24: North America APAC Biofertilizers Market Volume (Kiloton), by Country 2025 & 2033
- Figure 25: North America APAC Biofertilizers Market Revenue Share (%), by Country 2025 & 2033
- Figure 26: North America APAC Biofertilizers Market Volume Share (%), by Country 2025 & 2033
- Figure 27: South America APAC Biofertilizers Market Revenue (million), by Production Analysis 2025 & 2033
- Figure 28: South America APAC Biofertilizers Market Volume (Kiloton), by Production Analysis 2025 & 2033
- Figure 29: South America APAC Biofertilizers Market Revenue Share (%), by Production Analysis 2025 & 2033
- Figure 30: South America APAC Biofertilizers Market Volume Share (%), by Production Analysis 2025 & 2033
- Figure 31: South America APAC Biofertilizers Market Revenue (million), by Consumption Analysis 2025 & 2033
- Figure 32: South America APAC Biofertilizers Market Volume (Kiloton), by Consumption Analysis 2025 & 2033
- Figure 33: South America APAC Biofertilizers Market Revenue Share (%), by Consumption Analysis 2025 & 2033
- Figure 34: South America APAC Biofertilizers Market Volume Share (%), by Consumption Analysis 2025 & 2033
- Figure 35: South America APAC Biofertilizers Market Revenue (million), by Import Market Analysis (Value & Volume) 2025 & 2033
- Figure 36: South America APAC Biofertilizers Market Volume (Kiloton), by Import Market Analysis (Value & Volume) 2025 & 2033
- Figure 37: South America APAC Biofertilizers Market Revenue Share (%), by Import Market Analysis (Value & Volume) 2025 & 2033
- Figure 38: South America APAC Biofertilizers Market Volume Share (%), by Import Market Analysis (Value & Volume) 2025 & 2033
- Figure 39: South America APAC Biofertilizers Market Revenue (million), by Export Market Analysis (Value & Volume) 2025 & 2033
- Figure 40: South America APAC Biofertilizers Market Volume (Kiloton), by Export Market Analysis (Value & Volume) 2025 & 2033
- Figure 41: South America APAC Biofertilizers Market Revenue Share (%), by Export Market Analysis (Value & Volume) 2025 & 2033
- Figure 42: South America APAC Biofertilizers Market Volume Share (%), by Export Market Analysis (Value & Volume) 2025 & 2033
- Figure 43: South America APAC Biofertilizers Market Revenue (million), by Price Trend Analysis 2025 & 2033
- Figure 44: South America APAC Biofertilizers Market Volume (Kiloton), by Price Trend Analysis 2025 & 2033
- Figure 45: South America APAC Biofertilizers Market Revenue Share (%), by Price Trend Analysis 2025 & 2033
- Figure 46: South America APAC Biofertilizers Market Volume Share (%), by Price Trend Analysis 2025 & 2033
- Figure 47: South America APAC Biofertilizers Market Revenue (million), by Country 2025 & 2033
- Figure 48: South America APAC Biofertilizers Market Volume (Kiloton), by Country 2025 & 2033
- Figure 49: South America APAC Biofertilizers Market Revenue Share (%), by Country 2025 & 2033
- Figure 50: South America APAC Biofertilizers Market Volume Share (%), by Country 2025 & 2033
- Figure 51: Europe APAC Biofertilizers Market Revenue (million), by Production Analysis 2025 & 2033
- Figure 52: Europe APAC Biofertilizers Market Volume (Kiloton), by Production Analysis 2025 & 2033
- Figure 53: Europe APAC Biofertilizers Market Revenue Share (%), by Production Analysis 2025 & 2033
- Figure 54: Europe APAC Biofertilizers Market Volume Share (%), by Production Analysis 2025 & 2033
- Figure 55: Europe APAC Biofertilizers Market Revenue (million), by Consumption Analysis 2025 & 2033
- Figure 56: Europe APAC Biofertilizers Market Volume (Kiloton), by Consumption Analysis 2025 & 2033
- Figure 57: Europe APAC Biofertilizers Market Revenue Share (%), by Consumption Analysis 2025 & 2033
- Figure 58: Europe APAC Biofertilizers Market Volume Share (%), by Consumption Analysis 2025 & 2033
- Figure 59: Europe APAC Biofertilizers Market Revenue (million), by Import Market Analysis (Value & Volume) 2025 & 2033
- Figure 60: Europe APAC Biofertilizers Market Volume (Kiloton), by Import Market Analysis (Value & Volume) 2025 & 2033
- Figure 61: Europe APAC Biofertilizers Market Revenue Share (%), by Import Market Analysis (Value & Volume) 2025 & 2033
- Figure 62: Europe APAC Biofertilizers Market Volume Share (%), by Import Market Analysis (Value & Volume) 2025 & 2033
- Figure 63: Europe APAC Biofertilizers Market Revenue (million), by Export Market Analysis (Value & Volume) 2025 & 2033
- Figure 64: Europe APAC Biofertilizers Market Volume (Kiloton), by Export Market Analysis (Value & Volume) 2025 & 2033
- Figure 65: Europe APAC Biofertilizers Market Revenue Share (%), by Export Market Analysis (Value & Volume) 2025 & 2033
- Figure 66: Europe APAC Biofertilizers Market Volume Share (%), by Export Market Analysis (Value & Volume) 2025 & 2033
- Figure 67: Europe APAC Biofertilizers Market Revenue (million), by Price Trend Analysis 2025 & 2033
- Figure 68: Europe APAC Biofertilizers Market Volume (Kiloton), by Price Trend Analysis 2025 & 2033
- Figure 69: Europe APAC Biofertilizers Market Revenue Share (%), by Price Trend Analysis 2025 & 2033
- Figure 70: Europe APAC Biofertilizers Market Volume Share (%), by Price Trend Analysis 2025 & 2033
- Figure 71: Europe APAC Biofertilizers Market Revenue (million), by Country 2025 & 2033
- Figure 72: Europe APAC Biofertilizers Market Volume (Kiloton), by Country 2025 & 2033
- Figure 73: Europe APAC Biofertilizers Market Revenue Share (%), by Country 2025 & 2033
- Figure 74: Europe APAC Biofertilizers Market Volume Share (%), by Country 2025 & 2033
- Figure 75: Middle East & Africa APAC Biofertilizers Market Revenue (million), by Production Analysis 2025 & 2033
- Figure 76: Middle East & Africa APAC Biofertilizers Market Volume (Kiloton), by Production Analysis 2025 & 2033
- Figure 77: Middle East & Africa APAC Biofertilizers Market Revenue Share (%), by Production Analysis 2025 & 2033
- Figure 78: Middle East & Africa APAC Biofertilizers Market Volume Share (%), by Production Analysis 2025 & 2033
- Figure 79: Middle East & Africa APAC Biofertilizers Market Revenue (million), by Consumption Analysis 2025 & 2033
- Figure 80: Middle East & Africa APAC Biofertilizers Market Volume (Kiloton), by Consumption Analysis 2025 & 2033
- Figure 81: Middle East & Africa APAC Biofertilizers Market Revenue Share (%), by Consumption Analysis 2025 & 2033
- Figure 82: Middle East & Africa APAC Biofertilizers Market Volume Share (%), by Consumption Analysis 2025 & 2033
- Figure 83: Middle East & Africa APAC Biofertilizers Market Revenue (million), by Import Market Analysis (Value & Volume) 2025 & 2033
- Figure 84: Middle East & Africa APAC Biofertilizers Market Volume (Kiloton), by Import Market Analysis (Value & Volume) 2025 & 2033
- Figure 85: Middle East & Africa APAC Biofertilizers Market Revenue Share (%), by Import Market Analysis (Value & Volume) 2025 & 2033
- Figure 86: Middle East & Africa APAC Biofertilizers Market Volume Share (%), by Import Market Analysis (Value & Volume) 2025 & 2033
- Figure 87: Middle East & Africa APAC Biofertilizers Market Revenue (million), by Export Market Analysis (Value & Volume) 2025 & 2033
- Figure 88: Middle East & Africa APAC Biofertilizers Market Volume (Kiloton), by Export Market Analysis (Value & Volume) 2025 & 2033
- Figure 89: Middle East & Africa APAC Biofertilizers Market Revenue Share (%), by Export Market Analysis (Value & Volume) 2025 & 2033
- Figure 90: Middle East & Africa APAC Biofertilizers Market Volume Share (%), by Export Market Analysis (Value & Volume) 2025 & 2033
- Figure 91: Middle East & Africa APAC Biofertilizers Market Revenue (million), by Price Trend Analysis 2025 & 2033
- Figure 92: Middle East & Africa APAC Biofertilizers Market Volume (Kiloton), by Price Trend Analysis 2025 & 2033
- Figure 93: Middle East & Africa APAC Biofertilizers Market Revenue Share (%), by Price Trend Analysis 2025 & 2033
- Figure 94: Middle East & Africa APAC Biofertilizers Market Volume Share (%), by Price Trend Analysis 2025 & 2033
- Figure 95: Middle East & Africa APAC Biofertilizers Market Revenue (million), by Country 2025 & 2033
- Figure 96: Middle East & Africa APAC Biofertilizers Market Volume (Kiloton), by Country 2025 & 2033
- Figure 97: Middle East & Africa APAC Biofertilizers Market Revenue Share (%), by Country 2025 & 2033
- Figure 98: Middle East & Africa APAC Biofertilizers Market Volume Share (%), by Country 2025 & 2033
- Figure 99: Asia Pacific APAC Biofertilizers Market Revenue (million), by Production Analysis 2025 & 2033
- Figure 100: Asia Pacific APAC Biofertilizers Market Volume (Kiloton), by Production Analysis 2025 & 2033
- Figure 101: Asia Pacific APAC Biofertilizers Market Revenue Share (%), by Production Analysis 2025 & 2033
- Figure 102: Asia Pacific APAC Biofertilizers Market Volume Share (%), by Production Analysis 2025 & 2033
- Figure 103: Asia Pacific APAC Biofertilizers Market Revenue (million), by Consumption Analysis 2025 & 2033
- Figure 104: Asia Pacific APAC Biofertilizers Market Volume (Kiloton), by Consumption Analysis 2025 & 2033
- Figure 105: Asia Pacific APAC Biofertilizers Market Revenue Share (%), by Consumption Analysis 2025 & 2033
- Figure 106: Asia Pacific APAC Biofertilizers Market Volume Share (%), by Consumption Analysis 2025 & 2033
- Figure 107: Asia Pacific APAC Biofertilizers Market Revenue (million), by Import Market Analysis (Value & Volume) 2025 & 2033
- Figure 108: Asia Pacific APAC Biofertilizers Market Volume (Kiloton), by Import Market Analysis (Value & Volume) 2025 & 2033
- Figure 109: Asia Pacific APAC Biofertilizers Market Revenue Share (%), by Import Market Analysis (Value & Volume) 2025 & 2033
- Figure 110: Asia Pacific APAC Biofertilizers Market Volume Share (%), by Import Market Analysis (Value & Volume) 2025 & 2033
- Figure 111: Asia Pacific APAC Biofertilizers Market Revenue (million), by Export Market Analysis (Value & Volume) 2025 & 2033
- Figure 112: Asia Pacific APAC Biofertilizers Market Volume (Kiloton), by Export Market Analysis (Value & Volume) 2025 & 2033
- Figure 113: Asia Pacific APAC Biofertilizers Market Revenue Share (%), by Export Market Analysis (Value & Volume) 2025 & 2033
- Figure 114: Asia Pacific APAC Biofertilizers Market Volume Share (%), by Export Market Analysis (Value & Volume) 2025 & 2033
- Figure 115: Asia Pacific APAC Biofertilizers Market Revenue (million), by Price Trend Analysis 2025 & 2033
- Figure 116: Asia Pacific APAC Biofertilizers Market Volume (Kiloton), by Price Trend Analysis 2025 & 2033
- Figure 117: Asia Pacific APAC Biofertilizers Market Revenue Share (%), by Price Trend Analysis 2025 & 2033
- Figure 118: Asia Pacific APAC Biofertilizers Market Volume Share (%), by Price Trend Analysis 2025 & 2033
- Figure 119: Asia Pacific APAC Biofertilizers Market Revenue (million), by Country 2025 & 2033
- Figure 120: Asia Pacific APAC Biofertilizers Market Volume (Kiloton), by Country 2025 & 2033
- Figure 121: Asia Pacific APAC Biofertilizers Market Revenue Share (%), by Country 2025 & 2033
- Figure 122: Asia Pacific APAC Biofertilizers Market Volume Share (%), by Country 2025 & 2033
List of Tables
- Table 1: Global APAC Biofertilizers Market Revenue million Forecast, by Production Analysis 2020 & 2033
- Table 2: Global APAC Biofertilizers Market Volume Kiloton Forecast, by Production Analysis 2020 & 2033
- Table 3: Global APAC Biofertilizers Market Revenue million Forecast, by Consumption Analysis 2020 & 2033
- Table 4: Global APAC Biofertilizers Market Volume Kiloton Forecast, by Consumption Analysis 2020 & 2033
- Table 5: Global APAC Biofertilizers Market Revenue million Forecast, by Import Market Analysis (Value & Volume) 2020 & 2033
- Table 6: Global APAC Biofertilizers Market Volume Kiloton Forecast, by Import Market Analysis (Value & Volume) 2020 & 2033
- Table 7: Global APAC Biofertilizers Market Revenue million Forecast, by Export Market Analysis (Value & Volume) 2020 & 2033
- Table 8: Global APAC Biofertilizers Market Volume Kiloton Forecast, by Export Market Analysis (Value & Volume) 2020 & 2033
- Table 9: Global APAC Biofertilizers Market Revenue million Forecast, by Price Trend Analysis 2020 & 2033
- Table 10: Global APAC Biofertilizers Market Volume Kiloton Forecast, by Price Trend Analysis 2020 & 2033
- Table 11: Global APAC Biofertilizers Market Revenue million Forecast, by Region 2020 & 2033
- Table 12: Global APAC Biofertilizers Market Volume Kiloton Forecast, by Region 2020 & 2033
- Table 13: Global APAC Biofertilizers Market Revenue million Forecast, by Production Analysis 2020 & 2033
- Table 14: Global APAC Biofertilizers Market Volume Kiloton Forecast, by Production Analysis 2020 & 2033
- Table 15: Global APAC Biofertilizers Market Revenue million Forecast, by Consumption Analysis 2020 & 2033
- Table 16: Global APAC Biofertilizers Market Volume Kiloton Forecast, by Consumption Analysis 2020 & 2033
- Table 17: Global APAC Biofertilizers Market Revenue million Forecast, by Import Market Analysis (Value & Volume) 2020 & 2033
- Table 18: Global APAC Biofertilizers Market Volume Kiloton Forecast, by Import Market Analysis (Value & Volume) 2020 & 2033
- Table 19: Global APAC Biofertilizers Market Revenue million Forecast, by Export Market Analysis (Value & Volume) 2020 & 2033
- Table 20: Global APAC Biofertilizers Market Volume Kiloton Forecast, by Export Market Analysis (Value & Volume) 2020 & 2033
- Table 21: Global APAC Biofertilizers Market Revenue million Forecast, by Price Trend Analysis 2020 & 2033
- Table 22: Global APAC Biofertilizers Market Volume Kiloton Forecast, by Price Trend Analysis 2020 & 2033
- Table 23: Global APAC Biofertilizers Market Revenue million Forecast, by Country 2020 & 2033
- Table 24: Global APAC Biofertilizers Market Volume Kiloton Forecast, by Country 2020 & 2033
- Table 25: United States APAC Biofertilizers Market Revenue (million) Forecast, by Application 2020 & 2033
- Table 26: United States APAC Biofertilizers Market Volume (Kiloton) Forecast, by Application 2020 & 2033
- Table 27: Canada APAC Biofertilizers Market Revenue (million) Forecast, by Application 2020 & 2033
- Table 28: Canada APAC Biofertilizers Market Volume (Kiloton) Forecast, by Application 2020 & 2033
- Table 29: Mexico APAC Biofertilizers Market Revenue (million) Forecast, by Application 2020 & 2033
- Table 30: Mexico APAC Biofertilizers Market Volume (Kiloton) Forecast, by Application 2020 & 2033
- Table 31: Global APAC Biofertilizers Market Revenue million Forecast, by Production Analysis 2020 & 2033
- Table 32: Global APAC Biofertilizers Market Volume Kiloton Forecast, by Production Analysis 2020 & 2033
- Table 33: Global APAC Biofertilizers Market Revenue million Forecast, by Consumption Analysis 2020 & 2033
- Table 34: Global APAC Biofertilizers Market Volume Kiloton Forecast, by Consumption Analysis 2020 & 2033
- Table 35: Global APAC Biofertilizers Market Revenue million Forecast, by Import Market Analysis (Value & Volume) 2020 & 2033
- Table 36: Global APAC Biofertilizers Market Volume Kiloton Forecast, by Import Market Analysis (Value & Volume) 2020 & 2033
- Table 37: Global APAC Biofertilizers Market Revenue million Forecast, by Export Market Analysis (Value & Volume) 2020 & 2033
- Table 38: Global APAC Biofertilizers Market Volume Kiloton Forecast, by Export Market Analysis (Value & Volume) 2020 & 2033
- Table 39: Global APAC Biofertilizers Market Revenue million Forecast, by Price Trend Analysis 2020 & 2033
- Table 40: Global APAC Biofertilizers Market Volume Kiloton Forecast, by Price Trend Analysis 2020 & 2033
- Table 41: Global APAC Biofertilizers Market Revenue million Forecast, by Country 2020 & 2033
- Table 42: Global APAC Biofertilizers Market Volume Kiloton Forecast, by Country 2020 & 2033
- Table 43: Brazil APAC Biofertilizers Market Revenue (million) Forecast, by Application 2020 & 2033
- Table 44: Brazil APAC Biofertilizers Market Volume (Kiloton) Forecast, by Application 2020 & 2033
- Table 45: Argentina APAC Biofertilizers Market Revenue (million) Forecast, by Application 2020 & 2033
- Table 46: Argentina APAC Biofertilizers Market Volume (Kiloton) Forecast, by Application 2020 & 2033
- Table 47: Rest of South America APAC Biofertilizers Market Revenue (million) Forecast, by Application 2020 & 2033
- Table 48: Rest of South America APAC Biofertilizers Market Volume (Kiloton) Forecast, by Application 2020 & 2033
- Table 49: Global APAC Biofertilizers Market Revenue million Forecast, by Production Analysis 2020 & 2033
- Table 50: Global APAC Biofertilizers Market Volume Kiloton Forecast, by Production Analysis 2020 & 2033
- Table 51: Global APAC Biofertilizers Market Revenue million Forecast, by Consumption Analysis 2020 & 2033
- Table 52: Global APAC Biofertilizers Market Volume Kiloton Forecast, by Consumption Analysis 2020 & 2033
- Table 53: Global APAC Biofertilizers Market Revenue million Forecast, by Import Market Analysis (Value & Volume) 2020 & 2033
- Table 54: Global APAC Biofertilizers Market Volume Kiloton Forecast, by Import Market Analysis (Value & Volume) 2020 & 2033
- Table 55: Global APAC Biofertilizers Market Revenue million Forecast, by Export Market Analysis (Value & Volume) 2020 & 2033
- Table 56: Global APAC Biofertilizers Market Volume Kiloton Forecast, by Export Market Analysis (Value & Volume) 2020 & 2033
- Table 57: Global APAC Biofertilizers Market Revenue million Forecast, by Price Trend Analysis 2020 & 2033
- Table 58: Global APAC Biofertilizers Market Volume Kiloton Forecast, by Price Trend Analysis 2020 & 2033
- Table 59: Global APAC Biofertilizers Market Revenue million Forecast, by Country 2020 & 2033
- Table 60: Global APAC Biofertilizers Market Volume Kiloton Forecast, by Country 2020 & 2033
- Table 61: United Kingdom APAC Biofertilizers Market Revenue (million) Forecast, by Application 2020 & 2033
- Table 62: United Kingdom APAC Biofertilizers Market Volume (Kiloton) Forecast, by Application 2020 & 2033
- Table 63: Germany APAC Biofertilizers Market Revenue (million) Forecast, by Application 2020 & 2033
- Table 64: Germany APAC Biofertilizers Market Volume (Kiloton) Forecast, by Application 2020 & 2033
- Table 65: France APAC Biofertilizers Market Revenue (million) Forecast, by Application 2020 & 2033
- Table 66: France APAC Biofertilizers Market Volume (Kiloton) Forecast, by Application 2020 & 2033
- Table 67: Italy APAC Biofertilizers Market Revenue (million) Forecast, by Application 2020 & 2033
- Table 68: Italy APAC Biofertilizers Market Volume (Kiloton) Forecast, by Application 2020 & 2033
- Table 69: Spain APAC Biofertilizers Market Revenue (million) Forecast, by Application 2020 & 2033
- Table 70: Spain APAC Biofertilizers Market Volume (Kiloton) Forecast, by Application 2020 & 2033
- Table 71: Russia APAC Biofertilizers Market Revenue (million) Forecast, by Application 2020 & 2033
- Table 72: Russia APAC Biofertilizers Market Volume (Kiloton) Forecast, by Application 2020 & 2033
- Table 73: Benelux APAC Biofertilizers Market Revenue (million) Forecast, by Application 2020 & 2033
- Table 74: Benelux APAC Biofertilizers Market Volume (Kiloton) Forecast, by Application 2020 & 2033
- Table 75: Nordics APAC Biofertilizers Market Revenue (million) Forecast, by Application 2020 & 2033
- Table 76: Nordics APAC Biofertilizers Market Volume (Kiloton) Forecast, by Application 2020 & 2033
- Table 77: Rest of Europe APAC Biofertilizers Market Revenue (million) Forecast, by Application 2020 & 2033
- Table 78: Rest of Europe APAC Biofertilizers Market Volume (Kiloton) Forecast, by Application 2020 & 2033
- Table 79: Global APAC Biofertilizers Market Revenue million Forecast, by Production Analysis 2020 & 2033
- Table 80: Global APAC Biofertilizers Market Volume Kiloton Forecast, by Production Analysis 2020 & 2033
- Table 81: Global APAC Biofertilizers Market Revenue million Forecast, by Consumption Analysis 2020 & 2033
- Table 82: Global APAC Biofertilizers Market Volume Kiloton Forecast, by Consumption Analysis 2020 & 2033
- Table 83: Global APAC Biofertilizers Market Revenue million Forecast, by Import Market Analysis (Value & Volume) 2020 & 2033
- Table 84: Global APAC Biofertilizers Market Volume Kiloton Forecast, by Import Market Analysis (Value & Volume) 2020 & 2033
- Table 85: Global APAC Biofertilizers Market Revenue million Forecast, by Export Market Analysis (Value & Volume) 2020 & 2033
- Table 86: Global APAC Biofertilizers Market Volume Kiloton Forecast, by Export Market Analysis (Value & Volume) 2020 & 2033
- Table 87: Global APAC Biofertilizers Market Revenue million Forecast, by Price Trend Analysis 2020 & 2033
- Table 88: Global APAC Biofertilizers Market Volume Kiloton Forecast, by Price Trend Analysis 2020 & 2033
- Table 89: Global APAC Biofertilizers Market Revenue million Forecast, by Country 2020 & 2033
- Table 90: Global APAC Biofertilizers Market Volume Kiloton Forecast, by Country 2020 & 2033
- Table 91: Turkey APAC Biofertilizers Market Revenue (million) Forecast, by Application 2020 & 2033
- Table 92: Turkey APAC Biofertilizers Market Volume (Kiloton) Forecast, by Application 2020 & 2033
- Table 93: Israel APAC Biofertilizers Market Revenue (million) Forecast, by Application 2020 & 2033
- Table 94: Israel APAC Biofertilizers Market Volume (Kiloton) Forecast, by Application 2020 & 2033
- Table 95: GCC APAC Biofertilizers Market Revenue (million) Forecast, by Application 2020 & 2033
- Table 96: GCC APAC Biofertilizers Market Volume (Kiloton) Forecast, by Application 2020 & 2033
- Table 97: North Africa APAC Biofertilizers Market Revenue (million) Forecast, by Application 2020 & 2033
- Table 98: North Africa APAC Biofertilizers Market Volume (Kiloton) Forecast, by Application 2020 & 2033
- Table 99: South Africa APAC Biofertilizers Market Revenue (million) Forecast, by Application 2020 & 2033
- Table 100: South Africa APAC Biofertilizers Market Volume (Kiloton) Forecast, by Application 2020 & 2033
- Table 101: Rest of Middle East & Africa APAC Biofertilizers Market Revenue (million) Forecast, by Application 2020 & 2033
- Table 102: Rest of Middle East & Africa APAC Biofertilizers Market Volume (Kiloton) Forecast, by Application 2020 & 2033
- Table 103: Global APAC Biofertilizers Market Revenue million Forecast, by Production Analysis 2020 & 2033
- Table 104: Global APAC Biofertilizers Market Volume Kiloton Forecast, by Production Analysis 2020 & 2033
- Table 105: Global APAC Biofertilizers Market Revenue million Forecast, by Consumption Analysis 2020 & 2033
- Table 106: Global APAC Biofertilizers Market Volume Kiloton Forecast, by Consumption Analysis 2020 & 2033
- Table 107: Global APAC Biofertilizers Market Revenue million Forecast, by Import Market Analysis (Value & Volume) 2020 & 2033
- Table 108: Global APAC Biofertilizers Market Volume Kiloton Forecast, by Import Market Analysis (Value & Volume) 2020 & 2033
- Table 109: Global APAC Biofertilizers Market Revenue million Forecast, by Export Market Analysis (Value & Volume) 2020 & 2033
- Table 110: Global APAC Biofertilizers Market Volume Kiloton Forecast, by Export Market Analysis (Value & Volume) 2020 & 2033
- Table 111: Global APAC Biofertilizers Market Revenue million Forecast, by Price Trend Analysis 2020 & 2033
- Table 112: Global APAC Biofertilizers Market Volume Kiloton Forecast, by Price Trend Analysis 2020 & 2033
- Table 113: Global APAC Biofertilizers Market Revenue million Forecast, by Country 2020 & 2033
- Table 114: Global APAC Biofertilizers Market Volume Kiloton Forecast, by Country 2020 & 2033
- Table 115: China APAC Biofertilizers Market Revenue (million) Forecast, by Application 2020 & 2033
- Table 116: China APAC Biofertilizers Market Volume (Kiloton) Forecast, by Application 2020 & 2033
- Table 117: India APAC Biofertilizers Market Revenue (million) Forecast, by Application 2020 & 2033
- Table 118: India APAC Biofertilizers Market Volume (Kiloton) Forecast, by Application 2020 & 2033
- Table 119: Japan APAC Biofertilizers Market Revenue (million) Forecast, by Application 2020 & 2033
- Table 120: Japan APAC Biofertilizers Market Volume (Kiloton) Forecast, by Application 2020 & 2033
- Table 121: South Korea APAC Biofertilizers Market Revenue (million) Forecast, by Application 2020 & 2033
- Table 122: South Korea APAC Biofertilizers Market Volume (Kiloton) Forecast, by Application 2020 & 2033
- Table 123: ASEAN APAC Biofertilizers Market Revenue (million) Forecast, by Application 2020 & 2033
- Table 124: ASEAN APAC Biofertilizers Market Volume (Kiloton) Forecast, by Application 2020 & 2033
- Table 125: Oceania APAC Biofertilizers Market Revenue (million) Forecast, by Application 2020 & 2033
- Table 126: Oceania APAC Biofertilizers Market Volume (Kiloton) Forecast, by Application 2020 & 2033
- Table 127: Rest of Asia Pacific APAC Biofertilizers Market Revenue (million) Forecast, by Application 2020 & 2033
- Table 128: Rest of Asia Pacific APAC Biofertilizers Market Volume (Kiloton) Forecast, by Application 2020 & 2033
Frequently Asked Questions
1. What is the projected Compound Annual Growth Rate (CAGR) of the APAC Biofertilizers Market?
The projected CAGR is approximately 13.6%.
2. Which companies are prominent players in the APAC Biofertilizers Market?
Key companies in the market include Australian Bio Fert Pty Ltd, Criyagen Agri & Biotech Pvt Ltd, Agri Life, Kiwa Bio-Tech Products Group Corporation, Symborg SL, CBF China Biofertilizers AG, Biomax Naturals, Agrinos AS, BioAg Pty Ltd, Camson Biotechnologies Limited, National Fertilizer Ltd.
3. What are the main segments of the APAC Biofertilizers Market?
The market segments include Production Analysis, Consumption Analysis, Import Market Analysis (Value & Volume), Export Market Analysis (Value & Volume), Price Trend Analysis.
4. Can you provide details about the market size?
The market size is estimated to be USD 293.3 million as of 2022.
5. What are some drivers contributing to market growth?
Seed Treatment As A Solution To Enhance Yield; Growing Awareness For Seed Treatment Among The Farmers; Rising Trend Of Organic Farming.
6. What are the notable trends driving market growth?
Increased Practice for Organic Farming.
7. Are there any restraints impacting market growth?
Limitations Across Farm-Level Seed Treatment; Rising Environmental Concerns.
8. Can you provide examples of recent developments in the market?
N/A
9. What pricing options are available for accessing the report?
Pricing options include single-user, multi-user, and enterprise licenses priced at USD 4750, USD 5250, and USD 8750 respectively.
10. Is the market size provided in terms of value or volume?
The market size is provided in terms of value, measured in million and volume, measured in Kiloton.
11. Are there any specific market keywords associated with the report?
Yes, the market keyword associated with the report is "APAC Biofertilizers Market," which aids in identifying and referencing the specific market segment covered.
12. How do I determine which pricing option suits my needs best?
The pricing options vary based on user requirements and access needs. Individual users may opt for single-user licenses, while businesses requiring broader access may choose multi-user or enterprise licenses for cost-effective access to the report.
13. Are there any additional resources or data provided in the APAC Biofertilizers Market report?
While the report offers comprehensive insights, it's advisable to review the specific contents or supplementary materials provided to ascertain if additional resources or data are available.
14. How can I stay updated on further developments or reports in the APAC Biofertilizers Market?
To stay informed about further developments, trends, and reports in the APAC Biofertilizers Market, consider subscribing to industry newsletters, following relevant companies and organizations, or regularly checking reputable industry news sources and publications.
Methodology
Step 1 - Identification of Relevant Samples Size from Population Database


Step 2 - Approaches for Defining Global Market Size (Value, Volume* & Price*)

Note*: In applicable scenarios
Step 3 - Data Sources
Primary Research
- Web Analytics
- Survey Reports
- Research Institute
- Latest Research Reports
- Opinion Leaders
Secondary Research
- Annual Reports
- White Paper
- Latest Press Release
- Industry Association
- Paid Database
- Investor Presentations

Step 4 - Data Triangulation
Involves using different sources of information in order to increase the validity of a study
These sources are likely to be stakeholders in a program - participants, other researchers, program staff, other community members, and so on.
Then we put all data in single framework & apply various statistical tools to find out the dynamic on the market.
During the analysis stage, feedback from the stakeholder groups would be compared to determine areas of agreement as well as areas of divergence