
Key Insights
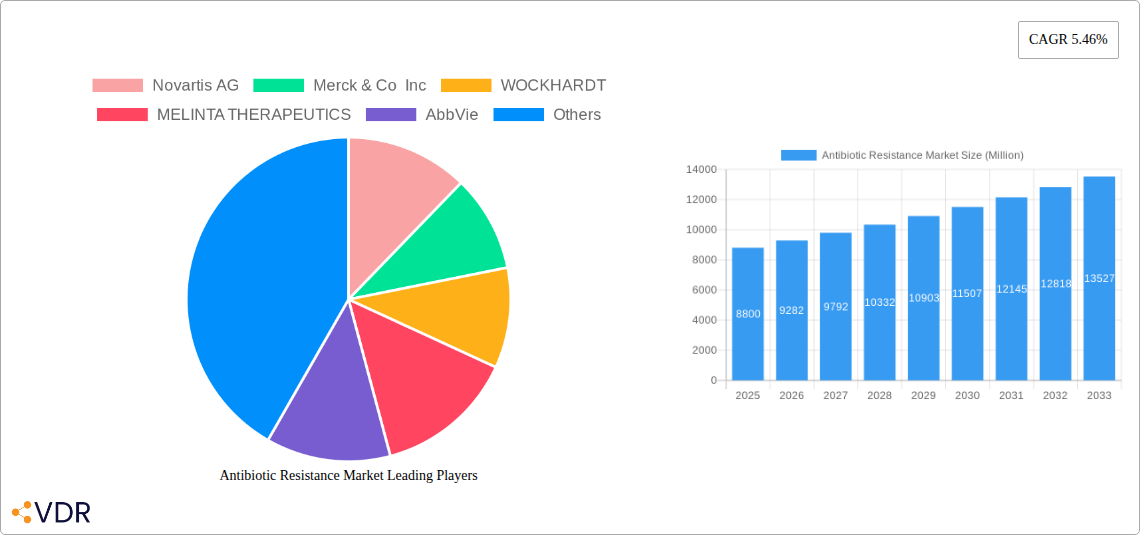
The global antibiotic resistance market, valued at $8.80 billion in 2025, is projected to experience robust growth, driven by the escalating prevalence of drug-resistant infections and the increasing demand for effective treatment options. A compound annual growth rate (CAGR) of 5.46% from 2025 to 2033 indicates a substantial market expansion, reaching an estimated $13.9 billion by 2033. Key drivers include the rising incidence of hospital-acquired infections (HAIs), the emergence of multi-drug resistant pathogens like Acinetobacter baumannii and Staphylococcus aureus, and the limited development pipeline of novel antibiotics. Market segmentation reveals significant opportunities across various distribution channels (hospital pharmacies, retail pharmacies, online pharmacies) and disease indications, including Clostridioides Difficile Infection (CDI), complicated intra-abdominal infections (cIAI), and various bacterial pneumonias. The diverse range of drug classes (tetracyclines, oxazolidinones, cephalosporins, etc.) and mechanisms of action further contribute to market complexity and growth potential. Geographic variations exist, with North America and Europe expected to hold substantial market shares due to higher healthcare expenditure and advanced healthcare infrastructure. However, Asia Pacific is anticipated to witness significant growth driven by increasing healthcare awareness and rising prevalence of infectious diseases. Restraints to market growth include stringent regulatory approvals for new antibiotics, high research and development costs, and the potential for adverse effects associated with antibiotic use.
The competitive landscape is characterized by a mix of large pharmaceutical companies like Novartis AG, Merck & Co. Inc., and Pfizer Inc., alongside smaller, specialized firms focused on developing innovative antibiotic therapies. Strategic partnerships, mergers, and acquisitions are likely to shape the market dynamics in the coming years. The increasing focus on personalized medicine and the development of diagnostic tools to identify resistant pathogens could further fuel market growth. Addressing the growing challenge of antibiotic resistance requires a multi-pronged approach, encompassing research and development of new drugs, responsible antibiotic stewardship, and enhanced infection control practices. The market's future trajectory will depend significantly on the success of ongoing research efforts, regulatory approvals, and the adoption of innovative treatment strategies. Further research into novel mechanisms of action and alternative therapeutic approaches, like bacteriophages, is crucial to combat the escalating threat of antibiotic resistance.
Antibiotic Resistance Market: A Comprehensive Report (2019-2033)
This comprehensive report provides an in-depth analysis of the Antibiotic Resistance Market, encompassing market dynamics, growth trends, regional segmentation, product landscape, key players, and future outlook. The study period spans from 2019 to 2033, with 2025 serving as the base and estimated year. This report is crucial for industry professionals, investors, and researchers seeking a thorough understanding of this critical market. The report examines both the parent market of infectious disease treatments and the child market specifically addressing antibiotic resistance.
Antibiotic Resistance Market Dynamics & Structure
The Antibiotic Resistance Market is characterized by a moderately concentrated structure, with key players like Novartis AG, Merck & Co Inc, and Pfizer Inc holding significant market share. Technological innovation, particularly in novel drug mechanisms and delivery systems, is a key driver. Stringent regulatory frameworks governing antibiotic development and approval pose challenges but also ensure patient safety. The market faces competition from alternative therapies, including phage therapy and antimicrobial peptides. End-user demographics, primarily hospitals and healthcare facilities, influence market demand. The historical period (2019-2024) saw a modest number of M&A deals (xx), primarily focused on strengthening R&D pipelines. The forecast period (2025-2033) anticipates an increase in M&A activity (xx) driven by the need to expand product portfolios and address the growing resistance problem.
- Market Concentration: Moderately concentrated, with top 10 players holding xx% market share in 2025.
- Technological Innovation: Focus on novel drug mechanisms (e.g., RNA synthesis inhibitors), targeted therapies, and combination therapies.
- Regulatory Landscape: Stringent approval processes and post-market surveillance impacting development timelines and costs.
- Competitive Substitutes: Growth of alternative therapies (e.g., phage therapy) creating competitive pressure.
- M&A Activity: Historical period (2019-2024): xx deals; Forecast period (2025-2033): Projected xx deals.
- Innovation Barriers: High R&D costs, lengthy regulatory pathways, and limited profitability due to restricted antibiotic use.
Antibiotic Resistance Market Growth Trends & Insights
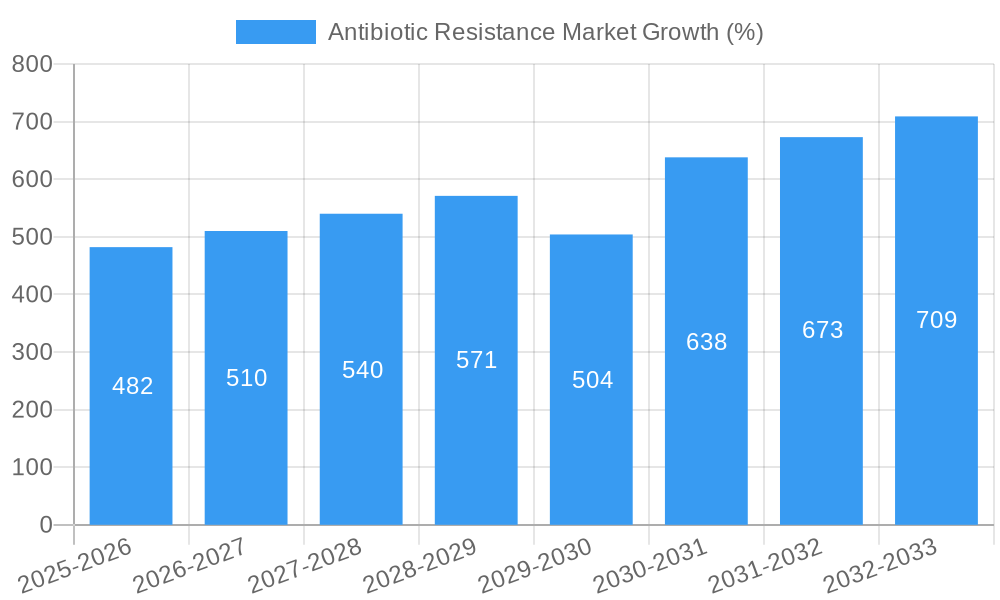
The Antibiotic Resistance Market is witnessing substantial growth, driven by the rising prevalence of drug-resistant infections globally. The market size is projected to reach xx Million by 2033, exhibiting a CAGR of xx% during the forecast period (2025-2033). Adoption rates are increasing due to the escalating threat of untreatable infections. Technological disruptions, including the development of rapid diagnostic tests and advanced drug delivery systems, are accelerating market growth. Consumer behavior shifts, including increased awareness of antibiotic resistance and a greater demand for effective treatment options, are also impacting the market. Market penetration is expected to increase significantly, particularly in developing countries facing a high burden of infectious diseases. The historical period shows a steady increase in market size, with a significant jump anticipated in the coming years due to several factors such as the increase in the aging population, increased awareness, and launch of new treatment options.
Dominant Regions, Countries, or Segments in Antibiotic Resistance Market
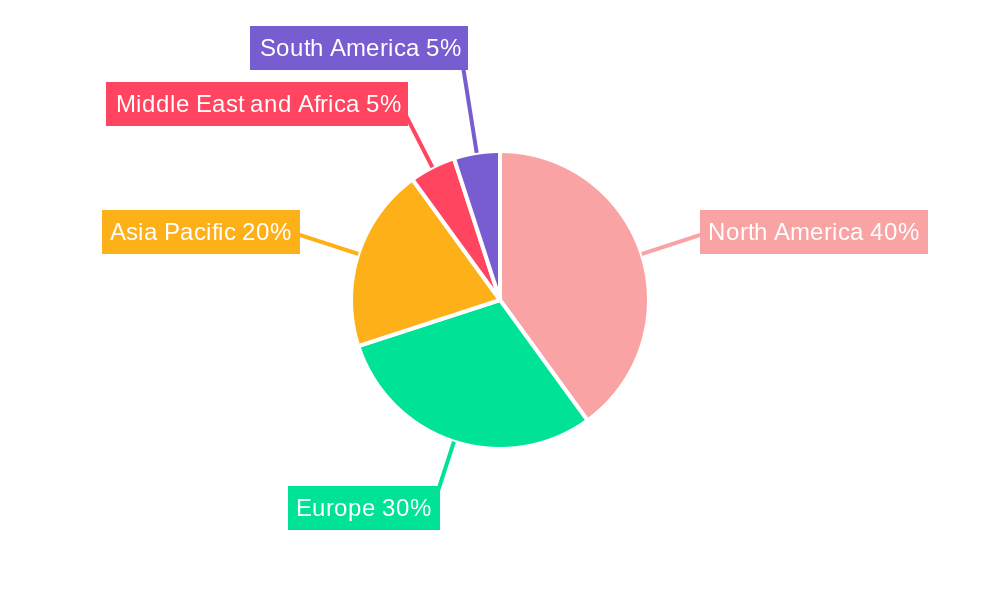
North America currently dominates the Antibiotic Resistance Market, driven by high healthcare expenditure, advanced healthcare infrastructure, and a significant prevalence of antibiotic-resistant infections. Within this region, the United States holds the largest market share. Europe is another key market, with Germany, France, and the UK representing significant contributors. The Asia-Pacific region exhibits high growth potential due to a rapidly growing population, increasing healthcare spending, and a significant burden of infectious diseases. Within specific segments, the Hospital Pharmacies channel dominates distribution owing to the high concentration of patients with serious infections. Among diseases, Complicated Intra-abdominal Infection (cIAI) and Hospital-Acquired and Ventilator-Associated Bacterial Pneumonias (HABP) contribute significantly due to their severity and resistance profile. Staphylococcus aureus and Acinetobacter baumannii are leading pathogens driving market demand, followed by E. Coli and Pseudomonas aeruginosa. Cephalosporins and combination therapies represent the largest drug classes. Cell wall synthesis inhibitors are the most prevalent mechanism of action among currently used drugs.
- Regional Dominance: North America (highest market share), followed by Europe and Asia-Pacific (high growth potential).
- Country-level Dominance: United States (highest market share in North America), Germany (highest market share in Europe).
- Segment Dominance: Hospital Pharmacies (distribution channel), cIAI and HABP (diseases), Staphylococcus aureus and Acinetobacter baumannii (pathogens), Cephalosporins and combination therapies (drug class), Cell wall synthesis inhibitors (mechanism of action).
Antibiotic Resistance Market Product Landscape
The Antibiotic Resistance Market features a diverse range of products, including novel antibiotics, combination therapies, and diagnostic tools. Product innovations are focused on overcoming resistance mechanisms, improving efficacy, and reducing side effects. Advanced drug delivery systems are being developed to enhance therapeutic outcomes and patient compliance. Many companies are investing heavily to improve the speed and accuracy of diagnostic tools to improve treatment choice and improve patient outcomes. Unique selling propositions emphasize improved efficacy against multi-drug resistant pathogens and reduced side effects.
Key Drivers, Barriers & Challenges in Antibiotic Resistance Market
Key Drivers:
- Rising prevalence of antibiotic-resistant infections.
- Increasing healthcare expenditure and investment in R&D.
- Growing awareness of the threat of antibiotic resistance.
- Development of novel antibiotics and combination therapies.
Challenges and Restraints:
- High cost of antibiotic development and regulatory hurdles.
- Limited profitability due to restricted antibiotic use.
- Emergence of new resistance mechanisms.
- Supply chain disruptions impacting drug availability.
Emerging Opportunities in Antibiotic Resistance Market
- Development of novel antibiotics targeting specific resistance mechanisms.
- Expansion into untapped markets in developing countries.
- Application of artificial intelligence and machine learning in drug discovery.
- Growing demand for rapid diagnostic tests and personalized medicine.
Growth Accelerators in the Antibiotic Resistance Market Industry
Technological breakthroughs in drug discovery and diagnostic tools are significantly accelerating market growth. Strategic partnerships between pharmaceutical companies and research institutions are fostering innovation. Expanding into underserved markets and exploring alternative treatment modalities presents substantial growth opportunities.
Key Players Shaping the Antibiotic Resistance Market Market
- Novartis AG
- Merck & Co Inc
- WOCKHARDT
- MELINTA THERAPEUTICS
- AbbVie
- Entasis therapeutics
- Theravance Biopharma
- Seres Therapeutics
- Paratek Pharmaceuticals Inc
- Basilea Pharmaceutica Ltd
- Pfizer Inc
Notable Milestones in Antibiotic Resistance Market Sector
- January 2023: Alkem launches Zidavi, a novel combination antibiotic for drug-resistant infections.
- May 2023: UK government allocates USD 50.11 Million for AMR research through GAMRIF.
In-Depth Antibiotic Resistance Market Market Outlook
The Antibiotic Resistance Market holds significant long-term growth potential driven by continuous innovation in drug development, diagnostic tools, and treatment strategies. Strategic partnerships and expansion into emerging markets will further accelerate growth. The development of novel therapies addressing multi-drug resistant pathogens will remain a critical focus area. The market's trajectory hinges on continued investment in R&D, effective regulatory frameworks, and global collaborative efforts to combat the rise of antibiotic resistance.
Antibiotic Resistance Market Segmentation
-
1. Disease
- 1.1. Clostridioides Difficile Infection (CDI)
- 1.2. Complicated Intra-Abdominal Infection (cIAI)
- 1.3. Acute Ba
- 1.4. Hospital
- 1.5. Complicated Urinary Tract Infection (cUTI)
- 1.6. Community-Acquired Pneumonia (CABP)
- 1.7. Bloodstream Infection (BSI)
-
2. Pathogen
- 2.1. Acinetobacter baumannii
- 2.2. Staphylococcus aureus
- 2.3. Pseudomonas aeruginosa
- 2.4. Haemophilus influenzae
- 2.5. E. Coli
- 2.6. Other Pathogens
-
3. Drug Class
- 3.1. Tetracyclines
- 3.2. Oxazolidinones
- 3.3. Cephalosporins
- 3.4. Lipoglycopeptides
- 3.5. Combination therpaies
- 3.6. Other Drug Classes
-
4. Mechanism of Action
- 4.1. Cell Wall Synthesis Inhibitors
- 4.2. Protein Synthesis Inhibitors
- 4.3. DNA Synthesis Inhibitors
- 4.4. RNA synthesis inhibitors
- 4.5. Other Mechanisms of Action
-
5. Distribution Channel
- 5.1. Hospital Pharmacies
- 5.2. Retail Pharmacies
- 5.3. Online Pharmacies
Antibiotic Resistance Market Segmentation By Geography
-
1. North America
- 1.1. United States
- 1.2. Canada
- 1.3. Mexico
-
2. Europe
- 2.1. Germany
- 2.2. United Kingdom
- 2.3. France
- 2.4. Italy
- 2.5. Spain
- 2.6. Rest of Europe
-
3. Asia Pacific
- 3.1. China
- 3.2. Japan
- 3.3. India
- 3.4. Australia
- 3.5. South Korea
- 3.6. Rest of Asia Pacific
-
4. Middle East and Africa
- 4.1. GCC
- 4.2. South Africa
- 4.3. Rest of Middle East and Africa
-
5. South America
- 5.1. Brazil
- 5.2. Argentina
- 5.3. Rest of South America
Antibiotic Resistance Market REPORT HIGHLIGHTS
| Aspects | Details |
|---|---|
| Study Period | 2019-2033 |
| Base Year | 2024 |
| Estimated Year | 2025 |
| Forecast Period | 2025-2033 |
| Historical Period | 2019-2024 |
| Growth Rate | CAGR of 5.46% from 2019-2033 |
| Segmentation |
|
Table of Contents
- 1. Introduction
- 1.1. Research Scope
- 1.2. Market Segmentation
- 1.3. Research Methodology
- 1.4. Definitions and Assumptions
- 2. Executive Summary
- 2.1. Introduction
- 3. Market Dynamics
- 3.1. Introduction
- 3.2. Market Drivers
- 3.2.1. High Burden of Antibiotic Resistant Infections; Increase in Global Initiatives Drives New Drug Development
- 3.3. Market Restrains
- 3.3.1. Strict Safety Guidelines; High Cost of AMR Therapeutics
- 3.4. Market Trends
- 3.4.1. The Complicated UTIs Segment is Expected to Hold a Major Share of the Market
- 4. Market Factor Analysis
- 4.1. Porters Five Forces
- 4.2. Supply/Value Chain
- 4.3. PESTEL analysis
- 4.4. Market Entropy
- 4.5. Patent/Trademark Analysis
- 5. Global Antibiotic Resistance Market Analysis, Insights and Forecast, 2019-2031
- 5.1. Market Analysis, Insights and Forecast - by Disease
- 5.1.1. Clostridioides Difficile Infection (CDI)
- 5.1.2. Complicated Intra-Abdominal Infection (cIAI)
- 5.1.3. Acute Ba
- 5.1.4. Hospital
- 5.1.5. Complicated Urinary Tract Infection (cUTI)
- 5.1.6. Community-Acquired Pneumonia (CABP)
- 5.1.7. Bloodstream Infection (BSI)
- 5.2. Market Analysis, Insights and Forecast - by Pathogen
- 5.2.1. Acinetobacter baumannii
- 5.2.2. Staphylococcus aureus
- 5.2.3. Pseudomonas aeruginosa
- 5.2.4. Haemophilus influenzae
- 5.2.5. E. Coli
- 5.2.6. Other Pathogens
- 5.3. Market Analysis, Insights and Forecast - by Drug Class
- 5.3.1. Tetracyclines
- 5.3.2. Oxazolidinones
- 5.3.3. Cephalosporins
- 5.3.4. Lipoglycopeptides
- 5.3.5. Combination therpaies
- 5.3.6. Other Drug Classes
- 5.4. Market Analysis, Insights and Forecast - by Mechanism of Action
- 5.4.1. Cell Wall Synthesis Inhibitors
- 5.4.2. Protein Synthesis Inhibitors
- 5.4.3. DNA Synthesis Inhibitors
- 5.4.4. RNA synthesis inhibitors
- 5.4.5. Other Mechanisms of Action
- 5.5. Market Analysis, Insights and Forecast - by Distribution Channel
- 5.5.1. Hospital Pharmacies
- 5.5.2. Retail Pharmacies
- 5.5.3. Online Pharmacies
- 5.6. Market Analysis, Insights and Forecast - by Region
- 5.6.1. North America
- 5.6.2. Europe
- 5.6.3. Asia Pacific
- 5.6.4. Middle East and Africa
- 5.6.5. South America
- 5.1. Market Analysis, Insights and Forecast - by Disease
- 6. North America Antibiotic Resistance Market Analysis, Insights and Forecast, 2019-2031
- 6.1. Market Analysis, Insights and Forecast - by Disease
- 6.1.1. Clostridioides Difficile Infection (CDI)
- 6.1.2. Complicated Intra-Abdominal Infection (cIAI)
- 6.1.3. Acute Ba
- 6.1.4. Hospital
- 6.1.5. Complicated Urinary Tract Infection (cUTI)
- 6.1.6. Community-Acquired Pneumonia (CABP)
- 6.1.7. Bloodstream Infection (BSI)
- 6.2. Market Analysis, Insights and Forecast - by Pathogen
- 6.2.1. Acinetobacter baumannii
- 6.2.2. Staphylococcus aureus
- 6.2.3. Pseudomonas aeruginosa
- 6.2.4. Haemophilus influenzae
- 6.2.5. E. Coli
- 6.2.6. Other Pathogens
- 6.3. Market Analysis, Insights and Forecast - by Drug Class
- 6.3.1. Tetracyclines
- 6.3.2. Oxazolidinones
- 6.3.3. Cephalosporins
- 6.3.4. Lipoglycopeptides
- 6.3.5. Combination therpaies
- 6.3.6. Other Drug Classes
- 6.4. Market Analysis, Insights and Forecast - by Mechanism of Action
- 6.4.1. Cell Wall Synthesis Inhibitors
- 6.4.2. Protein Synthesis Inhibitors
- 6.4.3. DNA Synthesis Inhibitors
- 6.4.4. RNA synthesis inhibitors
- 6.4.5. Other Mechanisms of Action
- 6.5. Market Analysis, Insights and Forecast - by Distribution Channel
- 6.5.1. Hospital Pharmacies
- 6.5.2. Retail Pharmacies
- 6.5.3. Online Pharmacies
- 6.1. Market Analysis, Insights and Forecast - by Disease
- 7. Europe Antibiotic Resistance Market Analysis, Insights and Forecast, 2019-2031
- 7.1. Market Analysis, Insights and Forecast - by Disease
- 7.1.1. Clostridioides Difficile Infection (CDI)
- 7.1.2. Complicated Intra-Abdominal Infection (cIAI)
- 7.1.3. Acute Ba
- 7.1.4. Hospital
- 7.1.5. Complicated Urinary Tract Infection (cUTI)
- 7.1.6. Community-Acquired Pneumonia (CABP)
- 7.1.7. Bloodstream Infection (BSI)
- 7.2. Market Analysis, Insights and Forecast - by Pathogen
- 7.2.1. Acinetobacter baumannii
- 7.2.2. Staphylococcus aureus
- 7.2.3. Pseudomonas aeruginosa
- 7.2.4. Haemophilus influenzae
- 7.2.5. E. Coli
- 7.2.6. Other Pathogens
- 7.3. Market Analysis, Insights and Forecast - by Drug Class
- 7.3.1. Tetracyclines
- 7.3.2. Oxazolidinones
- 7.3.3. Cephalosporins
- 7.3.4. Lipoglycopeptides
- 7.3.5. Combination therpaies
- 7.3.6. Other Drug Classes
- 7.4. Market Analysis, Insights and Forecast - by Mechanism of Action
- 7.4.1. Cell Wall Synthesis Inhibitors
- 7.4.2. Protein Synthesis Inhibitors
- 7.4.3. DNA Synthesis Inhibitors
- 7.4.4. RNA synthesis inhibitors
- 7.4.5. Other Mechanisms of Action
- 7.5. Market Analysis, Insights and Forecast - by Distribution Channel
- 7.5.1. Hospital Pharmacies
- 7.5.2. Retail Pharmacies
- 7.5.3. Online Pharmacies
- 7.1. Market Analysis, Insights and Forecast - by Disease
- 8. Asia Pacific Antibiotic Resistance Market Analysis, Insights and Forecast, 2019-2031
- 8.1. Market Analysis, Insights and Forecast - by Disease
- 8.1.1. Clostridioides Difficile Infection (CDI)
- 8.1.2. Complicated Intra-Abdominal Infection (cIAI)
- 8.1.3. Acute Ba
- 8.1.4. Hospital
- 8.1.5. Complicated Urinary Tract Infection (cUTI)
- 8.1.6. Community-Acquired Pneumonia (CABP)
- 8.1.7. Bloodstream Infection (BSI)
- 8.2. Market Analysis, Insights and Forecast - by Pathogen
- 8.2.1. Acinetobacter baumannii
- 8.2.2. Staphylococcus aureus
- 8.2.3. Pseudomonas aeruginosa
- 8.2.4. Haemophilus influenzae
- 8.2.5. E. Coli
- 8.2.6. Other Pathogens
- 8.3. Market Analysis, Insights and Forecast - by Drug Class
- 8.3.1. Tetracyclines
- 8.3.2. Oxazolidinones
- 8.3.3. Cephalosporins
- 8.3.4. Lipoglycopeptides
- 8.3.5. Combination therpaies
- 8.3.6. Other Drug Classes
- 8.4. Market Analysis, Insights and Forecast - by Mechanism of Action
- 8.4.1. Cell Wall Synthesis Inhibitors
- 8.4.2. Protein Synthesis Inhibitors
- 8.4.3. DNA Synthesis Inhibitors
- 8.4.4. RNA synthesis inhibitors
- 8.4.5. Other Mechanisms of Action
- 8.5. Market Analysis, Insights and Forecast - by Distribution Channel
- 8.5.1. Hospital Pharmacies
- 8.5.2. Retail Pharmacies
- 8.5.3. Online Pharmacies
- 8.1. Market Analysis, Insights and Forecast - by Disease
- 9. Middle East and Africa Antibiotic Resistance Market Analysis, Insights and Forecast, 2019-2031
- 9.1. Market Analysis, Insights and Forecast - by Disease
- 9.1.1. Clostridioides Difficile Infection (CDI)
- 9.1.2. Complicated Intra-Abdominal Infection (cIAI)
- 9.1.3. Acute Ba
- 9.1.4. Hospital
- 9.1.5. Complicated Urinary Tract Infection (cUTI)
- 9.1.6. Community-Acquired Pneumonia (CABP)
- 9.1.7. Bloodstream Infection (BSI)
- 9.2. Market Analysis, Insights and Forecast - by Pathogen
- 9.2.1. Acinetobacter baumannii
- 9.2.2. Staphylococcus aureus
- 9.2.3. Pseudomonas aeruginosa
- 9.2.4. Haemophilus influenzae
- 9.2.5. E. Coli
- 9.2.6. Other Pathogens
- 9.3. Market Analysis, Insights and Forecast - by Drug Class
- 9.3.1. Tetracyclines
- 9.3.2. Oxazolidinones
- 9.3.3. Cephalosporins
- 9.3.4. Lipoglycopeptides
- 9.3.5. Combination therpaies
- 9.3.6. Other Drug Classes
- 9.4. Market Analysis, Insights and Forecast - by Mechanism of Action
- 9.4.1. Cell Wall Synthesis Inhibitors
- 9.4.2. Protein Synthesis Inhibitors
- 9.4.3. DNA Synthesis Inhibitors
- 9.4.4. RNA synthesis inhibitors
- 9.4.5. Other Mechanisms of Action
- 9.5. Market Analysis, Insights and Forecast - by Distribution Channel
- 9.5.1. Hospital Pharmacies
- 9.5.2. Retail Pharmacies
- 9.5.3. Online Pharmacies
- 9.1. Market Analysis, Insights and Forecast - by Disease
- 10. South America Antibiotic Resistance Market Analysis, Insights and Forecast, 2019-2031
- 10.1. Market Analysis, Insights and Forecast - by Disease
- 10.1.1. Clostridioides Difficile Infection (CDI)
- 10.1.2. Complicated Intra-Abdominal Infection (cIAI)
- 10.1.3. Acute Ba
- 10.1.4. Hospital
- 10.1.5. Complicated Urinary Tract Infection (cUTI)
- 10.1.6. Community-Acquired Pneumonia (CABP)
- 10.1.7. Bloodstream Infection (BSI)
- 10.2. Market Analysis, Insights and Forecast - by Pathogen
- 10.2.1. Acinetobacter baumannii
- 10.2.2. Staphylococcus aureus
- 10.2.3. Pseudomonas aeruginosa
- 10.2.4. Haemophilus influenzae
- 10.2.5. E. Coli
- 10.2.6. Other Pathogens
- 10.3. Market Analysis, Insights and Forecast - by Drug Class
- 10.3.1. Tetracyclines
- 10.3.2. Oxazolidinones
- 10.3.3. Cephalosporins
- 10.3.4. Lipoglycopeptides
- 10.3.5. Combination therpaies
- 10.3.6. Other Drug Classes
- 10.4. Market Analysis, Insights and Forecast - by Mechanism of Action
- 10.4.1. Cell Wall Synthesis Inhibitors
- 10.4.2. Protein Synthesis Inhibitors
- 10.4.3. DNA Synthesis Inhibitors
- 10.4.4. RNA synthesis inhibitors
- 10.4.5. Other Mechanisms of Action
- 10.5. Market Analysis, Insights and Forecast - by Distribution Channel
- 10.5.1. Hospital Pharmacies
- 10.5.2. Retail Pharmacies
- 10.5.3. Online Pharmacies
- 10.1. Market Analysis, Insights and Forecast - by Disease
- 11. North America Antibiotic Resistance Market Analysis, Insights and Forecast, 2019-2031
- 11.1. Market Analysis, Insights and Forecast - By Country/Sub-region
- 11.1.1 United States
- 11.1.2 Canada
- 11.1.3 Mexico
- 12. Europe Antibiotic Resistance Market Analysis, Insights and Forecast, 2019-2031
- 12.1. Market Analysis, Insights and Forecast - By Country/Sub-region
- 12.1.1 Germany
- 12.1.2 United Kingdom
- 12.1.3 France
- 12.1.4 Italy
- 12.1.5 Spain
- 12.1.6 Rest of Europe
- 13. Asia Pacific Antibiotic Resistance Market Analysis, Insights and Forecast, 2019-2031
- 13.1. Market Analysis, Insights and Forecast - By Country/Sub-region
- 13.1.1 China
- 13.1.2 Japan
- 13.1.3 India
- 13.1.4 Australia
- 13.1.5 South Korea
- 13.1.6 Rest of Asia Pacific
- 14. Middle East and Africa Antibiotic Resistance Market Analysis, Insights and Forecast, 2019-2031
- 14.1. Market Analysis, Insights and Forecast - By Country/Sub-region
- 14.1.1 GCC
- 14.1.2 South Africa
- 14.1.3 Rest of Middle East and Africa
- 15. South America Antibiotic Resistance Market Analysis, Insights and Forecast, 2019-2031
- 15.1. Market Analysis, Insights and Forecast - By Country/Sub-region
- 15.1.1 Brazil
- 15.1.2 Argentina
- 15.1.3 Rest of South America
- 16. Competitive Analysis
- 16.1. Global Market Share Analysis 2024
- 16.2. Company Profiles
- 16.2.1 Novartis AG
- 16.2.1.1. Overview
- 16.2.1.2. Products
- 16.2.1.3. SWOT Analysis
- 16.2.1.4. Recent Developments
- 16.2.1.5. Financials (Based on Availability)
- 16.2.2 Merck & Co Inc
- 16.2.2.1. Overview
- 16.2.2.2. Products
- 16.2.2.3. SWOT Analysis
- 16.2.2.4. Recent Developments
- 16.2.2.5. Financials (Based on Availability)
- 16.2.3 WOCKHARDT
- 16.2.3.1. Overview
- 16.2.3.2. Products
- 16.2.3.3. SWOT Analysis
- 16.2.3.4. Recent Developments
- 16.2.3.5. Financials (Based on Availability)
- 16.2.4 MELINTA THERAPEUTICS
- 16.2.4.1. Overview
- 16.2.4.2. Products
- 16.2.4.3. SWOT Analysis
- 16.2.4.4. Recent Developments
- 16.2.4.5. Financials (Based on Availability)
- 16.2.5 AbbVie
- 16.2.5.1. Overview
- 16.2.5.2. Products
- 16.2.5.3. SWOT Analysis
- 16.2.5.4. Recent Developments
- 16.2.5.5. Financials (Based on Availability)
- 16.2.6 Entasis therapeutics
- 16.2.6.1. Overview
- 16.2.6.2. Products
- 16.2.6.3. SWOT Analysis
- 16.2.6.4. Recent Developments
- 16.2.6.5. Financials (Based on Availability)
- 16.2.7 Theravance Biopharma
- 16.2.7.1. Overview
- 16.2.7.2. Products
- 16.2.7.3. SWOT Analysis
- 16.2.7.4. Recent Developments
- 16.2.7.5. Financials (Based on Availability)
- 16.2.8 Seres Therapeutics
- 16.2.8.1. Overview
- 16.2.8.2. Products
- 16.2.8.3. SWOT Analysis
- 16.2.8.4. Recent Developments
- 16.2.8.5. Financials (Based on Availability)
- 16.2.9 Paratek Pharmaceuticals Inc
- 16.2.9.1. Overview
- 16.2.9.2. Products
- 16.2.9.3. SWOT Analysis
- 16.2.9.4. Recent Developments
- 16.2.9.5. Financials (Based on Availability)
- 16.2.10 Basilea Pharmaceutica Ltd
- 16.2.10.1. Overview
- 16.2.10.2. Products
- 16.2.10.3. SWOT Analysis
- 16.2.10.4. Recent Developments
- 16.2.10.5. Financials (Based on Availability)
- 16.2.11 Pfizer Inc
- 16.2.11.1. Overview
- 16.2.11.2. Products
- 16.2.11.3. SWOT Analysis
- 16.2.11.4. Recent Developments
- 16.2.11.5. Financials (Based on Availability)
- 16.2.1 Novartis AG
List of Figures
- Figure 1: Global Antibiotic Resistance Market Revenue Breakdown (Million, %) by Region 2024 & 2032
- Figure 2: Global Antibiotic Resistance Market Volume Breakdown (K Unit, %) by Region 2024 & 2032
- Figure 3: North America Antibiotic Resistance Market Revenue (Million), by Country 2024 & 2032
- Figure 4: North America Antibiotic Resistance Market Volume (K Unit), by Country 2024 & 2032
- Figure 5: North America Antibiotic Resistance Market Revenue Share (%), by Country 2024 & 2032
- Figure 6: North America Antibiotic Resistance Market Volume Share (%), by Country 2024 & 2032
- Figure 7: Europe Antibiotic Resistance Market Revenue (Million), by Country 2024 & 2032
- Figure 8: Europe Antibiotic Resistance Market Volume (K Unit), by Country 2024 & 2032
- Figure 9: Europe Antibiotic Resistance Market Revenue Share (%), by Country 2024 & 2032
- Figure 10: Europe Antibiotic Resistance Market Volume Share (%), by Country 2024 & 2032
- Figure 11: Asia Pacific Antibiotic Resistance Market Revenue (Million), by Country 2024 & 2032
- Figure 12: Asia Pacific Antibiotic Resistance Market Volume (K Unit), by Country 2024 & 2032
- Figure 13: Asia Pacific Antibiotic Resistance Market Revenue Share (%), by Country 2024 & 2032
- Figure 14: Asia Pacific Antibiotic Resistance Market Volume Share (%), by Country 2024 & 2032
- Figure 15: Middle East and Africa Antibiotic Resistance Market Revenue (Million), by Country 2024 & 2032
- Figure 16: Middle East and Africa Antibiotic Resistance Market Volume (K Unit), by Country 2024 & 2032
- Figure 17: Middle East and Africa Antibiotic Resistance Market Revenue Share (%), by Country 2024 & 2032
- Figure 18: Middle East and Africa Antibiotic Resistance Market Volume Share (%), by Country 2024 & 2032
- Figure 19: South America Antibiotic Resistance Market Revenue (Million), by Country 2024 & 2032
- Figure 20: South America Antibiotic Resistance Market Volume (K Unit), by Country 2024 & 2032
- Figure 21: South America Antibiotic Resistance Market Revenue Share (%), by Country 2024 & 2032
- Figure 22: South America Antibiotic Resistance Market Volume Share (%), by Country 2024 & 2032
- Figure 23: North America Antibiotic Resistance Market Revenue (Million), by Disease 2024 & 2032
- Figure 24: North America Antibiotic Resistance Market Volume (K Unit), by Disease 2024 & 2032
- Figure 25: North America Antibiotic Resistance Market Revenue Share (%), by Disease 2024 & 2032
- Figure 26: North America Antibiotic Resistance Market Volume Share (%), by Disease 2024 & 2032
- Figure 27: North America Antibiotic Resistance Market Revenue (Million), by Pathogen 2024 & 2032
- Figure 28: North America Antibiotic Resistance Market Volume (K Unit), by Pathogen 2024 & 2032
- Figure 29: North America Antibiotic Resistance Market Revenue Share (%), by Pathogen 2024 & 2032
- Figure 30: North America Antibiotic Resistance Market Volume Share (%), by Pathogen 2024 & 2032
- Figure 31: North America Antibiotic Resistance Market Revenue (Million), by Drug Class 2024 & 2032
- Figure 32: North America Antibiotic Resistance Market Volume (K Unit), by Drug Class 2024 & 2032
- Figure 33: North America Antibiotic Resistance Market Revenue Share (%), by Drug Class 2024 & 2032
- Figure 34: North America Antibiotic Resistance Market Volume Share (%), by Drug Class 2024 & 2032
- Figure 35: North America Antibiotic Resistance Market Revenue (Million), by Mechanism of Action 2024 & 2032
- Figure 36: North America Antibiotic Resistance Market Volume (K Unit), by Mechanism of Action 2024 & 2032
- Figure 37: North America Antibiotic Resistance Market Revenue Share (%), by Mechanism of Action 2024 & 2032
- Figure 38: North America Antibiotic Resistance Market Volume Share (%), by Mechanism of Action 2024 & 2032
- Figure 39: North America Antibiotic Resistance Market Revenue (Million), by Distribution Channel 2024 & 2032
- Figure 40: North America Antibiotic Resistance Market Volume (K Unit), by Distribution Channel 2024 & 2032
- Figure 41: North America Antibiotic Resistance Market Revenue Share (%), by Distribution Channel 2024 & 2032
- Figure 42: North America Antibiotic Resistance Market Volume Share (%), by Distribution Channel 2024 & 2032
- Figure 43: North America Antibiotic Resistance Market Revenue (Million), by Country 2024 & 2032
- Figure 44: North America Antibiotic Resistance Market Volume (K Unit), by Country 2024 & 2032
- Figure 45: North America Antibiotic Resistance Market Revenue Share (%), by Country 2024 & 2032
- Figure 46: North America Antibiotic Resistance Market Volume Share (%), by Country 2024 & 2032
- Figure 47: Europe Antibiotic Resistance Market Revenue (Million), by Disease 2024 & 2032
- Figure 48: Europe Antibiotic Resistance Market Volume (K Unit), by Disease 2024 & 2032
- Figure 49: Europe Antibiotic Resistance Market Revenue Share (%), by Disease 2024 & 2032
- Figure 50: Europe Antibiotic Resistance Market Volume Share (%), by Disease 2024 & 2032
- Figure 51: Europe Antibiotic Resistance Market Revenue (Million), by Pathogen 2024 & 2032
- Figure 52: Europe Antibiotic Resistance Market Volume (K Unit), by Pathogen 2024 & 2032
- Figure 53: Europe Antibiotic Resistance Market Revenue Share (%), by Pathogen 2024 & 2032
- Figure 54: Europe Antibiotic Resistance Market Volume Share (%), by Pathogen 2024 & 2032
- Figure 55: Europe Antibiotic Resistance Market Revenue (Million), by Drug Class 2024 & 2032
- Figure 56: Europe Antibiotic Resistance Market Volume (K Unit), by Drug Class 2024 & 2032
- Figure 57: Europe Antibiotic Resistance Market Revenue Share (%), by Drug Class 2024 & 2032
- Figure 58: Europe Antibiotic Resistance Market Volume Share (%), by Drug Class 2024 & 2032
- Figure 59: Europe Antibiotic Resistance Market Revenue (Million), by Mechanism of Action 2024 & 2032
- Figure 60: Europe Antibiotic Resistance Market Volume (K Unit), by Mechanism of Action 2024 & 2032
- Figure 61: Europe Antibiotic Resistance Market Revenue Share (%), by Mechanism of Action 2024 & 2032
- Figure 62: Europe Antibiotic Resistance Market Volume Share (%), by Mechanism of Action 2024 & 2032
- Figure 63: Europe Antibiotic Resistance Market Revenue (Million), by Distribution Channel 2024 & 2032
- Figure 64: Europe Antibiotic Resistance Market Volume (K Unit), by Distribution Channel 2024 & 2032
- Figure 65: Europe Antibiotic Resistance Market Revenue Share (%), by Distribution Channel 2024 & 2032
- Figure 66: Europe Antibiotic Resistance Market Volume Share (%), by Distribution Channel 2024 & 2032
- Figure 67: Europe Antibiotic Resistance Market Revenue (Million), by Country 2024 & 2032
- Figure 68: Europe Antibiotic Resistance Market Volume (K Unit), by Country 2024 & 2032
- Figure 69: Europe Antibiotic Resistance Market Revenue Share (%), by Country 2024 & 2032
- Figure 70: Europe Antibiotic Resistance Market Volume Share (%), by Country 2024 & 2032
- Figure 71: Asia Pacific Antibiotic Resistance Market Revenue (Million), by Disease 2024 & 2032
- Figure 72: Asia Pacific Antibiotic Resistance Market Volume (K Unit), by Disease 2024 & 2032
- Figure 73: Asia Pacific Antibiotic Resistance Market Revenue Share (%), by Disease 2024 & 2032
- Figure 74: Asia Pacific Antibiotic Resistance Market Volume Share (%), by Disease 2024 & 2032
- Figure 75: Asia Pacific Antibiotic Resistance Market Revenue (Million), by Pathogen 2024 & 2032
- Figure 76: Asia Pacific Antibiotic Resistance Market Volume (K Unit), by Pathogen 2024 & 2032
- Figure 77: Asia Pacific Antibiotic Resistance Market Revenue Share (%), by Pathogen 2024 & 2032
- Figure 78: Asia Pacific Antibiotic Resistance Market Volume Share (%), by Pathogen 2024 & 2032
- Figure 79: Asia Pacific Antibiotic Resistance Market Revenue (Million), by Drug Class 2024 & 2032
- Figure 80: Asia Pacific Antibiotic Resistance Market Volume (K Unit), by Drug Class 2024 & 2032
- Figure 81: Asia Pacific Antibiotic Resistance Market Revenue Share (%), by Drug Class 2024 & 2032
- Figure 82: Asia Pacific Antibiotic Resistance Market Volume Share (%), by Drug Class 2024 & 2032
- Figure 83: Asia Pacific Antibiotic Resistance Market Revenue (Million), by Mechanism of Action 2024 & 2032
- Figure 84: Asia Pacific Antibiotic Resistance Market Volume (K Unit), by Mechanism of Action 2024 & 2032
- Figure 85: Asia Pacific Antibiotic Resistance Market Revenue Share (%), by Mechanism of Action 2024 & 2032
- Figure 86: Asia Pacific Antibiotic Resistance Market Volume Share (%), by Mechanism of Action 2024 & 2032
- Figure 87: Asia Pacific Antibiotic Resistance Market Revenue (Million), by Distribution Channel 2024 & 2032
- Figure 88: Asia Pacific Antibiotic Resistance Market Volume (K Unit), by Distribution Channel 2024 & 2032
- Figure 89: Asia Pacific Antibiotic Resistance Market Revenue Share (%), by Distribution Channel 2024 & 2032
- Figure 90: Asia Pacific Antibiotic Resistance Market Volume Share (%), by Distribution Channel 2024 & 2032
- Figure 91: Asia Pacific Antibiotic Resistance Market Revenue (Million), by Country 2024 & 2032
- Figure 92: Asia Pacific Antibiotic Resistance Market Volume (K Unit), by Country 2024 & 2032
- Figure 93: Asia Pacific Antibiotic Resistance Market Revenue Share (%), by Country 2024 & 2032
- Figure 94: Asia Pacific Antibiotic Resistance Market Volume Share (%), by Country 2024 & 2032
- Figure 95: Middle East and Africa Antibiotic Resistance Market Revenue (Million), by Disease 2024 & 2032
- Figure 96: Middle East and Africa Antibiotic Resistance Market Volume (K Unit), by Disease 2024 & 2032
- Figure 97: Middle East and Africa Antibiotic Resistance Market Revenue Share (%), by Disease 2024 & 2032
- Figure 98: Middle East and Africa Antibiotic Resistance Market Volume Share (%), by Disease 2024 & 2032
- Figure 99: Middle East and Africa Antibiotic Resistance Market Revenue (Million), by Pathogen 2024 & 2032
- Figure 100: Middle East and Africa Antibiotic Resistance Market Volume (K Unit), by Pathogen 2024 & 2032
- Figure 101: Middle East and Africa Antibiotic Resistance Market Revenue Share (%), by Pathogen 2024 & 2032
- Figure 102: Middle East and Africa Antibiotic Resistance Market Volume Share (%), by Pathogen 2024 & 2032
- Figure 103: Middle East and Africa Antibiotic Resistance Market Revenue (Million), by Drug Class 2024 & 2032
- Figure 104: Middle East and Africa Antibiotic Resistance Market Volume (K Unit), by Drug Class 2024 & 2032
- Figure 105: Middle East and Africa Antibiotic Resistance Market Revenue Share (%), by Drug Class 2024 & 2032
- Figure 106: Middle East and Africa Antibiotic Resistance Market Volume Share (%), by Drug Class 2024 & 2032
- Figure 107: Middle East and Africa Antibiotic Resistance Market Revenue (Million), by Mechanism of Action 2024 & 2032
- Figure 108: Middle East and Africa Antibiotic Resistance Market Volume (K Unit), by Mechanism of Action 2024 & 2032
- Figure 109: Middle East and Africa Antibiotic Resistance Market Revenue Share (%), by Mechanism of Action 2024 & 2032
- Figure 110: Middle East and Africa Antibiotic Resistance Market Volume Share (%), by Mechanism of Action 2024 & 2032
- Figure 111: Middle East and Africa Antibiotic Resistance Market Revenue (Million), by Distribution Channel 2024 & 2032
- Figure 112: Middle East and Africa Antibiotic Resistance Market Volume (K Unit), by Distribution Channel 2024 & 2032
- Figure 113: Middle East and Africa Antibiotic Resistance Market Revenue Share (%), by Distribution Channel 2024 & 2032
- Figure 114: Middle East and Africa Antibiotic Resistance Market Volume Share (%), by Distribution Channel 2024 & 2032
- Figure 115: Middle East and Africa Antibiotic Resistance Market Revenue (Million), by Country 2024 & 2032
- Figure 116: Middle East and Africa Antibiotic Resistance Market Volume (K Unit), by Country 2024 & 2032
- Figure 117: Middle East and Africa Antibiotic Resistance Market Revenue Share (%), by Country 2024 & 2032
- Figure 118: Middle East and Africa Antibiotic Resistance Market Volume Share (%), by Country 2024 & 2032
- Figure 119: South America Antibiotic Resistance Market Revenue (Million), by Disease 2024 & 2032
- Figure 120: South America Antibiotic Resistance Market Volume (K Unit), by Disease 2024 & 2032
- Figure 121: South America Antibiotic Resistance Market Revenue Share (%), by Disease 2024 & 2032
- Figure 122: South America Antibiotic Resistance Market Volume Share (%), by Disease 2024 & 2032
- Figure 123: South America Antibiotic Resistance Market Revenue (Million), by Pathogen 2024 & 2032
- Figure 124: South America Antibiotic Resistance Market Volume (K Unit), by Pathogen 2024 & 2032
- Figure 125: South America Antibiotic Resistance Market Revenue Share (%), by Pathogen 2024 & 2032
- Figure 126: South America Antibiotic Resistance Market Volume Share (%), by Pathogen 2024 & 2032
- Figure 127: South America Antibiotic Resistance Market Revenue (Million), by Drug Class 2024 & 2032
- Figure 128: South America Antibiotic Resistance Market Volume (K Unit), by Drug Class 2024 & 2032
- Figure 129: South America Antibiotic Resistance Market Revenue Share (%), by Drug Class 2024 & 2032
- Figure 130: South America Antibiotic Resistance Market Volume Share (%), by Drug Class 2024 & 2032
- Figure 131: South America Antibiotic Resistance Market Revenue (Million), by Mechanism of Action 2024 & 2032
- Figure 132: South America Antibiotic Resistance Market Volume (K Unit), by Mechanism of Action 2024 & 2032
- Figure 133: South America Antibiotic Resistance Market Revenue Share (%), by Mechanism of Action 2024 & 2032
- Figure 134: South America Antibiotic Resistance Market Volume Share (%), by Mechanism of Action 2024 & 2032
- Figure 135: South America Antibiotic Resistance Market Revenue (Million), by Distribution Channel 2024 & 2032
- Figure 136: South America Antibiotic Resistance Market Volume (K Unit), by Distribution Channel 2024 & 2032
- Figure 137: South America Antibiotic Resistance Market Revenue Share (%), by Distribution Channel 2024 & 2032
- Figure 138: South America Antibiotic Resistance Market Volume Share (%), by Distribution Channel 2024 & 2032
- Figure 139: South America Antibiotic Resistance Market Revenue (Million), by Country 2024 & 2032
- Figure 140: South America Antibiotic Resistance Market Volume (K Unit), by Country 2024 & 2032
- Figure 141: South America Antibiotic Resistance Market Revenue Share (%), by Country 2024 & 2032
- Figure 142: South America Antibiotic Resistance Market Volume Share (%), by Country 2024 & 2032
List of Tables
- Table 1: Global Antibiotic Resistance Market Revenue Million Forecast, by Region 2019 & 2032
- Table 2: Global Antibiotic Resistance Market Volume K Unit Forecast, by Region 2019 & 2032
- Table 3: Global Antibiotic Resistance Market Revenue Million Forecast, by Disease 2019 & 2032
- Table 4: Global Antibiotic Resistance Market Volume K Unit Forecast, by Disease 2019 & 2032
- Table 5: Global Antibiotic Resistance Market Revenue Million Forecast, by Pathogen 2019 & 2032
- Table 6: Global Antibiotic Resistance Market Volume K Unit Forecast, by Pathogen 2019 & 2032
- Table 7: Global Antibiotic Resistance Market Revenue Million Forecast, by Drug Class 2019 & 2032
- Table 8: Global Antibiotic Resistance Market Volume K Unit Forecast, by Drug Class 2019 & 2032
- Table 9: Global Antibiotic Resistance Market Revenue Million Forecast, by Mechanism of Action 2019 & 2032
- Table 10: Global Antibiotic Resistance Market Volume K Unit Forecast, by Mechanism of Action 2019 & 2032
- Table 11: Global Antibiotic Resistance Market Revenue Million Forecast, by Distribution Channel 2019 & 2032
- Table 12: Global Antibiotic Resistance Market Volume K Unit Forecast, by Distribution Channel 2019 & 2032
- Table 13: Global Antibiotic Resistance Market Revenue Million Forecast, by Region 2019 & 2032
- Table 14: Global Antibiotic Resistance Market Volume K Unit Forecast, by Region 2019 & 2032
- Table 15: Global Antibiotic Resistance Market Revenue Million Forecast, by Country 2019 & 2032
- Table 16: Global Antibiotic Resistance Market Volume K Unit Forecast, by Country 2019 & 2032
- Table 17: United States Antibiotic Resistance Market Revenue (Million) Forecast, by Application 2019 & 2032
- Table 18: United States Antibiotic Resistance Market Volume (K Unit) Forecast, by Application 2019 & 2032
- Table 19: Canada Antibiotic Resistance Market Revenue (Million) Forecast, by Application 2019 & 2032
- Table 20: Canada Antibiotic Resistance Market Volume (K Unit) Forecast, by Application 2019 & 2032
- Table 21: Mexico Antibiotic Resistance Market Revenue (Million) Forecast, by Application 2019 & 2032
- Table 22: Mexico Antibiotic Resistance Market Volume (K Unit) Forecast, by Application 2019 & 2032
- Table 23: Global Antibiotic Resistance Market Revenue Million Forecast, by Country 2019 & 2032
- Table 24: Global Antibiotic Resistance Market Volume K Unit Forecast, by Country 2019 & 2032
- Table 25: Germany Antibiotic Resistance Market Revenue (Million) Forecast, by Application 2019 & 2032
- Table 26: Germany Antibiotic Resistance Market Volume (K Unit) Forecast, by Application 2019 & 2032
- Table 27: United Kingdom Antibiotic Resistance Market Revenue (Million) Forecast, by Application 2019 & 2032
- Table 28: United Kingdom Antibiotic Resistance Market Volume (K Unit) Forecast, by Application 2019 & 2032
- Table 29: France Antibiotic Resistance Market Revenue (Million) Forecast, by Application 2019 & 2032
- Table 30: France Antibiotic Resistance Market Volume (K Unit) Forecast, by Application 2019 & 2032
- Table 31: Italy Antibiotic Resistance Market Revenue (Million) Forecast, by Application 2019 & 2032
- Table 32: Italy Antibiotic Resistance Market Volume (K Unit) Forecast, by Application 2019 & 2032
- Table 33: Spain Antibiotic Resistance Market Revenue (Million) Forecast, by Application 2019 & 2032
- Table 34: Spain Antibiotic Resistance Market Volume (K Unit) Forecast, by Application 2019 & 2032
- Table 35: Rest of Europe Antibiotic Resistance Market Revenue (Million) Forecast, by Application 2019 & 2032
- Table 36: Rest of Europe Antibiotic Resistance Market Volume (K Unit) Forecast, by Application 2019 & 2032
- Table 37: Global Antibiotic Resistance Market Revenue Million Forecast, by Country 2019 & 2032
- Table 38: Global Antibiotic Resistance Market Volume K Unit Forecast, by Country 2019 & 2032
- Table 39: China Antibiotic Resistance Market Revenue (Million) Forecast, by Application 2019 & 2032
- Table 40: China Antibiotic Resistance Market Volume (K Unit) Forecast, by Application 2019 & 2032
- Table 41: Japan Antibiotic Resistance Market Revenue (Million) Forecast, by Application 2019 & 2032
- Table 42: Japan Antibiotic Resistance Market Volume (K Unit) Forecast, by Application 2019 & 2032
- Table 43: India Antibiotic Resistance Market Revenue (Million) Forecast, by Application 2019 & 2032
- Table 44: India Antibiotic Resistance Market Volume (K Unit) Forecast, by Application 2019 & 2032
- Table 45: Australia Antibiotic Resistance Market Revenue (Million) Forecast, by Application 2019 & 2032
- Table 46: Australia Antibiotic Resistance Market Volume (K Unit) Forecast, by Application 2019 & 2032
- Table 47: South Korea Antibiotic Resistance Market Revenue (Million) Forecast, by Application 2019 & 2032
- Table 48: South Korea Antibiotic Resistance Market Volume (K Unit) Forecast, by Application 2019 & 2032
- Table 49: Rest of Asia Pacific Antibiotic Resistance Market Revenue (Million) Forecast, by Application 2019 & 2032
- Table 50: Rest of Asia Pacific Antibiotic Resistance Market Volume (K Unit) Forecast, by Application 2019 & 2032
- Table 51: Global Antibiotic Resistance Market Revenue Million Forecast, by Country 2019 & 2032
- Table 52: Global Antibiotic Resistance Market Volume K Unit Forecast, by Country 2019 & 2032
- Table 53: GCC Antibiotic Resistance Market Revenue (Million) Forecast, by Application 2019 & 2032
- Table 54: GCC Antibiotic Resistance Market Volume (K Unit) Forecast, by Application 2019 & 2032
- Table 55: South Africa Antibiotic Resistance Market Revenue (Million) Forecast, by Application 2019 & 2032
- Table 56: South Africa Antibiotic Resistance Market Volume (K Unit) Forecast, by Application 2019 & 2032
- Table 57: Rest of Middle East and Africa Antibiotic Resistance Market Revenue (Million) Forecast, by Application 2019 & 2032
- Table 58: Rest of Middle East and Africa Antibiotic Resistance Market Volume (K Unit) Forecast, by Application 2019 & 2032
- Table 59: Global Antibiotic Resistance Market Revenue Million Forecast, by Country 2019 & 2032
- Table 60: Global Antibiotic Resistance Market Volume K Unit Forecast, by Country 2019 & 2032
- Table 61: Brazil Antibiotic Resistance Market Revenue (Million) Forecast, by Application 2019 & 2032
- Table 62: Brazil Antibiotic Resistance Market Volume (K Unit) Forecast, by Application 2019 & 2032
- Table 63: Argentina Antibiotic Resistance Market Revenue (Million) Forecast, by Application 2019 & 2032
- Table 64: Argentina Antibiotic Resistance Market Volume (K Unit) Forecast, by Application 2019 & 2032
- Table 65: Rest of South America Antibiotic Resistance Market Revenue (Million) Forecast, by Application 2019 & 2032
- Table 66: Rest of South America Antibiotic Resistance Market Volume (K Unit) Forecast, by Application 2019 & 2032
- Table 67: Global Antibiotic Resistance Market Revenue Million Forecast, by Disease 2019 & 2032
- Table 68: Global Antibiotic Resistance Market Volume K Unit Forecast, by Disease 2019 & 2032
- Table 69: Global Antibiotic Resistance Market Revenue Million Forecast, by Pathogen 2019 & 2032
- Table 70: Global Antibiotic Resistance Market Volume K Unit Forecast, by Pathogen 2019 & 2032
- Table 71: Global Antibiotic Resistance Market Revenue Million Forecast, by Drug Class 2019 & 2032
- Table 72: Global Antibiotic Resistance Market Volume K Unit Forecast, by Drug Class 2019 & 2032
- Table 73: Global Antibiotic Resistance Market Revenue Million Forecast, by Mechanism of Action 2019 & 2032
- Table 74: Global Antibiotic Resistance Market Volume K Unit Forecast, by Mechanism of Action 2019 & 2032
- Table 75: Global Antibiotic Resistance Market Revenue Million Forecast, by Distribution Channel 2019 & 2032
- Table 76: Global Antibiotic Resistance Market Volume K Unit Forecast, by Distribution Channel 2019 & 2032
- Table 77: Global Antibiotic Resistance Market Revenue Million Forecast, by Country 2019 & 2032
- Table 78: Global Antibiotic Resistance Market Volume K Unit Forecast, by Country 2019 & 2032
- Table 79: United States Antibiotic Resistance Market Revenue (Million) Forecast, by Application 2019 & 2032
- Table 80: United States Antibiotic Resistance Market Volume (K Unit) Forecast, by Application 2019 & 2032
- Table 81: Canada Antibiotic Resistance Market Revenue (Million) Forecast, by Application 2019 & 2032
- Table 82: Canada Antibiotic Resistance Market Volume (K Unit) Forecast, by Application 2019 & 2032
- Table 83: Mexico Antibiotic Resistance Market Revenue (Million) Forecast, by Application 2019 & 2032
- Table 84: Mexico Antibiotic Resistance Market Volume (K Unit) Forecast, by Application 2019 & 2032
- Table 85: Global Antibiotic Resistance Market Revenue Million Forecast, by Disease 2019 & 2032
- Table 86: Global Antibiotic Resistance Market Volume K Unit Forecast, by Disease 2019 & 2032
- Table 87: Global Antibiotic Resistance Market Revenue Million Forecast, by Pathogen 2019 & 2032
- Table 88: Global Antibiotic Resistance Market Volume K Unit Forecast, by Pathogen 2019 & 2032
- Table 89: Global Antibiotic Resistance Market Revenue Million Forecast, by Drug Class 2019 & 2032
- Table 90: Global Antibiotic Resistance Market Volume K Unit Forecast, by Drug Class 2019 & 2032
- Table 91: Global Antibiotic Resistance Market Revenue Million Forecast, by Mechanism of Action 2019 & 2032
- Table 92: Global Antibiotic Resistance Market Volume K Unit Forecast, by Mechanism of Action 2019 & 2032
- Table 93: Global Antibiotic Resistance Market Revenue Million Forecast, by Distribution Channel 2019 & 2032
- Table 94: Global Antibiotic Resistance Market Volume K Unit Forecast, by Distribution Channel 2019 & 2032
- Table 95: Global Antibiotic Resistance Market Revenue Million Forecast, by Country 2019 & 2032
- Table 96: Global Antibiotic Resistance Market Volume K Unit Forecast, by Country 2019 & 2032
- Table 97: Germany Antibiotic Resistance Market Revenue (Million) Forecast, by Application 2019 & 2032
- Table 98: Germany Antibiotic Resistance Market Volume (K Unit) Forecast, by Application 2019 & 2032
- Table 99: United Kingdom Antibiotic Resistance Market Revenue (Million) Forecast, by Application 2019 & 2032
- Table 100: United Kingdom Antibiotic Resistance Market Volume (K Unit) Forecast, by Application 2019 & 2032
- Table 101: France Antibiotic Resistance Market Revenue (Million) Forecast, by Application 2019 & 2032
- Table 102: France Antibiotic Resistance Market Volume (K Unit) Forecast, by Application 2019 & 2032
- Table 103: Italy Antibiotic Resistance Market Revenue (Million) Forecast, by Application 2019 & 2032
- Table 104: Italy Antibiotic Resistance Market Volume (K Unit) Forecast, by Application 2019 & 2032
- Table 105: Spain Antibiotic Resistance Market Revenue (Million) Forecast, by Application 2019 & 2032
- Table 106: Spain Antibiotic Resistance Market Volume (K Unit) Forecast, by Application 2019 & 2032
- Table 107: Rest of Europe Antibiotic Resistance Market Revenue (Million) Forecast, by Application 2019 & 2032
- Table 108: Rest of Europe Antibiotic Resistance Market Volume (K Unit) Forecast, by Application 2019 & 2032
- Table 109: Global Antibiotic Resistance Market Revenue Million Forecast, by Disease 2019 & 2032
- Table 110: Global Antibiotic Resistance Market Volume K Unit Forecast, by Disease 2019 & 2032
- Table 111: Global Antibiotic Resistance Market Revenue Million Forecast, by Pathogen 2019 & 2032
- Table 112: Global Antibiotic Resistance Market Volume K Unit Forecast, by Pathogen 2019 & 2032
- Table 113: Global Antibiotic Resistance Market Revenue Million Forecast, by Drug Class 2019 & 2032
- Table 114: Global Antibiotic Resistance Market Volume K Unit Forecast, by Drug Class 2019 & 2032
- Table 115: Global Antibiotic Resistance Market Revenue Million Forecast, by Mechanism of Action 2019 & 2032
- Table 116: Global Antibiotic Resistance Market Volume K Unit Forecast, by Mechanism of Action 2019 & 2032
- Table 117: Global Antibiotic Resistance Market Revenue Million Forecast, by Distribution Channel 2019 & 2032
- Table 118: Global Antibiotic Resistance Market Volume K Unit Forecast, by Distribution Channel 2019 & 2032
- Table 119: Global Antibiotic Resistance Market Revenue Million Forecast, by Country 2019 & 2032
- Table 120: Global Antibiotic Resistance Market Volume K Unit Forecast, by Country 2019 & 2032
- Table 121: China Antibiotic Resistance Market Revenue (Million) Forecast, by Application 2019 & 2032
- Table 122: China Antibiotic Resistance Market Volume (K Unit) Forecast, by Application 2019 & 2032
- Table 123: Japan Antibiotic Resistance Market Revenue (Million) Forecast, by Application 2019 & 2032
- Table 124: Japan Antibiotic Resistance Market Volume (K Unit) Forecast, by Application 2019 & 2032
- Table 125: India Antibiotic Resistance Market Revenue (Million) Forecast, by Application 2019 & 2032
- Table 126: India Antibiotic Resistance Market Volume (K Unit) Forecast, by Application 2019 & 2032
- Table 127: Australia Antibiotic Resistance Market Revenue (Million) Forecast, by Application 2019 & 2032
- Table 128: Australia Antibiotic Resistance Market Volume (K Unit) Forecast, by Application 2019 & 2032
- Table 129: South Korea Antibiotic Resistance Market Revenue (Million) Forecast, by Application 2019 & 2032
- Table 130: South Korea Antibiotic Resistance Market Volume (K Unit) Forecast, by Application 2019 & 2032
- Table 131: Rest of Asia Pacific Antibiotic Resistance Market Revenue (Million) Forecast, by Application 2019 & 2032
- Table 132: Rest of Asia Pacific Antibiotic Resistance Market Volume (K Unit) Forecast, by Application 2019 & 2032
- Table 133: Global Antibiotic Resistance Market Revenue Million Forecast, by Disease 2019 & 2032
- Table 134: Global Antibiotic Resistance Market Volume K Unit Forecast, by Disease 2019 & 2032
- Table 135: Global Antibiotic Resistance Market Revenue Million Forecast, by Pathogen 2019 & 2032
- Table 136: Global Antibiotic Resistance Market Volume K Unit Forecast, by Pathogen 2019 & 2032
- Table 137: Global Antibiotic Resistance Market Revenue Million Forecast, by Drug Class 2019 & 2032
- Table 138: Global Antibiotic Resistance Market Volume K Unit Forecast, by Drug Class 2019 & 2032
- Table 139: Global Antibiotic Resistance Market Revenue Million Forecast, by Mechanism of Action 2019 & 2032
- Table 140: Global Antibiotic Resistance Market Volume K Unit Forecast, by Mechanism of Action 2019 & 2032
- Table 141: Global Antibiotic Resistance Market Revenue Million Forecast, by Distribution Channel 2019 & 2032
- Table 142: Global Antibiotic Resistance Market Volume K Unit Forecast, by Distribution Channel 2019 & 2032
- Table 143: Global Antibiotic Resistance Market Revenue Million Forecast, by Country 2019 & 2032
- Table 144: Global Antibiotic Resistance Market Volume K Unit Forecast, by Country 2019 & 2032
- Table 145: GCC Antibiotic Resistance Market Revenue (Million) Forecast, by Application 2019 & 2032
- Table 146: GCC Antibiotic Resistance Market Volume (K Unit) Forecast, by Application 2019 & 2032
- Table 147: South Africa Antibiotic Resistance Market Revenue (Million) Forecast, by Application 2019 & 2032
- Table 148: South Africa Antibiotic Resistance Market Volume (K Unit) Forecast, by Application 2019 & 2032
- Table 149: Rest of Middle East and Africa Antibiotic Resistance Market Revenue (Million) Forecast, by Application 2019 & 2032
- Table 150: Rest of Middle East and Africa Antibiotic Resistance Market Volume (K Unit) Forecast, by Application 2019 & 2032
- Table 151: Global Antibiotic Resistance Market Revenue Million Forecast, by Disease 2019 & 2032
- Table 152: Global Antibiotic Resistance Market Volume K Unit Forecast, by Disease 2019 & 2032
- Table 153: Global Antibiotic Resistance Market Revenue Million Forecast, by Pathogen 2019 & 2032
- Table 154: Global Antibiotic Resistance Market Volume K Unit Forecast, by Pathogen 2019 & 2032
- Table 155: Global Antibiotic Resistance Market Revenue Million Forecast, by Drug Class 2019 & 2032
- Table 156: Global Antibiotic Resistance Market Volume K Unit Forecast, by Drug Class 2019 & 2032
- Table 157: Global Antibiotic Resistance Market Revenue Million Forecast, by Mechanism of Action 2019 & 2032
- Table 158: Global Antibiotic Resistance Market Volume K Unit Forecast, by Mechanism of Action 2019 & 2032
- Table 159: Global Antibiotic Resistance Market Revenue Million Forecast, by Distribution Channel 2019 & 2032
- Table 160: Global Antibiotic Resistance Market Volume K Unit Forecast, by Distribution Channel 2019 & 2032
- Table 161: Global Antibiotic Resistance Market Revenue Million Forecast, by Country 2019 & 2032
- Table 162: Global Antibiotic Resistance Market Volume K Unit Forecast, by Country 2019 & 2032
- Table 163: Brazil Antibiotic Resistance Market Revenue (Million) Forecast, by Application 2019 & 2032
- Table 164: Brazil Antibiotic Resistance Market Volume (K Unit) Forecast, by Application 2019 & 2032
- Table 165: Argentina Antibiotic Resistance Market Revenue (Million) Forecast, by Application 2019 & 2032
- Table 166: Argentina Antibiotic Resistance Market Volume (K Unit) Forecast, by Application 2019 & 2032
- Table 167: Rest of South America Antibiotic Resistance Market Revenue (Million) Forecast, by Application 2019 & 2032
- Table 168: Rest of South America Antibiotic Resistance Market Volume (K Unit) Forecast, by Application 2019 & 2032
Frequently Asked Questions
1. What is the projected Compound Annual Growth Rate (CAGR) of the Antibiotic Resistance Market?
The projected CAGR is approximately 5.46%.
2. Which companies are prominent players in the Antibiotic Resistance Market?
Key companies in the market include Novartis AG, Merck & Co Inc, WOCKHARDT, MELINTA THERAPEUTICS, AbbVie, Entasis therapeutics, Theravance Biopharma, Seres Therapeutics, Paratek Pharmaceuticals Inc, Basilea Pharmaceutica Ltd, Pfizer Inc.
3. What are the main segments of the Antibiotic Resistance Market?
The market segments include Disease, Pathogen, Drug Class, Mechanism of Action, Distribution Channel.
4. Can you provide details about the market size?
The market size is estimated to be USD 8.80 Million as of 2022.
5. What are some drivers contributing to market growth?
High Burden of Antibiotic Resistant Infections; Increase in Global Initiatives Drives New Drug Development.
6. What are the notable trends driving market growth?
The Complicated UTIs Segment is Expected to Hold a Major Share of the Market.
7. Are there any restraints impacting market growth?
Strict Safety Guidelines; High Cost of AMR Therapeutics.
8. Can you provide examples of recent developments in the market?
January 2023: An Indian company, Alkem, launched its new antibiotic drug against multiple drug-resistant infections in the country. The company's product, Zidavi, is a novel combination of ceftazidime and avibactam and is indicated for various ailments like complicated urinary tract infections.
9. What pricing options are available for accessing the report?
Pricing options include single-user, multi-user, and enterprise licenses priced at USD 4750, USD 5250, and USD 8750 respectively.
10. Is the market size provided in terms of value or volume?
The market size is provided in terms of value, measured in Million and volume, measured in K Unit.
11. Are there any specific market keywords associated with the report?
Yes, the market keyword associated with the report is "Antibiotic Resistance Market," which aids in identifying and referencing the specific market segment covered.
12. How do I determine which pricing option suits my needs best?
The pricing options vary based on user requirements and access needs. Individual users may opt for single-user licenses, while businesses requiring broader access may choose multi-user or enterprise licenses for cost-effective access to the report.
13. Are there any additional resources or data provided in the Antibiotic Resistance Market report?
While the report offers comprehensive insights, it's advisable to review the specific contents or supplementary materials provided to ascertain if additional resources or data are available.
14. How can I stay updated on further developments or reports in the Antibiotic Resistance Market?
To stay informed about further developments, trends, and reports in the Antibiotic Resistance Market, consider subscribing to industry newsletters, following relevant companies and organizations, or regularly checking reputable industry news sources and publications.
Methodology
Step 1 - Identification of Relevant Samples Size from Population Database


Step 2 - Approaches for Defining Global Market Size (Value, Volume* & Price*)

Note*: In applicable scenarios
Step 3 - Data Sources
Primary Research
- Web Analytics
- Survey Reports
- Research Institute
- Latest Research Reports
- Opinion Leaders
Secondary Research
- Annual Reports
- White Paper
- Latest Press Release
- Industry Association
- Paid Database
- Investor Presentations

Step 4 - Data Triangulation
Involves using different sources of information in order to increase the validity of a study
These sources are likely to be stakeholders in a program - participants, other researchers, program staff, other community members, and so on.
Then we put all data in single framework & apply various statistical tools to find out the dynamic on the market.
During the analysis stage, feedback from the stakeholder groups would be compared to determine areas of agreement as well as areas of divergence


