
Key Insights
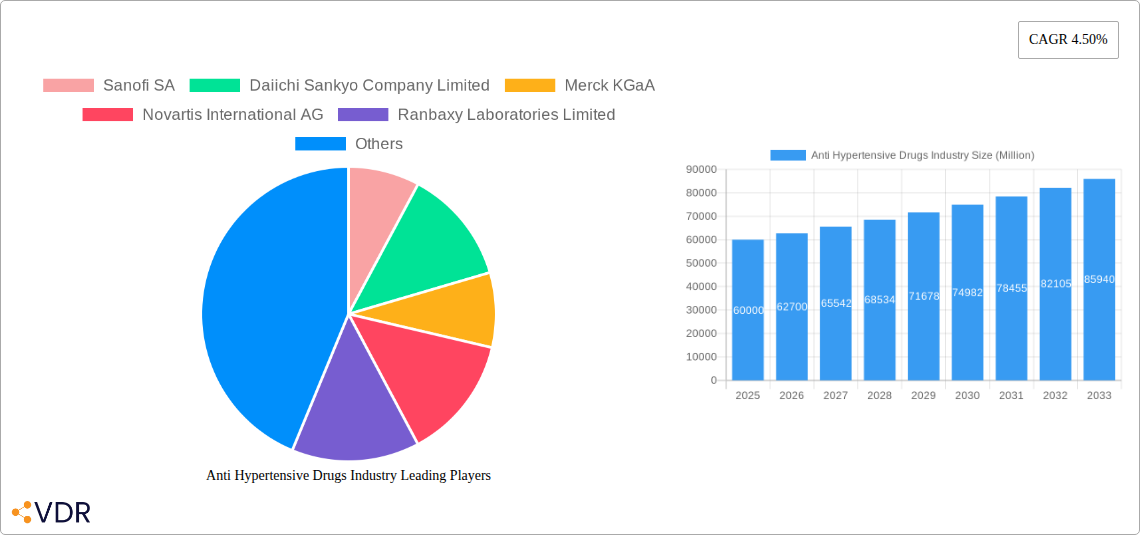
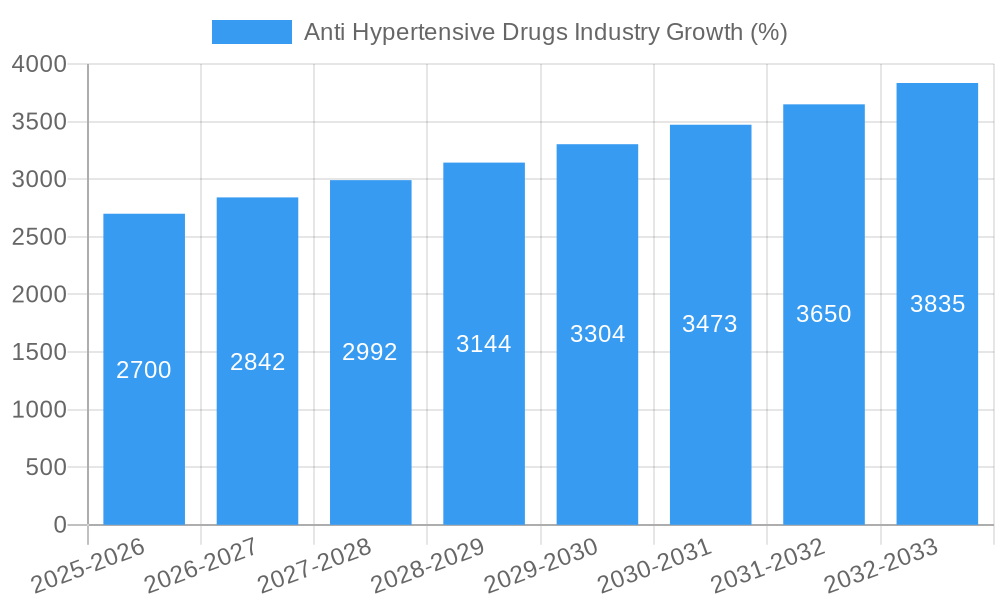
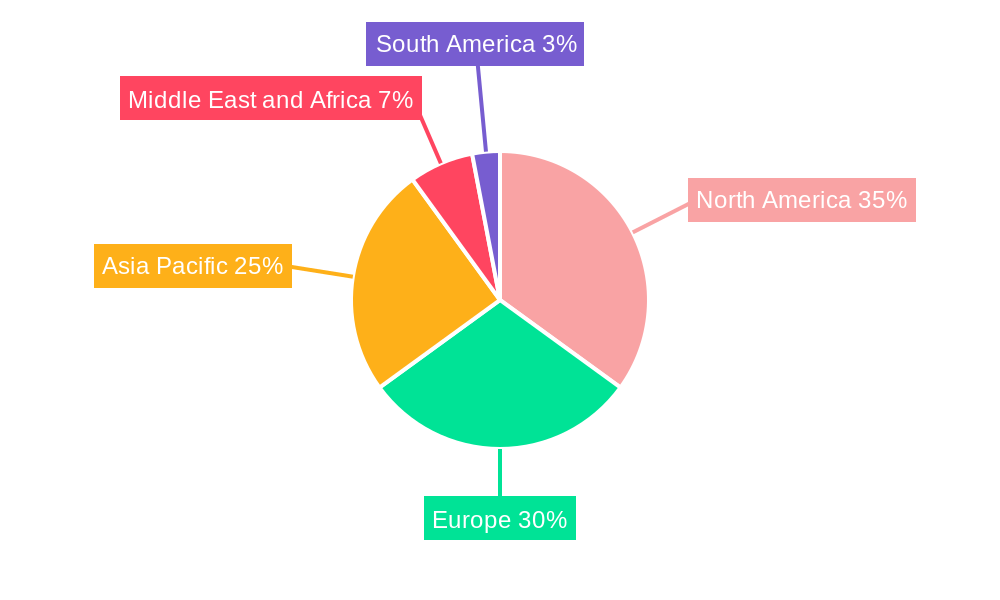
The global antihypertensive drugs market, valued at approximately $60 billion in 2025, is projected to experience steady growth, driven by rising prevalence of hypertension, an aging global population, and increasing healthcare expenditure. A compound annual growth rate (CAGR) of 4.5% from 2025 to 2033 indicates a substantial market expansion, reaching an estimated $90 billion by 2033. Key drivers include improved diagnostic capabilities, increased awareness of hypertension's long-term health consequences, and the introduction of novel, more effective, and better-tolerated medications. Market segmentation reveals that ACE inhibitors, ARBs, and calcium channel blockers constitute significant portions of the market, reflecting their established efficacy and widespread use. However, the market faces certain restraints, including the potential for adverse drug reactions, the emergence of generic competition impacting pricing strategies, and the need for patient adherence to long-term medication regimens. Geographical analysis shows that North America and Europe currently hold the largest market shares due to high healthcare spending and advanced medical infrastructure, but the Asia-Pacific region is expected to witness significant growth in the coming years, fueled by rising healthcare awareness and increasing disposable incomes.
The competitive landscape is characterized by a mix of established pharmaceutical giants and emerging players. Companies such as Sanofi, Daiichi Sankyo, Merck KGaA, Novartis, AstraZeneca, Johnson & Johnson, and Pfizer are key market participants, continuously investing in research and development to enhance existing therapies and develop innovative antihypertensive medications. The development of personalized medicine approaches tailored to individual patient profiles and genetic predispositions is anticipated to further shape market dynamics. Furthermore, the growing adoption of telemedicine and remote patient monitoring technologies offers opportunities for improved medication adherence and disease management, contributing to overall market growth. However, challenges remain in ensuring equitable access to affordable and high-quality antihypertensive drugs across different regions and socioeconomic groups. Future market growth will depend heavily on addressing these challenges and continuing advancements in drug development and delivery systems.
This in-depth report provides a comprehensive analysis of the global anti-hypertensive drugs market, encompassing market dynamics, growth trends, regional performance, product landscape, key players, and future outlook. The study period covers 2019-2033, with a base year of 2025 and a forecast period of 2025-2033. The report is invaluable for pharmaceutical companies, investors, researchers, and healthcare professionals seeking to understand and navigate this crucial sector. The market is segmented by therapeutic class, enabling a granular understanding of market dynamics within each segment.
Anti Hypertensive Drugs Industry Market Dynamics & Structure
The global anti-hypertensive drugs market is a complex landscape shaped by numerous factors influencing its structure and dynamics. Market concentration is moderately high, with several major players holding significant shares. Technological innovation, particularly in drug delivery systems and combination therapies, is a key driver, while stringent regulatory frameworks influence market entry and product approval. The market also faces competition from alternative therapies and lifestyle modifications. End-user demographics, primarily the aging global population and increasing prevalence of cardiovascular diseases, are significant growth catalysts. M&A activity within the pharmaceutical sector, reflected in xx major deals in the past five years, further shapes market consolidation.
- Market Concentration: Moderately high, with top 10 players holding approximately xx% market share in 2024.
- Technological Innovation: Focus on developing more effective and safer combination therapies, targeted drug delivery systems, and personalized medicine approaches.
- Regulatory Landscape: Stringent regulatory approvals and post-market surveillance impact time-to-market and overall cost.
- Competitive Substitutes: Lifestyle changes (diet, exercise), and alternative therapeutic approaches.
- End-User Demographics: Aging population and increasing prevalence of hypertension are key drivers of market growth.
- M&A Trends: xx major mergers and acquisitions occurred between 2019 and 2024, shaping the competitive landscape.
Anti Hypertensive Drugs Industry Growth Trends & Insights
The anti-hypertensive drugs market experienced significant growth during the historical period (2019-2024), primarily driven by the rising prevalence of hypertension globally. The market size reached xx million units in 2024, exhibiting a CAGR of xx% during this period. The adoption rate of anti-hypertensive drugs continues to increase, particularly in developing economies with growing awareness of cardiovascular health risks. Technological advancements in drug formulation and delivery systems have enhanced efficacy and patient compliance, positively influencing market growth. However, generic competition and price pressures pose challenges to market expansion. Consumer behavior is shifting towards increased preference for convenient dosage forms and combination therapies. The forecast period (2025-2033) is projected to witness sustained growth, with a forecasted CAGR of xx%, reaching xx million units by 2033.
Dominant Regions, Countries, or Segments in Anti Hypertensive Drugs Industry
The North American and European markets currently dominate the anti-hypertensive drugs market, driven by high healthcare expenditure, advanced healthcare infrastructure, and a large elderly population. However, emerging markets in Asia-Pacific and Latin America are exhibiting rapid growth due to rising prevalence of hypertension and increasing healthcare awareness.
By Therapeutic Class:
- ACE Inhibitors: Maintaining a significant market share due to established efficacy and widespread adoption. Projected to grow at xx% CAGR.
- ARBs: Exhibiting strong growth driven by improved tolerability compared to ACE inhibitors. Projected to grow at xx% CAGR.
- Calcium Channel Blockers: A substantial segment, projected to grow at xx% CAGR due to its efficacy and widespread usage.
- Diuretics: Still a significant market segment, though growth is comparatively slower than other classes, due to established use and generics market. Projected to grow at xx% CAGR.
Key Drivers:
- Rising prevalence of hypertension and cardiovascular diseases.
- Increasing healthcare expenditure and insurance coverage.
- Growing awareness of cardiovascular health risks.
- Technological advancements in drug delivery and formulation.
Dominance Factors:
- High prevalence of hypertension.
- Strong healthcare infrastructure.
- High healthcare spending per capita.
Anti Hypertensive Drugs Industry Product Landscape
The anti-hypertensive drug market offers a wide range of products categorized by therapeutic class, dosage forms (tablets, capsules, injections), and delivery systems. Recent innovations focus on combination therapies offering superior efficacy and improved patient compliance. These combination products often integrate two or more anti-hypertensive agents to optimize blood pressure control. Technological advancements are leading to the development of novel drug delivery systems for improved bioavailability and reduced side effects. Unique selling propositions include extended-release formulations, targeted drug delivery, and personalized treatment strategies.
Key Drivers, Barriers & Challenges in Anti Hypertensive Drugs Industry
Key Drivers:
- The global rise in hypertension prevalence, especially in developing nations.
- Increasing healthcare expenditure and insurance coverage leading to greater access to treatment.
- Advancements in drug development resulting in safer and more effective medications.
Key Challenges and Restraints:
- The emergence of generic competition eroding the profit margins of brand-name drugs.
- Stringent regulatory pathways and approvals delaying the market launch of new drugs.
- Supply chain disruptions and fluctuations in raw material prices impacting production and distribution. This is estimated to have reduced market growth by xx% in 2022.
Emerging Opportunities in Anti Hypertensive Drugs Industry
- Untapped markets: Growing focus on expanding access to treatment in under-served regions.
- Innovative applications: Development of personalized medicine approaches and combination therapies.
- Evolving consumer preferences: Increased demand for convenient dosage forms and improved patient compliance strategies.
- Biosimilars: The development and launch of biosimilars is creating opportunities for cost-effective therapies.
Growth Accelerators in the Anti Hypertensive Drugs Industry Industry
Long-term growth will be fueled by continued innovation in drug development and delivery, strategic partnerships to expand market reach, and successful penetration into emerging economies. Focus on personalized medicine, utilizing genomic data to tailor treatments, is expected to be a significant growth catalyst.
Key Players Shaping the Anti Hypertensive Drugs Industry Market
- Sanofi SA
- Daiichi Sankyo Company Limited
- Merck KGaA
- Novartis International AG
- Ranbaxy Laboratories Limited
- C H Boehringer Sohn AG & Ko KG
- AstraZeneca PLC
- Johnson & Johnson
- Lupin Limited
- Noden Pharma DAC
- Pfizer Inc
Notable Milestones in Anti Hypertensive Drugs Industry Sector
- May 2022: Hanmi Pharmaceutical launched Amosartan (Meiyaping) in China, the first homegrown blood pressure combination therapy in the Chinese market.
- March 2022: Pfizer Inc. recalled a blood pressure drug due to elevated levels of a potentially cancer-causing impurity.
In-Depth Anti Hypertensive Drugs Industry Market Outlook
The future of the anti-hypertensive drugs market is promising, driven by factors such as the aging global population, increasing prevalence of hypertension, and ongoing advancements in drug development. Strategic opportunities lie in developing innovative combination therapies, personalized medicine approaches, and expanding access to treatment in underserved populations. The market is expected to experience continued growth, propelled by technological breakthroughs and strategic partnerships, leading to improved patient outcomes and significant market expansion.
Anti Hypertensive Drugs Industry Segmentation
-
1. Therapeutic Class
- 1.1. Diuretics
- 1.2. Angiotensin Converting Enzyme (ACE) Inhibitors
- 1.3. Angiotensin Receptor Blockers (ARBs)
- 1.4. Beta Blockers
- 1.5. Alpha Blockers
- 1.6. Renin Inhibitors
- 1.7. Calcium Channel Blockers
- 1.8. Other Therapeutic Classes
Anti Hypertensive Drugs Industry Segmentation By Geography
-
1. North America
- 1.1. United States
- 1.2. Canada
- 1.3. Mexico
-
2. Europe
- 2.1. Germany
- 2.2. United Kingdom
- 2.3. France
- 2.4. Italy
- 2.5. Spain
- 2.6. Rest of Europe
-
3. Asia Pacific
- 3.1. China
- 3.2. Japan
- 3.3. India
- 3.4. Australia
- 3.5. South korea
- 3.6. Rest of Asia Pacific
-
4. Middle East and Africa
- 4.1. GCC
- 4.2. South Africa
- 4.3. Rest of Middle East and Africa
-
5. South America
- 5.1. Brazil
- 5.2. Argentina
- 5.3. Rest of South America
Anti Hypertensive Drugs Industry REPORT HIGHLIGHTS
| Aspects | Details |
|---|---|
| Study Period | 2019-2033 |
| Base Year | 2024 |
| Estimated Year | 2025 |
| Forecast Period | 2025-2033 |
| Historical Period | 2019-2024 |
| Growth Rate | CAGR of 4.50% from 2019-2033 |
| Segmentation |
|
Table of Contents
- 1. Introduction
- 1.1. Research Scope
- 1.2. Market Segmentation
- 1.3. Research Methodology
- 1.4. Definitions and Assumptions
- 2. Executive Summary
- 2.1. Introduction
- 3. Market Dynamics
- 3.1. Introduction
- 3.2. Market Drivers
- 3.2.1. Increasing Prevalence of Hypertension; Growing Initiatives by Private and Government Organizations; Rising Awareness about Hypertension
- 3.3. Market Restrains
- 3.3.1. Multiple Major Drug Patent Expiration; Side-effects of Treatment Options and Rise in Non-pharmacological Therapy
- 3.4. Market Trends
- 3.4.1. Diuretics Therapeutics Class is Expected to Hold a Significant Market Share in the Forecast Period
- 4. Market Factor Analysis
- 4.1. Porters Five Forces
- 4.2. Supply/Value Chain
- 4.3. PESTEL analysis
- 4.4. Market Entropy
- 4.5. Patent/Trademark Analysis
- 5. Global Anti Hypertensive Drugs Industry Analysis, Insights and Forecast, 2019-2031
- 5.1. Market Analysis, Insights and Forecast - by Therapeutic Class
- 5.1.1. Diuretics
- 5.1.2. Angiotensin Converting Enzyme (ACE) Inhibitors
- 5.1.3. Angiotensin Receptor Blockers (ARBs)
- 5.1.4. Beta Blockers
- 5.1.5. Alpha Blockers
- 5.1.6. Renin Inhibitors
- 5.1.7. Calcium Channel Blockers
- 5.1.8. Other Therapeutic Classes
- 5.2. Market Analysis, Insights and Forecast - by Region
- 5.2.1. North America
- 5.2.2. Europe
- 5.2.3. Asia Pacific
- 5.2.4. Middle East and Africa
- 5.2.5. South America
- 5.1. Market Analysis, Insights and Forecast - by Therapeutic Class
- 6. North America Anti Hypertensive Drugs Industry Analysis, Insights and Forecast, 2019-2031
- 6.1. Market Analysis, Insights and Forecast - by Therapeutic Class
- 6.1.1. Diuretics
- 6.1.2. Angiotensin Converting Enzyme (ACE) Inhibitors
- 6.1.3. Angiotensin Receptor Blockers (ARBs)
- 6.1.4. Beta Blockers
- 6.1.5. Alpha Blockers
- 6.1.6. Renin Inhibitors
- 6.1.7. Calcium Channel Blockers
- 6.1.8. Other Therapeutic Classes
- 6.1. Market Analysis, Insights and Forecast - by Therapeutic Class
- 7. Europe Anti Hypertensive Drugs Industry Analysis, Insights and Forecast, 2019-2031
- 7.1. Market Analysis, Insights and Forecast - by Therapeutic Class
- 7.1.1. Diuretics
- 7.1.2. Angiotensin Converting Enzyme (ACE) Inhibitors
- 7.1.3. Angiotensin Receptor Blockers (ARBs)
- 7.1.4. Beta Blockers
- 7.1.5. Alpha Blockers
- 7.1.6. Renin Inhibitors
- 7.1.7. Calcium Channel Blockers
- 7.1.8. Other Therapeutic Classes
- 7.1. Market Analysis, Insights and Forecast - by Therapeutic Class
- 8. Asia Pacific Anti Hypertensive Drugs Industry Analysis, Insights and Forecast, 2019-2031
- 8.1. Market Analysis, Insights and Forecast - by Therapeutic Class
- 8.1.1. Diuretics
- 8.1.2. Angiotensin Converting Enzyme (ACE) Inhibitors
- 8.1.3. Angiotensin Receptor Blockers (ARBs)
- 8.1.4. Beta Blockers
- 8.1.5. Alpha Blockers
- 8.1.6. Renin Inhibitors
- 8.1.7. Calcium Channel Blockers
- 8.1.8. Other Therapeutic Classes
- 8.1. Market Analysis, Insights and Forecast - by Therapeutic Class
- 9. Middle East and Africa Anti Hypertensive Drugs Industry Analysis, Insights and Forecast, 2019-2031
- 9.1. Market Analysis, Insights and Forecast - by Therapeutic Class
- 9.1.1. Diuretics
- 9.1.2. Angiotensin Converting Enzyme (ACE) Inhibitors
- 9.1.3. Angiotensin Receptor Blockers (ARBs)
- 9.1.4. Beta Blockers
- 9.1.5. Alpha Blockers
- 9.1.6. Renin Inhibitors
- 9.1.7. Calcium Channel Blockers
- 9.1.8. Other Therapeutic Classes
- 9.1. Market Analysis, Insights and Forecast - by Therapeutic Class
- 10. South America Anti Hypertensive Drugs Industry Analysis, Insights and Forecast, 2019-2031
- 10.1. Market Analysis, Insights and Forecast - by Therapeutic Class
- 10.1.1. Diuretics
- 10.1.2. Angiotensin Converting Enzyme (ACE) Inhibitors
- 10.1.3. Angiotensin Receptor Blockers (ARBs)
- 10.1.4. Beta Blockers
- 10.1.5. Alpha Blockers
- 10.1.6. Renin Inhibitors
- 10.1.7. Calcium Channel Blockers
- 10.1.8. Other Therapeutic Classes
- 10.1. Market Analysis, Insights and Forecast - by Therapeutic Class
- 11. North America Anti Hypertensive Drugs Industry Analysis, Insights and Forecast, 2019-2031
- 11.1. Market Analysis, Insights and Forecast - By Country/Sub-region
- 11.1.1. undefined
- 12. Europe Anti Hypertensive Drugs Industry Analysis, Insights and Forecast, 2019-2031
- 12.1. Market Analysis, Insights and Forecast - By Country/Sub-region
- 12.1.1. undefined
- 13. Asia Pacific Anti Hypertensive Drugs Industry Analysis, Insights and Forecast, 2019-2031
- 13.1. Market Analysis, Insights and Forecast - By Country/Sub-region
- 13.1.1. undefined
- 14. Middle East and Africa Anti Hypertensive Drugs Industry Analysis, Insights and Forecast, 2019-2031
- 14.1. Market Analysis, Insights and Forecast - By Country/Sub-region
- 14.1.1. undefined
- 15. South America Anti Hypertensive Drugs Industry Analysis, Insights and Forecast, 2019-2031
- 15.1. Market Analysis, Insights and Forecast - By Country/Sub-region
- 15.1.1. undefined
- 16. Competitive Analysis
- 16.1. Global Market Share Analysis 2024
- 16.2. Company Profiles
- 16.2.1 Sanofi SA
- 16.2.1.1. Overview
- 16.2.1.2. Products
- 16.2.1.3. SWOT Analysis
- 16.2.1.4. Recent Developments
- 16.2.1.5. Financials (Based on Availability)
- 16.2.2 Daiichi Sankyo Company Limited
- 16.2.2.1. Overview
- 16.2.2.2. Products
- 16.2.2.3. SWOT Analysis
- 16.2.2.4. Recent Developments
- 16.2.2.5. Financials (Based on Availability)
- 16.2.3 Merck KGaA
- 16.2.3.1. Overview
- 16.2.3.2. Products
- 16.2.3.3. SWOT Analysis
- 16.2.3.4. Recent Developments
- 16.2.3.5. Financials (Based on Availability)
- 16.2.4 Novartis International AG
- 16.2.4.1. Overview
- 16.2.4.2. Products
- 16.2.4.3. SWOT Analysis
- 16.2.4.4. Recent Developments
- 16.2.4.5. Financials (Based on Availability)
- 16.2.5 Ranbaxy Laboratories Limited
- 16.2.5.1. Overview
- 16.2.5.2. Products
- 16.2.5.3. SWOT Analysis
- 16.2.5.4. Recent Developments
- 16.2.5.5. Financials (Based on Availability)
- 16.2.6 C H Boehringer Sohn AG & Ko KG
- 16.2.6.1. Overview
- 16.2.6.2. Products
- 16.2.6.3. SWOT Analysis
- 16.2.6.4. Recent Developments
- 16.2.6.5. Financials (Based on Availability)
- 16.2.7 AstraZeneca PLC
- 16.2.7.1. Overview
- 16.2.7.2. Products
- 16.2.7.3. SWOT Analysis
- 16.2.7.4. Recent Developments
- 16.2.7.5. Financials (Based on Availability)
- 16.2.8 Johnson & Johnson
- 16.2.8.1. Overview
- 16.2.8.2. Products
- 16.2.8.3. SWOT Analysis
- 16.2.8.4. Recent Developments
- 16.2.8.5. Financials (Based on Availability)
- 16.2.9 Lupin Limited
- 16.2.9.1. Overview
- 16.2.9.2. Products
- 16.2.9.3. SWOT Analysis
- 16.2.9.4. Recent Developments
- 16.2.9.5. Financials (Based on Availability)
- 16.2.10 Noden Pharma DAC
- 16.2.10.1. Overview
- 16.2.10.2. Products
- 16.2.10.3. SWOT Analysis
- 16.2.10.4. Recent Developments
- 16.2.10.5. Financials (Based on Availability)
- 16.2.11 Pfizer Inc
- 16.2.11.1. Overview
- 16.2.11.2. Products
- 16.2.11.3. SWOT Analysis
- 16.2.11.4. Recent Developments
- 16.2.11.5. Financials (Based on Availability)
- 16.2.1 Sanofi SA
List of Figures
- Figure 1: Global Anti Hypertensive Drugs Industry Revenue Breakdown (Million, %) by Region 2024 & 2032
- Figure 2: Global Anti Hypertensive Drugs Industry Volume Breakdown (K Unit, %) by Region 2024 & 2032
- Figure 3: North America Anti Hypertensive Drugs Industry Revenue (Million), by Country 2024 & 2032
- Figure 4: North America Anti Hypertensive Drugs Industry Volume (K Unit), by Country 2024 & 2032
- Figure 5: North America Anti Hypertensive Drugs Industry Revenue Share (%), by Country 2024 & 2032
- Figure 6: North America Anti Hypertensive Drugs Industry Volume Share (%), by Country 2024 & 2032
- Figure 7: Europe Anti Hypertensive Drugs Industry Revenue (Million), by Country 2024 & 2032
- Figure 8: Europe Anti Hypertensive Drugs Industry Volume (K Unit), by Country 2024 & 2032
- Figure 9: Europe Anti Hypertensive Drugs Industry Revenue Share (%), by Country 2024 & 2032
- Figure 10: Europe Anti Hypertensive Drugs Industry Volume Share (%), by Country 2024 & 2032
- Figure 11: Asia Pacific Anti Hypertensive Drugs Industry Revenue (Million), by Country 2024 & 2032
- Figure 12: Asia Pacific Anti Hypertensive Drugs Industry Volume (K Unit), by Country 2024 & 2032
- Figure 13: Asia Pacific Anti Hypertensive Drugs Industry Revenue Share (%), by Country 2024 & 2032
- Figure 14: Asia Pacific Anti Hypertensive Drugs Industry Volume Share (%), by Country 2024 & 2032
- Figure 15: Middle East and Africa Anti Hypertensive Drugs Industry Revenue (Million), by Country 2024 & 2032
- Figure 16: Middle East and Africa Anti Hypertensive Drugs Industry Volume (K Unit), by Country 2024 & 2032
- Figure 17: Middle East and Africa Anti Hypertensive Drugs Industry Revenue Share (%), by Country 2024 & 2032
- Figure 18: Middle East and Africa Anti Hypertensive Drugs Industry Volume Share (%), by Country 2024 & 2032
- Figure 19: South America Anti Hypertensive Drugs Industry Revenue (Million), by Country 2024 & 2032
- Figure 20: South America Anti Hypertensive Drugs Industry Volume (K Unit), by Country 2024 & 2032
- Figure 21: South America Anti Hypertensive Drugs Industry Revenue Share (%), by Country 2024 & 2032
- Figure 22: South America Anti Hypertensive Drugs Industry Volume Share (%), by Country 2024 & 2032
- Figure 23: North America Anti Hypertensive Drugs Industry Revenue (Million), by Therapeutic Class 2024 & 2032
- Figure 24: North America Anti Hypertensive Drugs Industry Volume (K Unit), by Therapeutic Class 2024 & 2032
- Figure 25: North America Anti Hypertensive Drugs Industry Revenue Share (%), by Therapeutic Class 2024 & 2032
- Figure 26: North America Anti Hypertensive Drugs Industry Volume Share (%), by Therapeutic Class 2024 & 2032
- Figure 27: North America Anti Hypertensive Drugs Industry Revenue (Million), by Country 2024 & 2032
- Figure 28: North America Anti Hypertensive Drugs Industry Volume (K Unit), by Country 2024 & 2032
- Figure 29: North America Anti Hypertensive Drugs Industry Revenue Share (%), by Country 2024 & 2032
- Figure 30: North America Anti Hypertensive Drugs Industry Volume Share (%), by Country 2024 & 2032
- Figure 31: Europe Anti Hypertensive Drugs Industry Revenue (Million), by Therapeutic Class 2024 & 2032
- Figure 32: Europe Anti Hypertensive Drugs Industry Volume (K Unit), by Therapeutic Class 2024 & 2032
- Figure 33: Europe Anti Hypertensive Drugs Industry Revenue Share (%), by Therapeutic Class 2024 & 2032
- Figure 34: Europe Anti Hypertensive Drugs Industry Volume Share (%), by Therapeutic Class 2024 & 2032
- Figure 35: Europe Anti Hypertensive Drugs Industry Revenue (Million), by Country 2024 & 2032
- Figure 36: Europe Anti Hypertensive Drugs Industry Volume (K Unit), by Country 2024 & 2032
- Figure 37: Europe Anti Hypertensive Drugs Industry Revenue Share (%), by Country 2024 & 2032
- Figure 38: Europe Anti Hypertensive Drugs Industry Volume Share (%), by Country 2024 & 2032
- Figure 39: Asia Pacific Anti Hypertensive Drugs Industry Revenue (Million), by Therapeutic Class 2024 & 2032
- Figure 40: Asia Pacific Anti Hypertensive Drugs Industry Volume (K Unit), by Therapeutic Class 2024 & 2032
- Figure 41: Asia Pacific Anti Hypertensive Drugs Industry Revenue Share (%), by Therapeutic Class 2024 & 2032
- Figure 42: Asia Pacific Anti Hypertensive Drugs Industry Volume Share (%), by Therapeutic Class 2024 & 2032
- Figure 43: Asia Pacific Anti Hypertensive Drugs Industry Revenue (Million), by Country 2024 & 2032
- Figure 44: Asia Pacific Anti Hypertensive Drugs Industry Volume (K Unit), by Country 2024 & 2032
- Figure 45: Asia Pacific Anti Hypertensive Drugs Industry Revenue Share (%), by Country 2024 & 2032
- Figure 46: Asia Pacific Anti Hypertensive Drugs Industry Volume Share (%), by Country 2024 & 2032
- Figure 47: Middle East and Africa Anti Hypertensive Drugs Industry Revenue (Million), by Therapeutic Class 2024 & 2032
- Figure 48: Middle East and Africa Anti Hypertensive Drugs Industry Volume (K Unit), by Therapeutic Class 2024 & 2032
- Figure 49: Middle East and Africa Anti Hypertensive Drugs Industry Revenue Share (%), by Therapeutic Class 2024 & 2032
- Figure 50: Middle East and Africa Anti Hypertensive Drugs Industry Volume Share (%), by Therapeutic Class 2024 & 2032
- Figure 51: Middle East and Africa Anti Hypertensive Drugs Industry Revenue (Million), by Country 2024 & 2032
- Figure 52: Middle East and Africa Anti Hypertensive Drugs Industry Volume (K Unit), by Country 2024 & 2032
- Figure 53: Middle East and Africa Anti Hypertensive Drugs Industry Revenue Share (%), by Country 2024 & 2032
- Figure 54: Middle East and Africa Anti Hypertensive Drugs Industry Volume Share (%), by Country 2024 & 2032
- Figure 55: South America Anti Hypertensive Drugs Industry Revenue (Million), by Therapeutic Class 2024 & 2032
- Figure 56: South America Anti Hypertensive Drugs Industry Volume (K Unit), by Therapeutic Class 2024 & 2032
- Figure 57: South America Anti Hypertensive Drugs Industry Revenue Share (%), by Therapeutic Class 2024 & 2032
- Figure 58: South America Anti Hypertensive Drugs Industry Volume Share (%), by Therapeutic Class 2024 & 2032
- Figure 59: South America Anti Hypertensive Drugs Industry Revenue (Million), by Country 2024 & 2032
- Figure 60: South America Anti Hypertensive Drugs Industry Volume (K Unit), by Country 2024 & 2032
- Figure 61: South America Anti Hypertensive Drugs Industry Revenue Share (%), by Country 2024 & 2032
- Figure 62: South America Anti Hypertensive Drugs Industry Volume Share (%), by Country 2024 & 2032
List of Tables
- Table 1: Global Anti Hypertensive Drugs Industry Revenue Million Forecast, by Region 2019 & 2032
- Table 2: Global Anti Hypertensive Drugs Industry Volume K Unit Forecast, by Region 2019 & 2032
- Table 3: Global Anti Hypertensive Drugs Industry Revenue Million Forecast, by Therapeutic Class 2019 & 2032
- Table 4: Global Anti Hypertensive Drugs Industry Volume K Unit Forecast, by Therapeutic Class 2019 & 2032
- Table 5: Global Anti Hypertensive Drugs Industry Revenue Million Forecast, by Region 2019 & 2032
- Table 6: Global Anti Hypertensive Drugs Industry Volume K Unit Forecast, by Region 2019 & 2032
- Table 7: Global Anti Hypertensive Drugs Industry Revenue Million Forecast, by Country 2019 & 2032
- Table 8: Global Anti Hypertensive Drugs Industry Volume K Unit Forecast, by Country 2019 & 2032
- Table 9: Global Anti Hypertensive Drugs Industry Revenue Million Forecast, by Country 2019 & 2032
- Table 10: Global Anti Hypertensive Drugs Industry Volume K Unit Forecast, by Country 2019 & 2032
- Table 11: Global Anti Hypertensive Drugs Industry Revenue Million Forecast, by Country 2019 & 2032
- Table 12: Global Anti Hypertensive Drugs Industry Volume K Unit Forecast, by Country 2019 & 2032
- Table 13: Global Anti Hypertensive Drugs Industry Revenue Million Forecast, by Country 2019 & 2032
- Table 14: Global Anti Hypertensive Drugs Industry Volume K Unit Forecast, by Country 2019 & 2032
- Table 15: Global Anti Hypertensive Drugs Industry Revenue Million Forecast, by Country 2019 & 2032
- Table 16: Global Anti Hypertensive Drugs Industry Volume K Unit Forecast, by Country 2019 & 2032
- Table 17: Global Anti Hypertensive Drugs Industry Revenue Million Forecast, by Therapeutic Class 2019 & 2032
- Table 18: Global Anti Hypertensive Drugs Industry Volume K Unit Forecast, by Therapeutic Class 2019 & 2032
- Table 19: Global Anti Hypertensive Drugs Industry Revenue Million Forecast, by Country 2019 & 2032
- Table 20: Global Anti Hypertensive Drugs Industry Volume K Unit Forecast, by Country 2019 & 2032
- Table 21: United States Anti Hypertensive Drugs Industry Revenue (Million) Forecast, by Application 2019 & 2032
- Table 22: United States Anti Hypertensive Drugs Industry Volume (K Unit) Forecast, by Application 2019 & 2032
- Table 23: Canada Anti Hypertensive Drugs Industry Revenue (Million) Forecast, by Application 2019 & 2032
- Table 24: Canada Anti Hypertensive Drugs Industry Volume (K Unit) Forecast, by Application 2019 & 2032
- Table 25: Mexico Anti Hypertensive Drugs Industry Revenue (Million) Forecast, by Application 2019 & 2032
- Table 26: Mexico Anti Hypertensive Drugs Industry Volume (K Unit) Forecast, by Application 2019 & 2032
- Table 27: Global Anti Hypertensive Drugs Industry Revenue Million Forecast, by Therapeutic Class 2019 & 2032
- Table 28: Global Anti Hypertensive Drugs Industry Volume K Unit Forecast, by Therapeutic Class 2019 & 2032
- Table 29: Global Anti Hypertensive Drugs Industry Revenue Million Forecast, by Country 2019 & 2032
- Table 30: Global Anti Hypertensive Drugs Industry Volume K Unit Forecast, by Country 2019 & 2032
- Table 31: Germany Anti Hypertensive Drugs Industry Revenue (Million) Forecast, by Application 2019 & 2032
- Table 32: Germany Anti Hypertensive Drugs Industry Volume (K Unit) Forecast, by Application 2019 & 2032
- Table 33: United Kingdom Anti Hypertensive Drugs Industry Revenue (Million) Forecast, by Application 2019 & 2032
- Table 34: United Kingdom Anti Hypertensive Drugs Industry Volume (K Unit) Forecast, by Application 2019 & 2032
- Table 35: France Anti Hypertensive Drugs Industry Revenue (Million) Forecast, by Application 2019 & 2032
- Table 36: France Anti Hypertensive Drugs Industry Volume (K Unit) Forecast, by Application 2019 & 2032
- Table 37: Italy Anti Hypertensive Drugs Industry Revenue (Million) Forecast, by Application 2019 & 2032
- Table 38: Italy Anti Hypertensive Drugs Industry Volume (K Unit) Forecast, by Application 2019 & 2032
- Table 39: Spain Anti Hypertensive Drugs Industry Revenue (Million) Forecast, by Application 2019 & 2032
- Table 40: Spain Anti Hypertensive Drugs Industry Volume (K Unit) Forecast, by Application 2019 & 2032
- Table 41: Rest of Europe Anti Hypertensive Drugs Industry Revenue (Million) Forecast, by Application 2019 & 2032
- Table 42: Rest of Europe Anti Hypertensive Drugs Industry Volume (K Unit) Forecast, by Application 2019 & 2032
- Table 43: Global Anti Hypertensive Drugs Industry Revenue Million Forecast, by Therapeutic Class 2019 & 2032
- Table 44: Global Anti Hypertensive Drugs Industry Volume K Unit Forecast, by Therapeutic Class 2019 & 2032
- Table 45: Global Anti Hypertensive Drugs Industry Revenue Million Forecast, by Country 2019 & 2032
- Table 46: Global Anti Hypertensive Drugs Industry Volume K Unit Forecast, by Country 2019 & 2032
- Table 47: China Anti Hypertensive Drugs Industry Revenue (Million) Forecast, by Application 2019 & 2032
- Table 48: China Anti Hypertensive Drugs Industry Volume (K Unit) Forecast, by Application 2019 & 2032
- Table 49: Japan Anti Hypertensive Drugs Industry Revenue (Million) Forecast, by Application 2019 & 2032
- Table 50: Japan Anti Hypertensive Drugs Industry Volume (K Unit) Forecast, by Application 2019 & 2032
- Table 51: India Anti Hypertensive Drugs Industry Revenue (Million) Forecast, by Application 2019 & 2032
- Table 52: India Anti Hypertensive Drugs Industry Volume (K Unit) Forecast, by Application 2019 & 2032
- Table 53: Australia Anti Hypertensive Drugs Industry Revenue (Million) Forecast, by Application 2019 & 2032
- Table 54: Australia Anti Hypertensive Drugs Industry Volume (K Unit) Forecast, by Application 2019 & 2032
- Table 55: South korea Anti Hypertensive Drugs Industry Revenue (Million) Forecast, by Application 2019 & 2032
- Table 56: South korea Anti Hypertensive Drugs Industry Volume (K Unit) Forecast, by Application 2019 & 2032
- Table 57: Rest of Asia Pacific Anti Hypertensive Drugs Industry Revenue (Million) Forecast, by Application 2019 & 2032
- Table 58: Rest of Asia Pacific Anti Hypertensive Drugs Industry Volume (K Unit) Forecast, by Application 2019 & 2032
- Table 59: Global Anti Hypertensive Drugs Industry Revenue Million Forecast, by Therapeutic Class 2019 & 2032
- Table 60: Global Anti Hypertensive Drugs Industry Volume K Unit Forecast, by Therapeutic Class 2019 & 2032
- Table 61: Global Anti Hypertensive Drugs Industry Revenue Million Forecast, by Country 2019 & 2032
- Table 62: Global Anti Hypertensive Drugs Industry Volume K Unit Forecast, by Country 2019 & 2032
- Table 63: GCC Anti Hypertensive Drugs Industry Revenue (Million) Forecast, by Application 2019 & 2032
- Table 64: GCC Anti Hypertensive Drugs Industry Volume (K Unit) Forecast, by Application 2019 & 2032
- Table 65: South Africa Anti Hypertensive Drugs Industry Revenue (Million) Forecast, by Application 2019 & 2032
- Table 66: South Africa Anti Hypertensive Drugs Industry Volume (K Unit) Forecast, by Application 2019 & 2032
- Table 67: Rest of Middle East and Africa Anti Hypertensive Drugs Industry Revenue (Million) Forecast, by Application 2019 & 2032
- Table 68: Rest of Middle East and Africa Anti Hypertensive Drugs Industry Volume (K Unit) Forecast, by Application 2019 & 2032
- Table 69: Global Anti Hypertensive Drugs Industry Revenue Million Forecast, by Therapeutic Class 2019 & 2032
- Table 70: Global Anti Hypertensive Drugs Industry Volume K Unit Forecast, by Therapeutic Class 2019 & 2032
- Table 71: Global Anti Hypertensive Drugs Industry Revenue Million Forecast, by Country 2019 & 2032
- Table 72: Global Anti Hypertensive Drugs Industry Volume K Unit Forecast, by Country 2019 & 2032
- Table 73: Brazil Anti Hypertensive Drugs Industry Revenue (Million) Forecast, by Application 2019 & 2032
- Table 74: Brazil Anti Hypertensive Drugs Industry Volume (K Unit) Forecast, by Application 2019 & 2032
- Table 75: Argentina Anti Hypertensive Drugs Industry Revenue (Million) Forecast, by Application 2019 & 2032
- Table 76: Argentina Anti Hypertensive Drugs Industry Volume (K Unit) Forecast, by Application 2019 & 2032
- Table 77: Rest of South America Anti Hypertensive Drugs Industry Revenue (Million) Forecast, by Application 2019 & 2032
- Table 78: Rest of South America Anti Hypertensive Drugs Industry Volume (K Unit) Forecast, by Application 2019 & 2032
Frequently Asked Questions
1. What is the projected Compound Annual Growth Rate (CAGR) of the Anti Hypertensive Drugs Industry?
The projected CAGR is approximately 4.50%.
2. Which companies are prominent players in the Anti Hypertensive Drugs Industry?
Key companies in the market include Sanofi SA, Daiichi Sankyo Company Limited, Merck KGaA, Novartis International AG, Ranbaxy Laboratories Limited, C H Boehringer Sohn AG & Ko KG, AstraZeneca PLC, Johnson & Johnson, Lupin Limited, Noden Pharma DAC, Pfizer Inc.
3. What are the main segments of the Anti Hypertensive Drugs Industry?
The market segments include Therapeutic Class.
4. Can you provide details about the market size?
The market size is estimated to be USD XX Million as of 2022.
5. What are some drivers contributing to market growth?
Increasing Prevalence of Hypertension; Growing Initiatives by Private and Government Organizations; Rising Awareness about Hypertension.
6. What are the notable trends driving market growth?
Diuretics Therapeutics Class is Expected to Hold a Significant Market Share in the Forecast Period.
7. Are there any restraints impacting market growth?
Multiple Major Drug Patent Expiration; Side-effects of Treatment Options and Rise in Non-pharmacological Therapy.
8. Can you provide examples of recent developments in the market?
In May 2022, Hanmi Pharmaceutical revealed that it will start marketing its blockbuster hypertension drug Amosartan under the brand name Meiyaping in China. It marked the first homegrown blood pressure combination therapy to enter the Chinese market.
9. What pricing options are available for accessing the report?
Pricing options include single-user, multi-user, and enterprise licenses priced at USD 4750, USD 5250, and USD 8750 respectively.
10. Is the market size provided in terms of value or volume?
The market size is provided in terms of value, measured in Million and volume, measured in K Unit.
11. Are there any specific market keywords associated with the report?
Yes, the market keyword associated with the report is "Anti Hypertensive Drugs Industry," which aids in identifying and referencing the specific market segment covered.
12. How do I determine which pricing option suits my needs best?
The pricing options vary based on user requirements and access needs. Individual users may opt for single-user licenses, while businesses requiring broader access may choose multi-user or enterprise licenses for cost-effective access to the report.
13. Are there any additional resources or data provided in the Anti Hypertensive Drugs Industry report?
While the report offers comprehensive insights, it's advisable to review the specific contents or supplementary materials provided to ascertain if additional resources or data are available.
14. How can I stay updated on further developments or reports in the Anti Hypertensive Drugs Industry?
To stay informed about further developments, trends, and reports in the Anti Hypertensive Drugs Industry, consider subscribing to industry newsletters, following relevant companies and organizations, or regularly checking reputable industry news sources and publications.
Methodology
Step 1 - Identification of Relevant Samples Size from Population Database


Step 2 - Approaches for Defining Global Market Size (Value, Volume* & Price*)

Note*: In applicable scenarios
Step 3 - Data Sources
Primary Research
- Web Analytics
- Survey Reports
- Research Institute
- Latest Research Reports
- Opinion Leaders
Secondary Research
- Annual Reports
- White Paper
- Latest Press Release
- Industry Association
- Paid Database
- Investor Presentations

Step 4 - Data Triangulation
Involves using different sources of information in order to increase the validity of a study
These sources are likely to be stakeholders in a program - participants, other researchers, program staff, other community members, and so on.
Then we put all data in single framework & apply various statistical tools to find out the dynamic on the market.
During the analysis stage, feedback from the stakeholder groups would be compared to determine areas of agreement as well as areas of divergence


