


Key Insights
The global animal diagnostic imaging systems market is experiencing robust growth, driven by increasing pet ownership, rising veterinary care expenditure, and advancements in imaging technology. The market's value in 2025 is estimated at $2.5 billion, reflecting a significant expansion from the historical period (2019-2024). This growth is fueled by several key factors: the increasing adoption of minimally invasive procedures, enhanced diagnostic capabilities leading to earlier disease detection and improved treatment outcomes, and a rising demand for advanced imaging modalities like ultrasound, X-ray, and MRI in veterinary practices. Furthermore, the development of portable and affordable systems is making diagnostic imaging more accessible to veterinary clinics in both developed and developing countries, thereby further stimulating market expansion. Major players like IDEXX Laboratories, Canon Medical Systems, and Fujifilm are driving innovation through technological advancements and strategic partnerships, ensuring a continuous influx of cutting-edge solutions into the market.
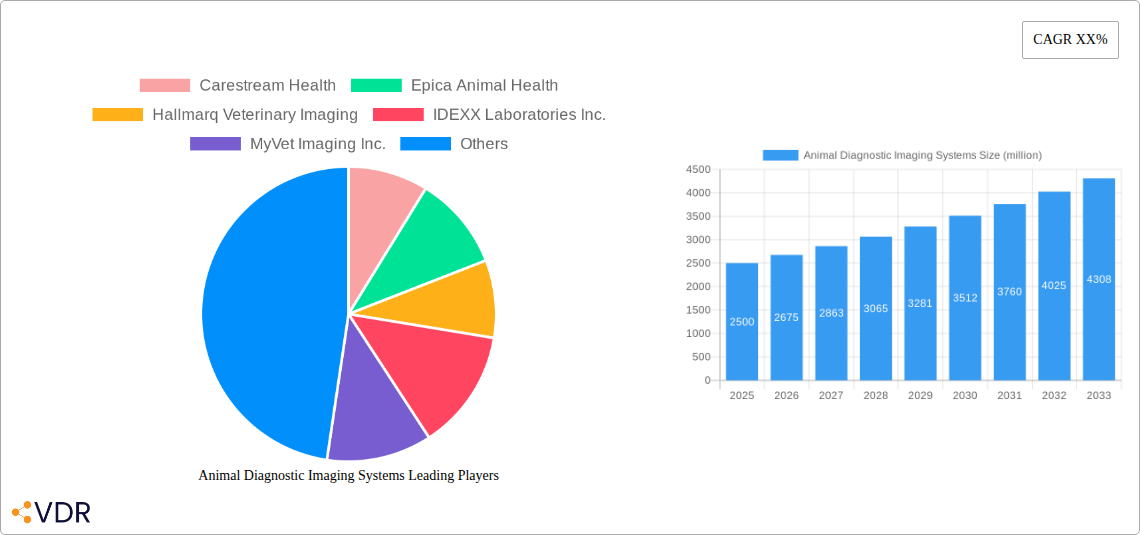
Animal Diagnostic Imaging Systems Market Size (In Billion)

However, the market faces certain challenges. High initial investment costs for advanced imaging systems can restrict adoption, particularly in smaller veterinary clinics. Additionally, the need for skilled technicians and radiologists to operate and interpret the imaging data can create a bottleneck in certain regions. Nevertheless, ongoing technological advancements are addressing these concerns, with the development of user-friendly interfaces and remote diagnostic support systems. The long-term forecast (2025-2033) projects continued market expansion, fueled by persistent industry trends and a growing awareness of the importance of early and accurate diagnosis in animal healthcare. A projected Compound Annual Growth Rate (CAGR) of 7% suggests a substantial increase in market value by 2033, exceeding $4 billion. This growth will be influenced by ongoing technological innovation, increasing investments in veterinary infrastructure, and expanding global pet ownership.

Animal Diagnostic Imaging Systems Company Market Share
Animal Diagnostic Imaging Systems Market Report: 2019-2033
This comprehensive report provides a detailed analysis of the Animal Diagnostic Imaging Systems market, encompassing market dynamics, growth trends, regional insights, product landscape, and key player strategies. The report covers the period from 2019 to 2033, with a focus on the forecast period 2025-2033 and a base year of 2025. The study includes quantitative and qualitative data, offering valuable insights for industry professionals, investors, and stakeholders. The parent market is Veterinary Healthcare, and the child market is Diagnostic Imaging Equipment.
Animal Diagnostic Imaging Systems Market Dynamics & Structure
The global Animal Diagnostic Imaging Systems market, valued at xx million units in 2024, is experiencing significant growth driven by technological advancements, increasing pet ownership, and rising veterinary care expenditure. Market concentration is moderate, with key players like IDEXX Laboratories Inc. and Fujifilm Holdings holding substantial market share, but a number of smaller, specialized companies are also active. Technological innovation, particularly in areas like digital X-ray, ultrasound, and MRI, is a key driver, leading to improved image quality, faster diagnosis, and reduced costs. Regulatory frameworks vary across countries, impacting market access and adoption rates. The market faces competition from substitute technologies and a need for specialized skilled professionals. Consolidation through M&A activity is increasing, with an estimated xx deals closed between 2019 and 2024.
- Market Concentration: Moderately concentrated, with top 5 players holding approximately xx% market share in 2024.
- Technological Innovation: Focus on portable systems, AI-powered image analysis, and advanced imaging modalities.
- Regulatory Framework: Varying regulations across regions affect product approvals and market entry.
- Competitive Substitutes: Limited direct substitutes, but alternative diagnostic techniques pose indirect competition.
- End-User Demographics: Driven by increased pet ownership and rising disposable incomes in developing economies.
- M&A Trends: Consolidation expected to continue, driven by market expansion and technological integration.
Animal Diagnostic Imaging Systems Growth Trends & Insights
The Animal Diagnostic Imaging Systems market is projected to exhibit robust growth during the forecast period (2025-2033), with a Compound Annual Growth Rate (CAGR) of xx%. This growth is fueled by several factors, including the increasing adoption of advanced imaging technologies in veterinary clinics, rising awareness of pet health, and expanding veterinary care infrastructure, particularly in emerging economies. Technological advancements, such as AI-powered image analysis and portable imaging systems, are accelerating market adoption. A shift towards specialized veterinary care and a growing preference for minimally invasive diagnostic procedures are also driving market expansion. Market penetration is expected to increase significantly, reaching xx% by 2033, particularly in regions with high pet ownership and increasing disposable incomes. This is further accelerated by a substantial growth in veterinary practices seeking to upgrade their diagnostic imaging capabilities.
Dominant Regions, Countries, or Segments in Animal Diagnostic Imaging Systems
North America currently dominates the Animal Diagnostic Imaging Systems market, followed by Europe. The high penetration of veterinary clinics, strong pet ownership rates, and advanced healthcare infrastructure contribute significantly to this dominance. However, rapidly growing economies in Asia-Pacific are showing substantial growth potential, driven by rising pet ownership, increasing disposable incomes, and government initiatives to improve animal healthcare infrastructure.
- North America: High market penetration, advanced technology adoption, and well-established veterinary care infrastructure drive growth.
- Europe: Significant market size, driven by strong pet ownership and well-developed healthcare systems.
- Asia-Pacific: Rapid growth potential, fueled by increasing pet ownership, rising disposable incomes, and infrastructural developments.
Animal Diagnostic Imaging Systems Product Landscape
The market encompasses a range of products, including digital X-ray systems, ultrasound machines, MRI systems, and CT scanners. Recent innovations focus on portability, improved image quality, advanced image processing capabilities, and AI-powered diagnostic support. These advancements enhance diagnostic accuracy, reduce procedure times, and improve workflow efficiency in veterinary practices. Unique selling propositions include compact design, user-friendly interfaces, and specialized software for veterinary applications.
Key Drivers, Barriers & Challenges in Animal Diagnostic Imaging Systems
Key Drivers:
- Rising pet ownership and increased pet expenditure on healthcare.
- Technological advancements in imaging modalities and software.
- Increasing demand for accurate and timely diagnoses.
- Growing adoption of advanced veterinary practices.
Key Challenges:
- High initial investment costs for advanced systems.
- Need for specialized training and skilled professionals.
- Regulatory hurdles and varying standards across regions.
- Intense competition among established and emerging players resulting in price wars impacting profitability.
Emerging Opportunities in Animal Diagnostic Imaging Systems
- Expansion into underserved markets in developing countries.
- Development of portable and point-of-care imaging systems.
- Integration of AI and machine learning for improved diagnostic accuracy.
- Growing demand for telemedicine and remote diagnostics.
Growth Accelerators in the Animal Diagnostic Imaging Systems Industry
Technological breakthroughs in areas such as AI-powered image analysis, miniaturization of systems and the development of specialized veterinary imaging software are key growth catalysts. Strategic partnerships between imaging equipment manufacturers and veterinary clinics are also enhancing market penetration. Market expansion strategies targeting underserved regions and segments are further driving growth.
Key Players Shaping the Animal Diagnostic Imaging Systems Market
Notable Milestones in Animal Diagnostic Imaging Systems Sector
- 2020: IDEXX Laboratories launched a new portable ultrasound system.
- 2021: Fujifilm released upgraded veterinary X-ray equipment with enhanced image processing capabilities.
- 2022: A significant merger between two smaller players consolidated market share.
- 2023: Several companies announced the integration of AI into their imaging systems.
In-Depth Animal Diagnostic Imaging Systems Market Outlook
The Animal Diagnostic Imaging Systems market is poised for sustained growth, driven by technological advancements, expanding veterinary care infrastructure, and rising pet ownership globally. Strategic partnerships, focused product development, and targeted expansion into emerging markets will further shape the market landscape. The continued integration of AI and improved diagnostic capabilities will unlock new opportunities, leading to greater market penetration and improved animal healthcare outcomes.
Animal Diagnostic Imaging Systems Segmentation
-
1. Application
- 1.1. Cat
- 1.2. Dog
- 1.3. Hamster
- 1.4. Mink
- 1.5. Others
-
2. Types
- 2.1. Radiographic (X-ray) Systems
- 2.2. Ultrasound Imaging System
- 2.3. Computed Tomography Imaging System
- 2.4. Magnetic Resonance Imaging System
- 2.5. Video Endoscopy Imaging System
- 2.6. Others
Animal Diagnostic Imaging Systems Segmentation By Geography
-
1. North America
- 1.1. United States
- 1.2. Canada
- 1.3. Mexico
-
2. South America
- 2.1. Brazil
- 2.2. Argentina
- 2.3. Rest of South America
-
3. Europe
- 3.1. United Kingdom
- 3.2. Germany
- 3.3. France
- 3.4. Italy
- 3.5. Spain
- 3.6. Russia
- 3.7. Benelux
- 3.8. Nordics
- 3.9. Rest of Europe
-
4. Middle East & Africa
- 4.1. Turkey
- 4.2. Israel
- 4.3. GCC
- 4.4. North Africa
- 4.5. South Africa
- 4.6. Rest of Middle East & Africa
-
5. Asia Pacific
- 5.1. China
- 5.2. India
- 5.3. Japan
- 5.4. South Korea
- 5.5. ASEAN
- 5.6. Oceania
- 5.7. Rest of Asia Pacific

Animal Diagnostic Imaging Systems Regional Market Share
Geographic Coverage of Animal Diagnostic Imaging Systems
Animal Diagnostic Imaging Systems REPORT HIGHLIGHTS
| Aspects | Details |
|---|---|
| Study Period | 2020-2034 |
| Base Year | 2025 |
| Estimated Year | 2026 |
| Forecast Period | 2026-2034 |
| Historical Period | 2020-2025 |
| Growth Rate | CAGR of 7.84% from 2020-2034 |
| Segmentation |
|
Table of Contents
- 1. Introduction
- 1.1. Research Scope
- 1.2. Market Segmentation
- 1.3. Research Methodology
- 1.4. Definitions and Assumptions
- 2. Executive Summary
- 2.1. Introduction
- 3. Market Dynamics
- 3.1. Introduction
- 3.2. Market Drivers
- 3.3. Market Restrains
- 3.4. Market Trends
- 4. Market Factor Analysis
- 4.1. Porters Five Forces
- 4.2. Supply/Value Chain
- 4.3. PESTEL analysis
- 4.4. Market Entropy
- 4.5. Patent/Trademark Analysis
- 5. Global Animal Diagnostic Imaging Systems Analysis, Insights and Forecast, 2020-2032
- 5.1. Market Analysis, Insights and Forecast - by Application
- 5.1.1. Cat
- 5.1.2. Dog
- 5.1.3. Hamster
- 5.1.4. Mink
- 5.1.5. Others
- 5.2. Market Analysis, Insights and Forecast - by Types
- 5.2.1. Radiographic (X-ray) Systems
- 5.2.2. Ultrasound Imaging System
- 5.2.3. Computed Tomography Imaging System
- 5.2.4. Magnetic Resonance Imaging System
- 5.2.5. Video Endoscopy Imaging System
- 5.2.6. Others
- 5.3. Market Analysis, Insights and Forecast - by Region
- 5.3.1. North America
- 5.3.2. South America
- 5.3.3. Europe
- 5.3.4. Middle East & Africa
- 5.3.5. Asia Pacific
- 5.1. Market Analysis, Insights and Forecast - by Application
- 6. North America Animal Diagnostic Imaging Systems Analysis, Insights and Forecast, 2020-2032
- 6.1. Market Analysis, Insights and Forecast - by Application
- 6.1.1. Cat
- 6.1.2. Dog
- 6.1.3. Hamster
- 6.1.4. Mink
- 6.1.5. Others
- 6.2. Market Analysis, Insights and Forecast - by Types
- 6.2.1. Radiographic (X-ray) Systems
- 6.2.2. Ultrasound Imaging System
- 6.2.3. Computed Tomography Imaging System
- 6.2.4. Magnetic Resonance Imaging System
- 6.2.5. Video Endoscopy Imaging System
- 6.2.6. Others
- 6.1. Market Analysis, Insights and Forecast - by Application
- 7. South America Animal Diagnostic Imaging Systems Analysis, Insights and Forecast, 2020-2032
- 7.1. Market Analysis, Insights and Forecast - by Application
- 7.1.1. Cat
- 7.1.2. Dog
- 7.1.3. Hamster
- 7.1.4. Mink
- 7.1.5. Others
- 7.2. Market Analysis, Insights and Forecast - by Types
- 7.2.1. Radiographic (X-ray) Systems
- 7.2.2. Ultrasound Imaging System
- 7.2.3. Computed Tomography Imaging System
- 7.2.4. Magnetic Resonance Imaging System
- 7.2.5. Video Endoscopy Imaging System
- 7.2.6. Others
- 7.1. Market Analysis, Insights and Forecast - by Application
- 8. Europe Animal Diagnostic Imaging Systems Analysis, Insights and Forecast, 2020-2032
- 8.1. Market Analysis, Insights and Forecast - by Application
- 8.1.1. Cat
- 8.1.2. Dog
- 8.1.3. Hamster
- 8.1.4. Mink
- 8.1.5. Others
- 8.2. Market Analysis, Insights and Forecast - by Types
- 8.2.1. Radiographic (X-ray) Systems
- 8.2.2. Ultrasound Imaging System
- 8.2.3. Computed Tomography Imaging System
- 8.2.4. Magnetic Resonance Imaging System
- 8.2.5. Video Endoscopy Imaging System
- 8.2.6. Others
- 8.1. Market Analysis, Insights and Forecast - by Application
- 9. Middle East & Africa Animal Diagnostic Imaging Systems Analysis, Insights and Forecast, 2020-2032
- 9.1. Market Analysis, Insights and Forecast - by Application
- 9.1.1. Cat
- 9.1.2. Dog
- 9.1.3. Hamster
- 9.1.4. Mink
- 9.1.5. Others
- 9.2. Market Analysis, Insights and Forecast - by Types
- 9.2.1. Radiographic (X-ray) Systems
- 9.2.2. Ultrasound Imaging System
- 9.2.3. Computed Tomography Imaging System
- 9.2.4. Magnetic Resonance Imaging System
- 9.2.5. Video Endoscopy Imaging System
- 9.2.6. Others
- 9.1. Market Analysis, Insights and Forecast - by Application
- 10. Asia Pacific Animal Diagnostic Imaging Systems Analysis, Insights and Forecast, 2020-2032
- 10.1. Market Analysis, Insights and Forecast - by Application
- 10.1.1. Cat
- 10.1.2. Dog
- 10.1.3. Hamster
- 10.1.4. Mink
- 10.1.5. Others
- 10.2. Market Analysis, Insights and Forecast - by Types
- 10.2.1. Radiographic (X-ray) Systems
- 10.2.2. Ultrasound Imaging System
- 10.2.3. Computed Tomography Imaging System
- 10.2.4. Magnetic Resonance Imaging System
- 10.2.5. Video Endoscopy Imaging System
- 10.2.6. Others
- 10.1. Market Analysis, Insights and Forecast - by Application
- 11. Competitive Analysis
- 11.1. Global Market Share Analysis 2025
- 11.2. Company Profiles
- 11.2.1 Carestream Health
- 11.2.1.1. Overview
- 11.2.1.2. Products
- 11.2.1.3. SWOT Analysis
- 11.2.1.4. Recent Developments
- 11.2.1.5. Financials (Based on Availability)
- 11.2.2 Epica Animal Health
- 11.2.2.1. Overview
- 11.2.2.2. Products
- 11.2.2.3. SWOT Analysis
- 11.2.2.4. Recent Developments
- 11.2.2.5. Financials (Based on Availability)
- 11.2.3 Hallmarq Veterinary Imaging
- 11.2.3.1. Overview
- 11.2.3.2. Products
- 11.2.3.3. SWOT Analysis
- 11.2.3.4. Recent Developments
- 11.2.3.5. Financials (Based on Availability)
- 11.2.4 IDEXX Laboratories Inc.
- 11.2.4.1. Overview
- 11.2.4.2. Products
- 11.2.4.3. SWOT Analysis
- 11.2.4.4. Recent Developments
- 11.2.4.5. Financials (Based on Availability)
- 11.2.5 MyVet Imaging Inc.
- 11.2.5.1. Overview
- 11.2.5.2. Products
- 11.2.5.3. SWOT Analysis
- 11.2.5.4. Recent Developments
- 11.2.5.5. Financials (Based on Availability)
- 11.2.6 ARI Veterinary Care
- 11.2.6.1. Overview
- 11.2.6.2. Products
- 11.2.6.3. SWOT Analysis
- 11.2.6.4. Recent Developments
- 11.2.6.5. Financials (Based on Availability)
- 11.2.7 Canon Medical Systems Corporation
- 11.2.7.1. Overview
- 11.2.7.2. Products
- 11.2.7.3. SWOT Analysis
- 11.2.7.4. Recent Developments
- 11.2.7.5. Financials (Based on Availability)
- 11.2.8 Esaote SPA
- 11.2.8.1. Overview
- 11.2.8.2. Products
- 11.2.8.3. SWOT Analysis
- 11.2.8.4. Recent Developments
- 11.2.8.5. Financials (Based on Availability)
- 11.2.9 Fujifilm Holdings
- 11.2.9.1. Overview
- 11.2.9.2. Products
- 11.2.9.3. SWOT Analysis
- 11.2.9.4. Recent Developments
- 11.2.9.5. Financials (Based on Availability)
- 11.2.10 IMV Imaging
- 11.2.10.1. Overview
- 11.2.10.2. Products
- 11.2.10.3. SWOT Analysis
- 11.2.10.4. Recent Developments
- 11.2.10.5. Financials (Based on Availability)
- 11.2.1 Carestream Health
List of Figures
- Figure 1: Global Animal Diagnostic Imaging Systems Revenue Breakdown (undefined, %) by Region 2025 & 2033
- Figure 2: North America Animal Diagnostic Imaging Systems Revenue (undefined), by Application 2025 & 2033
- Figure 3: North America Animal Diagnostic Imaging Systems Revenue Share (%), by Application 2025 & 2033
- Figure 4: North America Animal Diagnostic Imaging Systems Revenue (undefined), by Types 2025 & 2033
- Figure 5: North America Animal Diagnostic Imaging Systems Revenue Share (%), by Types 2025 & 2033
- Figure 6: North America Animal Diagnostic Imaging Systems Revenue (undefined), by Country 2025 & 2033
- Figure 7: North America Animal Diagnostic Imaging Systems Revenue Share (%), by Country 2025 & 2033
- Figure 8: South America Animal Diagnostic Imaging Systems Revenue (undefined), by Application 2025 & 2033
- Figure 9: South America Animal Diagnostic Imaging Systems Revenue Share (%), by Application 2025 & 2033
- Figure 10: South America Animal Diagnostic Imaging Systems Revenue (undefined), by Types 2025 & 2033
- Figure 11: South America Animal Diagnostic Imaging Systems Revenue Share (%), by Types 2025 & 2033
- Figure 12: South America Animal Diagnostic Imaging Systems Revenue (undefined), by Country 2025 & 2033
- Figure 13: South America Animal Diagnostic Imaging Systems Revenue Share (%), by Country 2025 & 2033
- Figure 14: Europe Animal Diagnostic Imaging Systems Revenue (undefined), by Application 2025 & 2033
- Figure 15: Europe Animal Diagnostic Imaging Systems Revenue Share (%), by Application 2025 & 2033
- Figure 16: Europe Animal Diagnostic Imaging Systems Revenue (undefined), by Types 2025 & 2033
- Figure 17: Europe Animal Diagnostic Imaging Systems Revenue Share (%), by Types 2025 & 2033
- Figure 18: Europe Animal Diagnostic Imaging Systems Revenue (undefined), by Country 2025 & 2033
- Figure 19: Europe Animal Diagnostic Imaging Systems Revenue Share (%), by Country 2025 & 2033
- Figure 20: Middle East & Africa Animal Diagnostic Imaging Systems Revenue (undefined), by Application 2025 & 2033
- Figure 21: Middle East & Africa Animal Diagnostic Imaging Systems Revenue Share (%), by Application 2025 & 2033
- Figure 22: Middle East & Africa Animal Diagnostic Imaging Systems Revenue (undefined), by Types 2025 & 2033
- Figure 23: Middle East & Africa Animal Diagnostic Imaging Systems Revenue Share (%), by Types 2025 & 2033
- Figure 24: Middle East & Africa Animal Diagnostic Imaging Systems Revenue (undefined), by Country 2025 & 2033
- Figure 25: Middle East & Africa Animal Diagnostic Imaging Systems Revenue Share (%), by Country 2025 & 2033
- Figure 26: Asia Pacific Animal Diagnostic Imaging Systems Revenue (undefined), by Application 2025 & 2033
- Figure 27: Asia Pacific Animal Diagnostic Imaging Systems Revenue Share (%), by Application 2025 & 2033
- Figure 28: Asia Pacific Animal Diagnostic Imaging Systems Revenue (undefined), by Types 2025 & 2033
- Figure 29: Asia Pacific Animal Diagnostic Imaging Systems Revenue Share (%), by Types 2025 & 2033
- Figure 30: Asia Pacific Animal Diagnostic Imaging Systems Revenue (undefined), by Country 2025 & 2033
- Figure 31: Asia Pacific Animal Diagnostic Imaging Systems Revenue Share (%), by Country 2025 & 2033
List of Tables
- Table 1: Global Animal Diagnostic Imaging Systems Revenue undefined Forecast, by Application 2020 & 2033
- Table 2: Global Animal Diagnostic Imaging Systems Revenue undefined Forecast, by Types 2020 & 2033
- Table 3: Global Animal Diagnostic Imaging Systems Revenue undefined Forecast, by Region 2020 & 2033
- Table 4: Global Animal Diagnostic Imaging Systems Revenue undefined Forecast, by Application 2020 & 2033
- Table 5: Global Animal Diagnostic Imaging Systems Revenue undefined Forecast, by Types 2020 & 2033
- Table 6: Global Animal Diagnostic Imaging Systems Revenue undefined Forecast, by Country 2020 & 2033
- Table 7: United States Animal Diagnostic Imaging Systems Revenue (undefined) Forecast, by Application 2020 & 2033
- Table 8: Canada Animal Diagnostic Imaging Systems Revenue (undefined) Forecast, by Application 2020 & 2033
- Table 9: Mexico Animal Diagnostic Imaging Systems Revenue (undefined) Forecast, by Application 2020 & 2033
- Table 10: Global Animal Diagnostic Imaging Systems Revenue undefined Forecast, by Application 2020 & 2033
- Table 11: Global Animal Diagnostic Imaging Systems Revenue undefined Forecast, by Types 2020 & 2033
- Table 12: Global Animal Diagnostic Imaging Systems Revenue undefined Forecast, by Country 2020 & 2033
- Table 13: Brazil Animal Diagnostic Imaging Systems Revenue (undefined) Forecast, by Application 2020 & 2033
- Table 14: Argentina Animal Diagnostic Imaging Systems Revenue (undefined) Forecast, by Application 2020 & 2033
- Table 15: Rest of South America Animal Diagnostic Imaging Systems Revenue (undefined) Forecast, by Application 2020 & 2033
- Table 16: Global Animal Diagnostic Imaging Systems Revenue undefined Forecast, by Application 2020 & 2033
- Table 17: Global Animal Diagnostic Imaging Systems Revenue undefined Forecast, by Types 2020 & 2033
- Table 18: Global Animal Diagnostic Imaging Systems Revenue undefined Forecast, by Country 2020 & 2033
- Table 19: United Kingdom Animal Diagnostic Imaging Systems Revenue (undefined) Forecast, by Application 2020 & 2033
- Table 20: Germany Animal Diagnostic Imaging Systems Revenue (undefined) Forecast, by Application 2020 & 2033
- Table 21: France Animal Diagnostic Imaging Systems Revenue (undefined) Forecast, by Application 2020 & 2033
- Table 22: Italy Animal Diagnostic Imaging Systems Revenue (undefined) Forecast, by Application 2020 & 2033
- Table 23: Spain Animal Diagnostic Imaging Systems Revenue (undefined) Forecast, by Application 2020 & 2033
- Table 24: Russia Animal Diagnostic Imaging Systems Revenue (undefined) Forecast, by Application 2020 & 2033
- Table 25: Benelux Animal Diagnostic Imaging Systems Revenue (undefined) Forecast, by Application 2020 & 2033
- Table 26: Nordics Animal Diagnostic Imaging Systems Revenue (undefined) Forecast, by Application 2020 & 2033
- Table 27: Rest of Europe Animal Diagnostic Imaging Systems Revenue (undefined) Forecast, by Application 2020 & 2033
- Table 28: Global Animal Diagnostic Imaging Systems Revenue undefined Forecast, by Application 2020 & 2033
- Table 29: Global Animal Diagnostic Imaging Systems Revenue undefined Forecast, by Types 2020 & 2033
- Table 30: Global Animal Diagnostic Imaging Systems Revenue undefined Forecast, by Country 2020 & 2033
- Table 31: Turkey Animal Diagnostic Imaging Systems Revenue (undefined) Forecast, by Application 2020 & 2033
- Table 32: Israel Animal Diagnostic Imaging Systems Revenue (undefined) Forecast, by Application 2020 & 2033
- Table 33: GCC Animal Diagnostic Imaging Systems Revenue (undefined) Forecast, by Application 2020 & 2033
- Table 34: North Africa Animal Diagnostic Imaging Systems Revenue (undefined) Forecast, by Application 2020 & 2033
- Table 35: South Africa Animal Diagnostic Imaging Systems Revenue (undefined) Forecast, by Application 2020 & 2033
- Table 36: Rest of Middle East & Africa Animal Diagnostic Imaging Systems Revenue (undefined) Forecast, by Application 2020 & 2033
- Table 37: Global Animal Diagnostic Imaging Systems Revenue undefined Forecast, by Application 2020 & 2033
- Table 38: Global Animal Diagnostic Imaging Systems Revenue undefined Forecast, by Types 2020 & 2033
- Table 39: Global Animal Diagnostic Imaging Systems Revenue undefined Forecast, by Country 2020 & 2033
- Table 40: China Animal Diagnostic Imaging Systems Revenue (undefined) Forecast, by Application 2020 & 2033
- Table 41: India Animal Diagnostic Imaging Systems Revenue (undefined) Forecast, by Application 2020 & 2033
- Table 42: Japan Animal Diagnostic Imaging Systems Revenue (undefined) Forecast, by Application 2020 & 2033
- Table 43: South Korea Animal Diagnostic Imaging Systems Revenue (undefined) Forecast, by Application 2020 & 2033
- Table 44: ASEAN Animal Diagnostic Imaging Systems Revenue (undefined) Forecast, by Application 2020 & 2033
- Table 45: Oceania Animal Diagnostic Imaging Systems Revenue (undefined) Forecast, by Application 2020 & 2033
- Table 46: Rest of Asia Pacific Animal Diagnostic Imaging Systems Revenue (undefined) Forecast, by Application 2020 & 2033
Frequently Asked Questions
1. What is the projected Compound Annual Growth Rate (CAGR) of the Animal Diagnostic Imaging Systems?
The projected CAGR is approximately 7.84%.
2. Which companies are prominent players in the Animal Diagnostic Imaging Systems?
Key companies in the market include Carestream Health, Epica Animal Health, Hallmarq Veterinary Imaging, IDEXX Laboratories Inc., MyVet Imaging Inc., ARI Veterinary Care, Canon Medical Systems Corporation, Esaote SPA, Fujifilm Holdings, IMV Imaging.
3. What are the main segments of the Animal Diagnostic Imaging Systems?
The market segments include Application, Types.
4. Can you provide details about the market size?
The market size is estimated to be USD XXX N/A as of 2022.
5. What are some drivers contributing to market growth?
N/A
6. What are the notable trends driving market growth?
N/A
7. Are there any restraints impacting market growth?
N/A
8. Can you provide examples of recent developments in the market?
N/A
9. What pricing options are available for accessing the report?
Pricing options include single-user, multi-user, and enterprise licenses priced at USD 2900.00, USD 4350.00, and USD 5800.00 respectively.
10. Is the market size provided in terms of value or volume?
The market size is provided in terms of value, measured in N/A.
11. Are there any specific market keywords associated with the report?
Yes, the market keyword associated with the report is "Animal Diagnostic Imaging Systems," which aids in identifying and referencing the specific market segment covered.
12. How do I determine which pricing option suits my needs best?
The pricing options vary based on user requirements and access needs. Individual users may opt for single-user licenses, while businesses requiring broader access may choose multi-user or enterprise licenses for cost-effective access to the report.
13. Are there any additional resources or data provided in the Animal Diagnostic Imaging Systems report?
While the report offers comprehensive insights, it's advisable to review the specific contents or supplementary materials provided to ascertain if additional resources or data are available.
14. How can I stay updated on further developments or reports in the Animal Diagnostic Imaging Systems?
To stay informed about further developments, trends, and reports in the Animal Diagnostic Imaging Systems, consider subscribing to industry newsletters, following relevant companies and organizations, or regularly checking reputable industry news sources and publications.
Methodology
Step 1 - Identification of Relevant Samples Size from Population Database


Step 2 - Approaches for Defining Global Market Size (Value, Volume* & Price*)

Note*: In applicable scenarios
Step 3 - Data Sources
Primary Research
- Web Analytics
- Survey Reports
- Research Institute
- Latest Research Reports
- Opinion Leaders
Secondary Research
- Annual Reports
- White Paper
- Latest Press Release
- Industry Association
- Paid Database
- Investor Presentations

Step 4 - Data Triangulation
Involves using different sources of information in order to increase the validity of a study
These sources are likely to be stakeholders in a program - participants, other researchers, program staff, other community members, and so on.
Then we put all data in single framework & apply various statistical tools to find out the dynamic on the market.
During the analysis stage, feedback from the stakeholder groups would be compared to determine areas of agreement as well as areas of divergence