
Key Insights
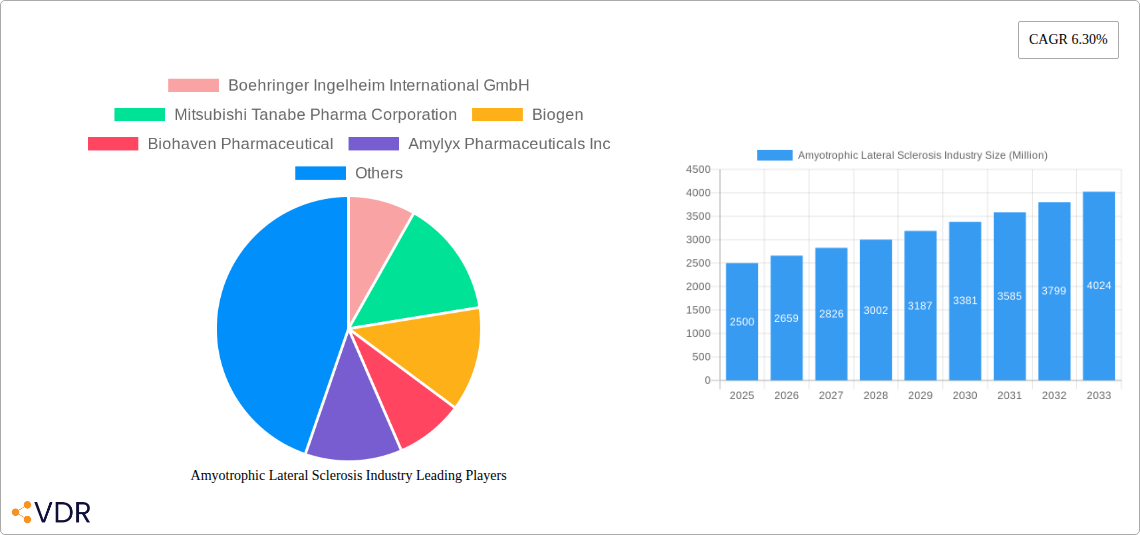
The Amyotrophic Lateral Sclerosis (ALS) market, valued at approximately $2.5 billion in 2025, is projected to experience robust growth, driven by a rising prevalence of ALS globally and increasing research and development efforts focused on novel therapeutic interventions. The market's 6.30% CAGR from 2019-2033 signifies substantial expansion opportunities. Key market drivers include the growing geriatric population (increasing susceptibility to ALS), rising awareness about the disease, and significant investments by pharmaceutical companies in developing effective treatments, including gene therapies and disease-modifying drugs. However, challenges remain, primarily the limited treatment options currently available, along with high drug costs and lengthy clinical trial processes, which hinder faster market penetration of newer therapies. The market is segmented by distribution channel (hospital pharmacies holding a larger share due to specialized care needs) and treatment type (medication dominating due to the current treatment landscape).
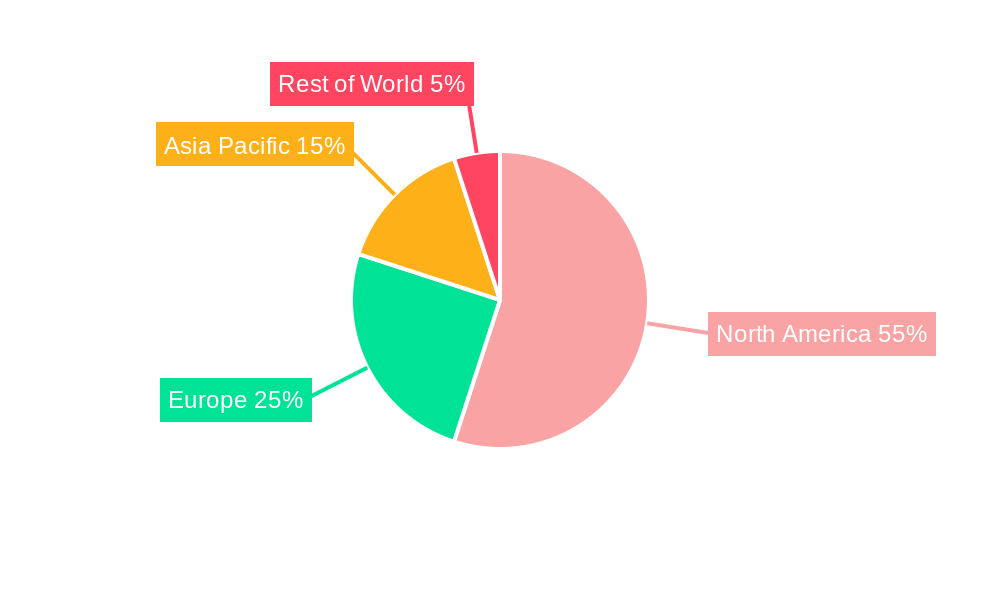
Geographic segmentation reveals North America holding the largest market share, attributable to advanced healthcare infrastructure, high healthcare expenditure, and significant clinical trial activity in the region. However, Asia Pacific and Europe are projected to witness rapid growth in the coming years fueled by increasing awareness and expanding healthcare accessibility. The competitive landscape comprises both established pharmaceutical giants like Boehringer Ingelheim and Biogen, alongside emerging biotech companies like Amylyx Pharmaceuticals and CRISPR Therapeutics, actively contributing to the pipeline of novel therapies. The future of the ALS market hinges on successful clinical trials and regulatory approvals of these promising new treatments, potentially leading to a paradigm shift in disease management and improved patient outcomes. Further market expansion will likely be spurred by the development of biomarkers for early diagnosis and personalized medicine approaches.
Amyotrophic Lateral Sclerosis (ALS) Industry Market Report: 2019-2033
This comprehensive report provides an in-depth analysis of the Amyotrophic Lateral Sclerosis (ALS) industry, encompassing market dynamics, growth trends, regional analysis, product landscape, and key player strategies. The report covers the period from 2019 to 2033, with a focus on the forecast period from 2025 to 2033. The base year for this analysis is 2025. This report is essential for industry professionals, investors, and researchers seeking a detailed understanding of this critical therapeutic area.
Amyotrophic Lateral Sclerosis Industry Market Dynamics & Structure
The ALS market is characterized by a moderately concentrated landscape with several key players vying for market share. Technological innovation, primarily focused on novel drug development and advanced therapies, is a crucial driver. Stringent regulatory frameworks, including rigorous clinical trial requirements, present significant barriers to entry. Competitive product substitutes are limited, making successful drug launches highly impactful. The end-user demographic primarily consists of patients diagnosed with ALS, their families, and healthcare providers. The historical period (2019-2024) witnessed a moderate level of M&A activity, with an estimated xx million USD in deal volume. This trend is expected to continue, driven by the need for companies to expand their portfolios and gain a competitive edge.
- Market Concentration: Moderately concentrated, with top 5 players holding approximately xx% market share (2024).
- Technological Innovation: Focus on gene therapy, RNA interference, and novel drug mechanisms.
- Regulatory Framework: Stringent FDA and EMA approvals impacting time to market and R&D costs.
- Competitive Substitutes: Limited effective alternatives to existing treatments.
- End-User Demographics: Patients diagnosed with ALS and their caregivers, neurologists, and specialized healthcare facilities.
- M&A Trends: xx million USD in deal volume (2019-2024), driven by portfolio diversification and pipeline expansion.
Amyotrophic Lateral Sclerosis Industry Growth Trends & Insights
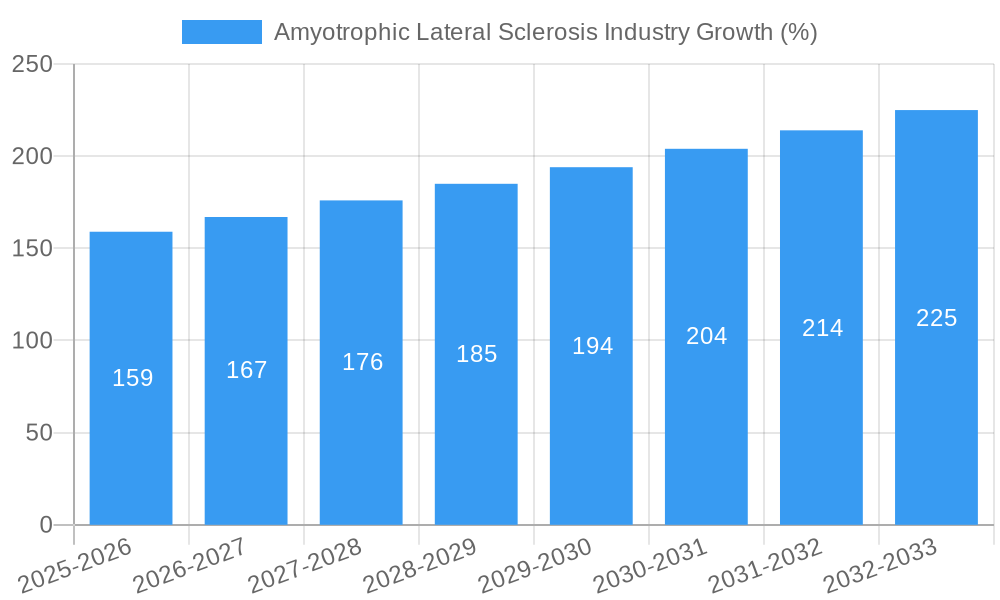
The ALS market exhibits substantial growth potential, driven by increasing prevalence of the disease, rising awareness, and ongoing advancements in treatment options. The historical period showed a Compound Annual Growth Rate (CAGR) of xx% (2019-2024). This positive trend is anticipated to continue, resulting in a projected CAGR of xx% during the forecast period (2025-2033), reaching a market size of xx million USD by 2033. Technological advancements, such as the development of novel drugs targeting specific disease mechanisms, contribute significantly to this growth. Changes in consumer behavior, including increased patient advocacy and demand for improved treatment options, also play a vital role. Market penetration of currently available therapies remains relatively low, indicating substantial untapped potential for new treatments.
Dominant Regions, Countries, or Segments in Amyotrophic Lateral Sclerosis Industry
North America currently dominates the ALS market, holding approximately xx% of the global market share in 2024 due to high healthcare expenditure, robust research infrastructure, and a relatively high prevalence rate. Within the distribution channel, Hospital Pharmacies holds the largest share (xx%), reflecting the specialized nature of ALS care. Similarly, Medication accounts for the largest segment in Treatment Type (xx%), dominated by currently available therapies. European countries are expected to show significant growth, driven by increasing healthcare budgets and rising awareness.
- North America: High prevalence, advanced healthcare infrastructure, and strong R&D activities.
- Europe: Growing awareness, increasing healthcare spending, and expanding access to advanced therapies.
- Asia-Pacific: Emerging market with rising prevalence rates and increasing investments in healthcare infrastructure.
- By Distribution Channel: Hospital Pharmacies (xx%), Retail Pharmacies (xx%), Others (xx%).
- By Treatment Type: Medication (xx%), Others (xx%).
Amyotrophic Lateral Sclerosis Industry Product Landscape
The ALS treatment landscape includes existing medications like riluzole and edaravone, alongside emerging therapies such as AMX0035 and other novel drug candidates targeting various disease mechanisms. These treatments primarily aim to slow disease progression and improve quality of life for patients. Ongoing research focuses on developing disease-modifying therapies, potentially offering more significant clinical benefits. The unique selling propositions of new therapies often lie in their mechanisms of action, tolerability profiles, and potential for improved clinical outcomes compared to existing standards of care.
Key Drivers, Barriers & Challenges in Amyotrophic Lateral Sclerosis Industry
Key Drivers: Increased ALS prevalence, growing awareness and patient advocacy, and continuous advancement in treatment development leading to novel drug discoveries and therapies. Government funding initiatives aimed at accelerating research and development, further fuels this progress.
Challenges: The high cost of research and development, complex regulatory approval processes, and limited treatment options resulting in a considerable unmet medical need. Supply chain issues related to the availability of raw materials and the need to streamline the manufacturing process.
Emerging Opportunities in Amyotrophic Lateral Sclerosis Industry
The development of personalized medicine approaches, tailoring treatments based on individual patient genetics, presents significant opportunities. Further research in early diagnosis and disease prevention opens new avenues for market expansion. The exploration of combination therapies leveraging synergistic effects between different treatment modalities holds potential for enhanced efficacy.
Growth Accelerators in the Amyotrophic Lateral Sclerosis Industry Industry
Strategic collaborations between pharmaceutical companies and research institutions can accelerate development. Innovative clinical trial designs focused on efficiency and cost-effectiveness can aid progress. Expansion into underserved markets globally, ensuring wider access to available treatments, creates further growth potential. Technological advancements such as gene therapy and advanced diagnostics open exciting avenues.
Key Players Shaping the Amyotrophic Lateral Sclerosis Industry Market
- Boehringer Ingelheim International GmbH
- Mitsubishi Tanabe Pharma Corporation
- Biogen
- Biohaven Pharmaceutical
- Amylyx Pharmaceuticals Inc
- BrainStorm Cell Limited
- Ionis Pharmaceuticals
- CORESTEM Inc
- ANNEXON INC
- AbbVie Inc
- CRISPR Therapeutics
- Sun Pharmaceutical Industries Ltd
- AB Science
- Otsuka Pharmaceutical Co Ltd
Notable Milestones in Amyotrophic Lateral Sclerosis Industry Sector
- June 2022: Canada approves Amylyx Pharmaceuticals Inc.'s ALBRIOZA (AMX0035) for ALS.
- May 2022: Mitsubishi Tanabe Pharma America receives FDA approval for RADICAVA ORS (edaravone) for ALS.
In-Depth Amyotrophic Lateral Sclerosis Industry Market Outlook
The ALS market shows robust growth potential driven by continuous innovation in treatment modalities and a greater understanding of disease mechanisms. Strategic partnerships and expanded market access will further accelerate growth. The development of disease-modifying therapies remains a key focus, promising transformative improvements in patient outcomes and market expansion. The future holds significant opportunities for companies that can effectively navigate the regulatory landscape and deliver innovative treatments to address the unmet needs of ALS patients.
Amyotrophic Lateral Sclerosis Industry Segmentation
-
1. Treatment Type
- 1.1. Medication
- 1.2. Others
-
2. Distribution Channel
- 2.1. Hospital Pharmacies
- 2.2. Retail Pharmacies
- 2.3. Others
Amyotrophic Lateral Sclerosis Industry Segmentation By Geography
-
1. North America
- 1.1. United States
- 1.2. Canada
- 1.3. Mexico
-
2. Europe
- 2.1. Germany
- 2.2. United Kingdom
- 2.3. France
- 2.4. Italy
- 2.5. Spain
- 2.6. Rest of Europe
-
3. Asia Pacific
- 3.1. China
- 3.2. Japan
- 3.3. India
- 3.4. Australia
- 3.5. South Korea
- 3.6. Rest of Asia Pacific
-
4. Middle East and Africa
- 4.1. GCC
- 4.2. South Africa
- 4.3. Rest of Middle East and Africa
-
5. South America
- 5.1. Brazil
- 5.2. Argentina
- 5.3. Rest of South America
Amyotrophic Lateral Sclerosis Industry REPORT HIGHLIGHTS
| Aspects | Details |
|---|---|
| Study Period | 2019-2033 |
| Base Year | 2024 |
| Estimated Year | 2025 |
| Forecast Period | 2025-2033 |
| Historical Period | 2019-2024 |
| Growth Rate | CAGR of 6.30% from 2019-2033 |
| Segmentation |
|
Table of Contents
- 1. Introduction
- 1.1. Research Scope
- 1.2. Market Segmentation
- 1.3. Research Methodology
- 1.4. Definitions and Assumptions
- 2. Executive Summary
- 2.1. Introduction
- 3. Market Dynamics
- 3.1. Introduction
- 3.2. Market Drivers
- 3.2.1. Rising Prevalence of Amyotrophic Lateral Sclerosis; Growing Geriatric Population
- 3.3. Market Restrains
- 3.3.1. High Cost of Treatment
- 3.4. Market Trends
- 3.4.1. Medications Are Expected To Witness Healthy Growth Over the Forecast Period
- 4. Market Factor Analysis
- 4.1. Porters Five Forces
- 4.2. Supply/Value Chain
- 4.3. PESTEL analysis
- 4.4. Market Entropy
- 4.5. Patent/Trademark Analysis
- 5. Global Amyotrophic Lateral Sclerosis Industry Analysis, Insights and Forecast, 2019-2031
- 5.1. Market Analysis, Insights and Forecast - by Treatment Type
- 5.1.1. Medication
- 5.1.2. Others
- 5.2. Market Analysis, Insights and Forecast - by Distribution Channel
- 5.2.1. Hospital Pharmacies
- 5.2.2. Retail Pharmacies
- 5.2.3. Others
- 5.3. Market Analysis, Insights and Forecast - by Region
- 5.3.1. North America
- 5.3.2. Europe
- 5.3.3. Asia Pacific
- 5.3.4. Middle East and Africa
- 5.3.5. South America
- 5.1. Market Analysis, Insights and Forecast - by Treatment Type
- 6. North America Amyotrophic Lateral Sclerosis Industry Analysis, Insights and Forecast, 2019-2031
- 6.1. Market Analysis, Insights and Forecast - by Treatment Type
- 6.1.1. Medication
- 6.1.2. Others
- 6.2. Market Analysis, Insights and Forecast - by Distribution Channel
- 6.2.1. Hospital Pharmacies
- 6.2.2. Retail Pharmacies
- 6.2.3. Others
- 6.1. Market Analysis, Insights and Forecast - by Treatment Type
- 7. Europe Amyotrophic Lateral Sclerosis Industry Analysis, Insights and Forecast, 2019-2031
- 7.1. Market Analysis, Insights and Forecast - by Treatment Type
- 7.1.1. Medication
- 7.1.2. Others
- 7.2. Market Analysis, Insights and Forecast - by Distribution Channel
- 7.2.1. Hospital Pharmacies
- 7.2.2. Retail Pharmacies
- 7.2.3. Others
- 7.1. Market Analysis, Insights and Forecast - by Treatment Type
- 8. Asia Pacific Amyotrophic Lateral Sclerosis Industry Analysis, Insights and Forecast, 2019-2031
- 8.1. Market Analysis, Insights and Forecast - by Treatment Type
- 8.1.1. Medication
- 8.1.2. Others
- 8.2. Market Analysis, Insights and Forecast - by Distribution Channel
- 8.2.1. Hospital Pharmacies
- 8.2.2. Retail Pharmacies
- 8.2.3. Others
- 8.1. Market Analysis, Insights and Forecast - by Treatment Type
- 9. Middle East and Africa Amyotrophic Lateral Sclerosis Industry Analysis, Insights and Forecast, 2019-2031
- 9.1. Market Analysis, Insights and Forecast - by Treatment Type
- 9.1.1. Medication
- 9.1.2. Others
- 9.2. Market Analysis, Insights and Forecast - by Distribution Channel
- 9.2.1. Hospital Pharmacies
- 9.2.2. Retail Pharmacies
- 9.2.3. Others
- 9.1. Market Analysis, Insights and Forecast - by Treatment Type
- 10. South America Amyotrophic Lateral Sclerosis Industry Analysis, Insights and Forecast, 2019-2031
- 10.1. Market Analysis, Insights and Forecast - by Treatment Type
- 10.1.1. Medication
- 10.1.2. Others
- 10.2. Market Analysis, Insights and Forecast - by Distribution Channel
- 10.2.1. Hospital Pharmacies
- 10.2.2. Retail Pharmacies
- 10.2.3. Others
- 10.1. Market Analysis, Insights and Forecast - by Treatment Type
- 11. North America Amyotrophic Lateral Sclerosis Industry Analysis, Insights and Forecast, 2019-2031
- 11.1. Market Analysis, Insights and Forecast - By Country/Sub-region
- 11.1.1 United States
- 11.1.2 Canada
- 11.1.3 Mexico
- 12. Europe Amyotrophic Lateral Sclerosis Industry Analysis, Insights and Forecast, 2019-2031
- 12.1. Market Analysis, Insights and Forecast - By Country/Sub-region
- 12.1.1 Germany
- 12.1.2 United Kingdom
- 12.1.3 France
- 12.1.4 Italy
- 12.1.5 Spain
- 12.1.6 Rest of Europe
- 13. Asia Pacific Amyotrophic Lateral Sclerosis Industry Analysis, Insights and Forecast, 2019-2031
- 13.1. Market Analysis, Insights and Forecast - By Country/Sub-region
- 13.1.1 China
- 13.1.2 Japan
- 13.1.3 India
- 13.1.4 Australia
- 13.1.5 South Korea
- 13.1.6 Rest of Asia Pacific
- 14. Middle East and Africa Amyotrophic Lateral Sclerosis Industry Analysis, Insights and Forecast, 2019-2031
- 14.1. Market Analysis, Insights and Forecast - By Country/Sub-region
- 14.1.1 GCC
- 14.1.2 South Africa
- 14.1.3 Rest of Middle East and Africa
- 15. South America Amyotrophic Lateral Sclerosis Industry Analysis, Insights and Forecast, 2019-2031
- 15.1. Market Analysis, Insights and Forecast - By Country/Sub-region
- 15.1.1 Brazil
- 15.1.2 Argentina
- 15.1.3 Rest of South America
- 16. Competitive Analysis
- 16.1. Global Market Share Analysis 2024
- 16.2. Company Profiles
- 16.2.1 Boehringer Ingelheim International GmbH
- 16.2.1.1. Overview
- 16.2.1.2. Products
- 16.2.1.3. SWOT Analysis
- 16.2.1.4. Recent Developments
- 16.2.1.5. Financials (Based on Availability)
- 16.2.2 Mitsubishi Tanabe Pharma Corporation
- 16.2.2.1. Overview
- 16.2.2.2. Products
- 16.2.2.3. SWOT Analysis
- 16.2.2.4. Recent Developments
- 16.2.2.5. Financials (Based on Availability)
- 16.2.3 Biogen
- 16.2.3.1. Overview
- 16.2.3.2. Products
- 16.2.3.3. SWOT Analysis
- 16.2.3.4. Recent Developments
- 16.2.3.5. Financials (Based on Availability)
- 16.2.4 Biohaven Pharmaceutical
- 16.2.4.1. Overview
- 16.2.4.2. Products
- 16.2.4.3. SWOT Analysis
- 16.2.4.4. Recent Developments
- 16.2.4.5. Financials (Based on Availability)
- 16.2.5 Amylyx Pharmaceuticals Inc
- 16.2.5.1. Overview
- 16.2.5.2. Products
- 16.2.5.3. SWOT Analysis
- 16.2.5.4. Recent Developments
- 16.2.5.5. Financials (Based on Availability)
- 16.2.6 BrainStorm Cell Limited
- 16.2.6.1. Overview
- 16.2.6.2. Products
- 16.2.6.3. SWOT Analysis
- 16.2.6.4. Recent Developments
- 16.2.6.5. Financials (Based on Availability)
- 16.2.7 Ionis Pharmaceuticals
- 16.2.7.1. Overview
- 16.2.7.2. Products
- 16.2.7.3. SWOT Analysis
- 16.2.7.4. Recent Developments
- 16.2.7.5. Financials (Based on Availability)
- 16.2.8 CORESTEM Inc
- 16.2.8.1. Overview
- 16.2.8.2. Products
- 16.2.8.3. SWOT Analysis
- 16.2.8.4. Recent Developments
- 16.2.8.5. Financials (Based on Availability)
- 16.2.9 ANNEXON INC
- 16.2.9.1. Overview
- 16.2.9.2. Products
- 16.2.9.3. SWOT Analysis
- 16.2.9.4. Recent Developments
- 16.2.9.5. Financials (Based on Availability)
- 16.2.10 AbbVie Inc
- 16.2.10.1. Overview
- 16.2.10.2. Products
- 16.2.10.3. SWOT Analysis
- 16.2.10.4. Recent Developments
- 16.2.10.5. Financials (Based on Availability)
- 16.2.11 CRISPR Therapeutics
- 16.2.11.1. Overview
- 16.2.11.2. Products
- 16.2.11.3. SWOT Analysis
- 16.2.11.4. Recent Developments
- 16.2.11.5. Financials (Based on Availability)
- 16.2.12 Sun Pharmaceutical Industries Ltd
- 16.2.12.1. Overview
- 16.2.12.2. Products
- 16.2.12.3. SWOT Analysis
- 16.2.12.4. Recent Developments
- 16.2.12.5. Financials (Based on Availability)
- 16.2.13 AB Science
- 16.2.13.1. Overview
- 16.2.13.2. Products
- 16.2.13.3. SWOT Analysis
- 16.2.13.4. Recent Developments
- 16.2.13.5. Financials (Based on Availability)
- 16.2.14 Otsuka Pharmaceutical Co Ltd
- 16.2.14.1. Overview
- 16.2.14.2. Products
- 16.2.14.3. SWOT Analysis
- 16.2.14.4. Recent Developments
- 16.2.14.5. Financials (Based on Availability)
- 16.2.1 Boehringer Ingelheim International GmbH
List of Figures
- Figure 1: Global Amyotrophic Lateral Sclerosis Industry Revenue Breakdown (Million, %) by Region 2024 & 2032
- Figure 2: Global Amyotrophic Lateral Sclerosis Industry Volume Breakdown (K Unit, %) by Region 2024 & 2032
- Figure 3: North America Amyotrophic Lateral Sclerosis Industry Revenue (Million), by Country 2024 & 2032
- Figure 4: North America Amyotrophic Lateral Sclerosis Industry Volume (K Unit), by Country 2024 & 2032
- Figure 5: North America Amyotrophic Lateral Sclerosis Industry Revenue Share (%), by Country 2024 & 2032
- Figure 6: North America Amyotrophic Lateral Sclerosis Industry Volume Share (%), by Country 2024 & 2032
- Figure 7: Europe Amyotrophic Lateral Sclerosis Industry Revenue (Million), by Country 2024 & 2032
- Figure 8: Europe Amyotrophic Lateral Sclerosis Industry Volume (K Unit), by Country 2024 & 2032
- Figure 9: Europe Amyotrophic Lateral Sclerosis Industry Revenue Share (%), by Country 2024 & 2032
- Figure 10: Europe Amyotrophic Lateral Sclerosis Industry Volume Share (%), by Country 2024 & 2032
- Figure 11: Asia Pacific Amyotrophic Lateral Sclerosis Industry Revenue (Million), by Country 2024 & 2032
- Figure 12: Asia Pacific Amyotrophic Lateral Sclerosis Industry Volume (K Unit), by Country 2024 & 2032
- Figure 13: Asia Pacific Amyotrophic Lateral Sclerosis Industry Revenue Share (%), by Country 2024 & 2032
- Figure 14: Asia Pacific Amyotrophic Lateral Sclerosis Industry Volume Share (%), by Country 2024 & 2032
- Figure 15: Middle East and Africa Amyotrophic Lateral Sclerosis Industry Revenue (Million), by Country 2024 & 2032
- Figure 16: Middle East and Africa Amyotrophic Lateral Sclerosis Industry Volume (K Unit), by Country 2024 & 2032
- Figure 17: Middle East and Africa Amyotrophic Lateral Sclerosis Industry Revenue Share (%), by Country 2024 & 2032
- Figure 18: Middle East and Africa Amyotrophic Lateral Sclerosis Industry Volume Share (%), by Country 2024 & 2032
- Figure 19: South America Amyotrophic Lateral Sclerosis Industry Revenue (Million), by Country 2024 & 2032
- Figure 20: South America Amyotrophic Lateral Sclerosis Industry Volume (K Unit), by Country 2024 & 2032
- Figure 21: South America Amyotrophic Lateral Sclerosis Industry Revenue Share (%), by Country 2024 & 2032
- Figure 22: South America Amyotrophic Lateral Sclerosis Industry Volume Share (%), by Country 2024 & 2032
- Figure 23: North America Amyotrophic Lateral Sclerosis Industry Revenue (Million), by Treatment Type 2024 & 2032
- Figure 24: North America Amyotrophic Lateral Sclerosis Industry Volume (K Unit), by Treatment Type 2024 & 2032
- Figure 25: North America Amyotrophic Lateral Sclerosis Industry Revenue Share (%), by Treatment Type 2024 & 2032
- Figure 26: North America Amyotrophic Lateral Sclerosis Industry Volume Share (%), by Treatment Type 2024 & 2032
- Figure 27: North America Amyotrophic Lateral Sclerosis Industry Revenue (Million), by Distribution Channel 2024 & 2032
- Figure 28: North America Amyotrophic Lateral Sclerosis Industry Volume (K Unit), by Distribution Channel 2024 & 2032
- Figure 29: North America Amyotrophic Lateral Sclerosis Industry Revenue Share (%), by Distribution Channel 2024 & 2032
- Figure 30: North America Amyotrophic Lateral Sclerosis Industry Volume Share (%), by Distribution Channel 2024 & 2032
- Figure 31: North America Amyotrophic Lateral Sclerosis Industry Revenue (Million), by Country 2024 & 2032
- Figure 32: North America Amyotrophic Lateral Sclerosis Industry Volume (K Unit), by Country 2024 & 2032
- Figure 33: North America Amyotrophic Lateral Sclerosis Industry Revenue Share (%), by Country 2024 & 2032
- Figure 34: North America Amyotrophic Lateral Sclerosis Industry Volume Share (%), by Country 2024 & 2032
- Figure 35: Europe Amyotrophic Lateral Sclerosis Industry Revenue (Million), by Treatment Type 2024 & 2032
- Figure 36: Europe Amyotrophic Lateral Sclerosis Industry Volume (K Unit), by Treatment Type 2024 & 2032
- Figure 37: Europe Amyotrophic Lateral Sclerosis Industry Revenue Share (%), by Treatment Type 2024 & 2032
- Figure 38: Europe Amyotrophic Lateral Sclerosis Industry Volume Share (%), by Treatment Type 2024 & 2032
- Figure 39: Europe Amyotrophic Lateral Sclerosis Industry Revenue (Million), by Distribution Channel 2024 & 2032
- Figure 40: Europe Amyotrophic Lateral Sclerosis Industry Volume (K Unit), by Distribution Channel 2024 & 2032
- Figure 41: Europe Amyotrophic Lateral Sclerosis Industry Revenue Share (%), by Distribution Channel 2024 & 2032
- Figure 42: Europe Amyotrophic Lateral Sclerosis Industry Volume Share (%), by Distribution Channel 2024 & 2032
- Figure 43: Europe Amyotrophic Lateral Sclerosis Industry Revenue (Million), by Country 2024 & 2032
- Figure 44: Europe Amyotrophic Lateral Sclerosis Industry Volume (K Unit), by Country 2024 & 2032
- Figure 45: Europe Amyotrophic Lateral Sclerosis Industry Revenue Share (%), by Country 2024 & 2032
- Figure 46: Europe Amyotrophic Lateral Sclerosis Industry Volume Share (%), by Country 2024 & 2032
- Figure 47: Asia Pacific Amyotrophic Lateral Sclerosis Industry Revenue (Million), by Treatment Type 2024 & 2032
- Figure 48: Asia Pacific Amyotrophic Lateral Sclerosis Industry Volume (K Unit), by Treatment Type 2024 & 2032
- Figure 49: Asia Pacific Amyotrophic Lateral Sclerosis Industry Revenue Share (%), by Treatment Type 2024 & 2032
- Figure 50: Asia Pacific Amyotrophic Lateral Sclerosis Industry Volume Share (%), by Treatment Type 2024 & 2032
- Figure 51: Asia Pacific Amyotrophic Lateral Sclerosis Industry Revenue (Million), by Distribution Channel 2024 & 2032
- Figure 52: Asia Pacific Amyotrophic Lateral Sclerosis Industry Volume (K Unit), by Distribution Channel 2024 & 2032
- Figure 53: Asia Pacific Amyotrophic Lateral Sclerosis Industry Revenue Share (%), by Distribution Channel 2024 & 2032
- Figure 54: Asia Pacific Amyotrophic Lateral Sclerosis Industry Volume Share (%), by Distribution Channel 2024 & 2032
- Figure 55: Asia Pacific Amyotrophic Lateral Sclerosis Industry Revenue (Million), by Country 2024 & 2032
- Figure 56: Asia Pacific Amyotrophic Lateral Sclerosis Industry Volume (K Unit), by Country 2024 & 2032
- Figure 57: Asia Pacific Amyotrophic Lateral Sclerosis Industry Revenue Share (%), by Country 2024 & 2032
- Figure 58: Asia Pacific Amyotrophic Lateral Sclerosis Industry Volume Share (%), by Country 2024 & 2032
- Figure 59: Middle East and Africa Amyotrophic Lateral Sclerosis Industry Revenue (Million), by Treatment Type 2024 & 2032
- Figure 60: Middle East and Africa Amyotrophic Lateral Sclerosis Industry Volume (K Unit), by Treatment Type 2024 & 2032
- Figure 61: Middle East and Africa Amyotrophic Lateral Sclerosis Industry Revenue Share (%), by Treatment Type 2024 & 2032
- Figure 62: Middle East and Africa Amyotrophic Lateral Sclerosis Industry Volume Share (%), by Treatment Type 2024 & 2032
- Figure 63: Middle East and Africa Amyotrophic Lateral Sclerosis Industry Revenue (Million), by Distribution Channel 2024 & 2032
- Figure 64: Middle East and Africa Amyotrophic Lateral Sclerosis Industry Volume (K Unit), by Distribution Channel 2024 & 2032
- Figure 65: Middle East and Africa Amyotrophic Lateral Sclerosis Industry Revenue Share (%), by Distribution Channel 2024 & 2032
- Figure 66: Middle East and Africa Amyotrophic Lateral Sclerosis Industry Volume Share (%), by Distribution Channel 2024 & 2032
- Figure 67: Middle East and Africa Amyotrophic Lateral Sclerosis Industry Revenue (Million), by Country 2024 & 2032
- Figure 68: Middle East and Africa Amyotrophic Lateral Sclerosis Industry Volume (K Unit), by Country 2024 & 2032
- Figure 69: Middle East and Africa Amyotrophic Lateral Sclerosis Industry Revenue Share (%), by Country 2024 & 2032
- Figure 70: Middle East and Africa Amyotrophic Lateral Sclerosis Industry Volume Share (%), by Country 2024 & 2032
- Figure 71: South America Amyotrophic Lateral Sclerosis Industry Revenue (Million), by Treatment Type 2024 & 2032
- Figure 72: South America Amyotrophic Lateral Sclerosis Industry Volume (K Unit), by Treatment Type 2024 & 2032
- Figure 73: South America Amyotrophic Lateral Sclerosis Industry Revenue Share (%), by Treatment Type 2024 & 2032
- Figure 74: South America Amyotrophic Lateral Sclerosis Industry Volume Share (%), by Treatment Type 2024 & 2032
- Figure 75: South America Amyotrophic Lateral Sclerosis Industry Revenue (Million), by Distribution Channel 2024 & 2032
- Figure 76: South America Amyotrophic Lateral Sclerosis Industry Volume (K Unit), by Distribution Channel 2024 & 2032
- Figure 77: South America Amyotrophic Lateral Sclerosis Industry Revenue Share (%), by Distribution Channel 2024 & 2032
- Figure 78: South America Amyotrophic Lateral Sclerosis Industry Volume Share (%), by Distribution Channel 2024 & 2032
- Figure 79: South America Amyotrophic Lateral Sclerosis Industry Revenue (Million), by Country 2024 & 2032
- Figure 80: South America Amyotrophic Lateral Sclerosis Industry Volume (K Unit), by Country 2024 & 2032
- Figure 81: South America Amyotrophic Lateral Sclerosis Industry Revenue Share (%), by Country 2024 & 2032
- Figure 82: South America Amyotrophic Lateral Sclerosis Industry Volume Share (%), by Country 2024 & 2032
List of Tables
- Table 1: Global Amyotrophic Lateral Sclerosis Industry Revenue Million Forecast, by Region 2019 & 2032
- Table 2: Global Amyotrophic Lateral Sclerosis Industry Volume K Unit Forecast, by Region 2019 & 2032
- Table 3: Global Amyotrophic Lateral Sclerosis Industry Revenue Million Forecast, by Treatment Type 2019 & 2032
- Table 4: Global Amyotrophic Lateral Sclerosis Industry Volume K Unit Forecast, by Treatment Type 2019 & 2032
- Table 5: Global Amyotrophic Lateral Sclerosis Industry Revenue Million Forecast, by Distribution Channel 2019 & 2032
- Table 6: Global Amyotrophic Lateral Sclerosis Industry Volume K Unit Forecast, by Distribution Channel 2019 & 2032
- Table 7: Global Amyotrophic Lateral Sclerosis Industry Revenue Million Forecast, by Region 2019 & 2032
- Table 8: Global Amyotrophic Lateral Sclerosis Industry Volume K Unit Forecast, by Region 2019 & 2032
- Table 9: Global Amyotrophic Lateral Sclerosis Industry Revenue Million Forecast, by Country 2019 & 2032
- Table 10: Global Amyotrophic Lateral Sclerosis Industry Volume K Unit Forecast, by Country 2019 & 2032
- Table 11: United States Amyotrophic Lateral Sclerosis Industry Revenue (Million) Forecast, by Application 2019 & 2032
- Table 12: United States Amyotrophic Lateral Sclerosis Industry Volume (K Unit) Forecast, by Application 2019 & 2032
- Table 13: Canada Amyotrophic Lateral Sclerosis Industry Revenue (Million) Forecast, by Application 2019 & 2032
- Table 14: Canada Amyotrophic Lateral Sclerosis Industry Volume (K Unit) Forecast, by Application 2019 & 2032
- Table 15: Mexico Amyotrophic Lateral Sclerosis Industry Revenue (Million) Forecast, by Application 2019 & 2032
- Table 16: Mexico Amyotrophic Lateral Sclerosis Industry Volume (K Unit) Forecast, by Application 2019 & 2032
- Table 17: Global Amyotrophic Lateral Sclerosis Industry Revenue Million Forecast, by Country 2019 & 2032
- Table 18: Global Amyotrophic Lateral Sclerosis Industry Volume K Unit Forecast, by Country 2019 & 2032
- Table 19: Germany Amyotrophic Lateral Sclerosis Industry Revenue (Million) Forecast, by Application 2019 & 2032
- Table 20: Germany Amyotrophic Lateral Sclerosis Industry Volume (K Unit) Forecast, by Application 2019 & 2032
- Table 21: United Kingdom Amyotrophic Lateral Sclerosis Industry Revenue (Million) Forecast, by Application 2019 & 2032
- Table 22: United Kingdom Amyotrophic Lateral Sclerosis Industry Volume (K Unit) Forecast, by Application 2019 & 2032
- Table 23: France Amyotrophic Lateral Sclerosis Industry Revenue (Million) Forecast, by Application 2019 & 2032
- Table 24: France Amyotrophic Lateral Sclerosis Industry Volume (K Unit) Forecast, by Application 2019 & 2032
- Table 25: Italy Amyotrophic Lateral Sclerosis Industry Revenue (Million) Forecast, by Application 2019 & 2032
- Table 26: Italy Amyotrophic Lateral Sclerosis Industry Volume (K Unit) Forecast, by Application 2019 & 2032
- Table 27: Spain Amyotrophic Lateral Sclerosis Industry Revenue (Million) Forecast, by Application 2019 & 2032
- Table 28: Spain Amyotrophic Lateral Sclerosis Industry Volume (K Unit) Forecast, by Application 2019 & 2032
- Table 29: Rest of Europe Amyotrophic Lateral Sclerosis Industry Revenue (Million) Forecast, by Application 2019 & 2032
- Table 30: Rest of Europe Amyotrophic Lateral Sclerosis Industry Volume (K Unit) Forecast, by Application 2019 & 2032
- Table 31: Global Amyotrophic Lateral Sclerosis Industry Revenue Million Forecast, by Country 2019 & 2032
- Table 32: Global Amyotrophic Lateral Sclerosis Industry Volume K Unit Forecast, by Country 2019 & 2032
- Table 33: China Amyotrophic Lateral Sclerosis Industry Revenue (Million) Forecast, by Application 2019 & 2032
- Table 34: China Amyotrophic Lateral Sclerosis Industry Volume (K Unit) Forecast, by Application 2019 & 2032
- Table 35: Japan Amyotrophic Lateral Sclerosis Industry Revenue (Million) Forecast, by Application 2019 & 2032
- Table 36: Japan Amyotrophic Lateral Sclerosis Industry Volume (K Unit) Forecast, by Application 2019 & 2032
- Table 37: India Amyotrophic Lateral Sclerosis Industry Revenue (Million) Forecast, by Application 2019 & 2032
- Table 38: India Amyotrophic Lateral Sclerosis Industry Volume (K Unit) Forecast, by Application 2019 & 2032
- Table 39: Australia Amyotrophic Lateral Sclerosis Industry Revenue (Million) Forecast, by Application 2019 & 2032
- Table 40: Australia Amyotrophic Lateral Sclerosis Industry Volume (K Unit) Forecast, by Application 2019 & 2032
- Table 41: South Korea Amyotrophic Lateral Sclerosis Industry Revenue (Million) Forecast, by Application 2019 & 2032
- Table 42: South Korea Amyotrophic Lateral Sclerosis Industry Volume (K Unit) Forecast, by Application 2019 & 2032
- Table 43: Rest of Asia Pacific Amyotrophic Lateral Sclerosis Industry Revenue (Million) Forecast, by Application 2019 & 2032
- Table 44: Rest of Asia Pacific Amyotrophic Lateral Sclerosis Industry Volume (K Unit) Forecast, by Application 2019 & 2032
- Table 45: Global Amyotrophic Lateral Sclerosis Industry Revenue Million Forecast, by Country 2019 & 2032
- Table 46: Global Amyotrophic Lateral Sclerosis Industry Volume K Unit Forecast, by Country 2019 & 2032
- Table 47: GCC Amyotrophic Lateral Sclerosis Industry Revenue (Million) Forecast, by Application 2019 & 2032
- Table 48: GCC Amyotrophic Lateral Sclerosis Industry Volume (K Unit) Forecast, by Application 2019 & 2032
- Table 49: South Africa Amyotrophic Lateral Sclerosis Industry Revenue (Million) Forecast, by Application 2019 & 2032
- Table 50: South Africa Amyotrophic Lateral Sclerosis Industry Volume (K Unit) Forecast, by Application 2019 & 2032
- Table 51: Rest of Middle East and Africa Amyotrophic Lateral Sclerosis Industry Revenue (Million) Forecast, by Application 2019 & 2032
- Table 52: Rest of Middle East and Africa Amyotrophic Lateral Sclerosis Industry Volume (K Unit) Forecast, by Application 2019 & 2032
- Table 53: Global Amyotrophic Lateral Sclerosis Industry Revenue Million Forecast, by Country 2019 & 2032
- Table 54: Global Amyotrophic Lateral Sclerosis Industry Volume K Unit Forecast, by Country 2019 & 2032
- Table 55: Brazil Amyotrophic Lateral Sclerosis Industry Revenue (Million) Forecast, by Application 2019 & 2032
- Table 56: Brazil Amyotrophic Lateral Sclerosis Industry Volume (K Unit) Forecast, by Application 2019 & 2032
- Table 57: Argentina Amyotrophic Lateral Sclerosis Industry Revenue (Million) Forecast, by Application 2019 & 2032
- Table 58: Argentina Amyotrophic Lateral Sclerosis Industry Volume (K Unit) Forecast, by Application 2019 & 2032
- Table 59: Rest of South America Amyotrophic Lateral Sclerosis Industry Revenue (Million) Forecast, by Application 2019 & 2032
- Table 60: Rest of South America Amyotrophic Lateral Sclerosis Industry Volume (K Unit) Forecast, by Application 2019 & 2032
- Table 61: Global Amyotrophic Lateral Sclerosis Industry Revenue Million Forecast, by Treatment Type 2019 & 2032
- Table 62: Global Amyotrophic Lateral Sclerosis Industry Volume K Unit Forecast, by Treatment Type 2019 & 2032
- Table 63: Global Amyotrophic Lateral Sclerosis Industry Revenue Million Forecast, by Distribution Channel 2019 & 2032
- Table 64: Global Amyotrophic Lateral Sclerosis Industry Volume K Unit Forecast, by Distribution Channel 2019 & 2032
- Table 65: Global Amyotrophic Lateral Sclerosis Industry Revenue Million Forecast, by Country 2019 & 2032
- Table 66: Global Amyotrophic Lateral Sclerosis Industry Volume K Unit Forecast, by Country 2019 & 2032
- Table 67: United States Amyotrophic Lateral Sclerosis Industry Revenue (Million) Forecast, by Application 2019 & 2032
- Table 68: United States Amyotrophic Lateral Sclerosis Industry Volume (K Unit) Forecast, by Application 2019 & 2032
- Table 69: Canada Amyotrophic Lateral Sclerosis Industry Revenue (Million) Forecast, by Application 2019 & 2032
- Table 70: Canada Amyotrophic Lateral Sclerosis Industry Volume (K Unit) Forecast, by Application 2019 & 2032
- Table 71: Mexico Amyotrophic Lateral Sclerosis Industry Revenue (Million) Forecast, by Application 2019 & 2032
- Table 72: Mexico Amyotrophic Lateral Sclerosis Industry Volume (K Unit) Forecast, by Application 2019 & 2032
- Table 73: Global Amyotrophic Lateral Sclerosis Industry Revenue Million Forecast, by Treatment Type 2019 & 2032
- Table 74: Global Amyotrophic Lateral Sclerosis Industry Volume K Unit Forecast, by Treatment Type 2019 & 2032
- Table 75: Global Amyotrophic Lateral Sclerosis Industry Revenue Million Forecast, by Distribution Channel 2019 & 2032
- Table 76: Global Amyotrophic Lateral Sclerosis Industry Volume K Unit Forecast, by Distribution Channel 2019 & 2032
- Table 77: Global Amyotrophic Lateral Sclerosis Industry Revenue Million Forecast, by Country 2019 & 2032
- Table 78: Global Amyotrophic Lateral Sclerosis Industry Volume K Unit Forecast, by Country 2019 & 2032
- Table 79: Germany Amyotrophic Lateral Sclerosis Industry Revenue (Million) Forecast, by Application 2019 & 2032
- Table 80: Germany Amyotrophic Lateral Sclerosis Industry Volume (K Unit) Forecast, by Application 2019 & 2032
- Table 81: United Kingdom Amyotrophic Lateral Sclerosis Industry Revenue (Million) Forecast, by Application 2019 & 2032
- Table 82: United Kingdom Amyotrophic Lateral Sclerosis Industry Volume (K Unit) Forecast, by Application 2019 & 2032
- Table 83: France Amyotrophic Lateral Sclerosis Industry Revenue (Million) Forecast, by Application 2019 & 2032
- Table 84: France Amyotrophic Lateral Sclerosis Industry Volume (K Unit) Forecast, by Application 2019 & 2032
- Table 85: Italy Amyotrophic Lateral Sclerosis Industry Revenue (Million) Forecast, by Application 2019 & 2032
- Table 86: Italy Amyotrophic Lateral Sclerosis Industry Volume (K Unit) Forecast, by Application 2019 & 2032
- Table 87: Spain Amyotrophic Lateral Sclerosis Industry Revenue (Million) Forecast, by Application 2019 & 2032
- Table 88: Spain Amyotrophic Lateral Sclerosis Industry Volume (K Unit) Forecast, by Application 2019 & 2032
- Table 89: Rest of Europe Amyotrophic Lateral Sclerosis Industry Revenue (Million) Forecast, by Application 2019 & 2032
- Table 90: Rest of Europe Amyotrophic Lateral Sclerosis Industry Volume (K Unit) Forecast, by Application 2019 & 2032
- Table 91: Global Amyotrophic Lateral Sclerosis Industry Revenue Million Forecast, by Treatment Type 2019 & 2032
- Table 92: Global Amyotrophic Lateral Sclerosis Industry Volume K Unit Forecast, by Treatment Type 2019 & 2032
- Table 93: Global Amyotrophic Lateral Sclerosis Industry Revenue Million Forecast, by Distribution Channel 2019 & 2032
- Table 94: Global Amyotrophic Lateral Sclerosis Industry Volume K Unit Forecast, by Distribution Channel 2019 & 2032
- Table 95: Global Amyotrophic Lateral Sclerosis Industry Revenue Million Forecast, by Country 2019 & 2032
- Table 96: Global Amyotrophic Lateral Sclerosis Industry Volume K Unit Forecast, by Country 2019 & 2032
- Table 97: China Amyotrophic Lateral Sclerosis Industry Revenue (Million) Forecast, by Application 2019 & 2032
- Table 98: China Amyotrophic Lateral Sclerosis Industry Volume (K Unit) Forecast, by Application 2019 & 2032
- Table 99: Japan Amyotrophic Lateral Sclerosis Industry Revenue (Million) Forecast, by Application 2019 & 2032
- Table 100: Japan Amyotrophic Lateral Sclerosis Industry Volume (K Unit) Forecast, by Application 2019 & 2032
- Table 101: India Amyotrophic Lateral Sclerosis Industry Revenue (Million) Forecast, by Application 2019 & 2032
- Table 102: India Amyotrophic Lateral Sclerosis Industry Volume (K Unit) Forecast, by Application 2019 & 2032
- Table 103: Australia Amyotrophic Lateral Sclerosis Industry Revenue (Million) Forecast, by Application 2019 & 2032
- Table 104: Australia Amyotrophic Lateral Sclerosis Industry Volume (K Unit) Forecast, by Application 2019 & 2032
- Table 105: South Korea Amyotrophic Lateral Sclerosis Industry Revenue (Million) Forecast, by Application 2019 & 2032
- Table 106: South Korea Amyotrophic Lateral Sclerosis Industry Volume (K Unit) Forecast, by Application 2019 & 2032
- Table 107: Rest of Asia Pacific Amyotrophic Lateral Sclerosis Industry Revenue (Million) Forecast, by Application 2019 & 2032
- Table 108: Rest of Asia Pacific Amyotrophic Lateral Sclerosis Industry Volume (K Unit) Forecast, by Application 2019 & 2032
- Table 109: Global Amyotrophic Lateral Sclerosis Industry Revenue Million Forecast, by Treatment Type 2019 & 2032
- Table 110: Global Amyotrophic Lateral Sclerosis Industry Volume K Unit Forecast, by Treatment Type 2019 & 2032
- Table 111: Global Amyotrophic Lateral Sclerosis Industry Revenue Million Forecast, by Distribution Channel 2019 & 2032
- Table 112: Global Amyotrophic Lateral Sclerosis Industry Volume K Unit Forecast, by Distribution Channel 2019 & 2032
- Table 113: Global Amyotrophic Lateral Sclerosis Industry Revenue Million Forecast, by Country 2019 & 2032
- Table 114: Global Amyotrophic Lateral Sclerosis Industry Volume K Unit Forecast, by Country 2019 & 2032
- Table 115: GCC Amyotrophic Lateral Sclerosis Industry Revenue (Million) Forecast, by Application 2019 & 2032
- Table 116: GCC Amyotrophic Lateral Sclerosis Industry Volume (K Unit) Forecast, by Application 2019 & 2032
- Table 117: South Africa Amyotrophic Lateral Sclerosis Industry Revenue (Million) Forecast, by Application 2019 & 2032
- Table 118: South Africa Amyotrophic Lateral Sclerosis Industry Volume (K Unit) Forecast, by Application 2019 & 2032
- Table 119: Rest of Middle East and Africa Amyotrophic Lateral Sclerosis Industry Revenue (Million) Forecast, by Application 2019 & 2032
- Table 120: Rest of Middle East and Africa Amyotrophic Lateral Sclerosis Industry Volume (K Unit) Forecast, by Application 2019 & 2032
- Table 121: Global Amyotrophic Lateral Sclerosis Industry Revenue Million Forecast, by Treatment Type 2019 & 2032
- Table 122: Global Amyotrophic Lateral Sclerosis Industry Volume K Unit Forecast, by Treatment Type 2019 & 2032
- Table 123: Global Amyotrophic Lateral Sclerosis Industry Revenue Million Forecast, by Distribution Channel 2019 & 2032
- Table 124: Global Amyotrophic Lateral Sclerosis Industry Volume K Unit Forecast, by Distribution Channel 2019 & 2032
- Table 125: Global Amyotrophic Lateral Sclerosis Industry Revenue Million Forecast, by Country 2019 & 2032
- Table 126: Global Amyotrophic Lateral Sclerosis Industry Volume K Unit Forecast, by Country 2019 & 2032
- Table 127: Brazil Amyotrophic Lateral Sclerosis Industry Revenue (Million) Forecast, by Application 2019 & 2032
- Table 128: Brazil Amyotrophic Lateral Sclerosis Industry Volume (K Unit) Forecast, by Application 2019 & 2032
- Table 129: Argentina Amyotrophic Lateral Sclerosis Industry Revenue (Million) Forecast, by Application 2019 & 2032
- Table 130: Argentina Amyotrophic Lateral Sclerosis Industry Volume (K Unit) Forecast, by Application 2019 & 2032
- Table 131: Rest of South America Amyotrophic Lateral Sclerosis Industry Revenue (Million) Forecast, by Application 2019 & 2032
- Table 132: Rest of South America Amyotrophic Lateral Sclerosis Industry Volume (K Unit) Forecast, by Application 2019 & 2032
Frequently Asked Questions
1. What is the projected Compound Annual Growth Rate (CAGR) of the Amyotrophic Lateral Sclerosis Industry?
The projected CAGR is approximately 6.30%.
2. Which companies are prominent players in the Amyotrophic Lateral Sclerosis Industry?
Key companies in the market include Boehringer Ingelheim International GmbH, Mitsubishi Tanabe Pharma Corporation, Biogen, Biohaven Pharmaceutical, Amylyx Pharmaceuticals Inc, BrainStorm Cell Limited, Ionis Pharmaceuticals, CORESTEM Inc, ANNEXON INC , AbbVie Inc, CRISPR Therapeutics, Sun Pharmaceutical Industries Ltd, AB Science, Otsuka Pharmaceutical Co Ltd.
3. What are the main segments of the Amyotrophic Lateral Sclerosis Industry?
The market segments include Treatment Type, Distribution Channel.
4. Can you provide details about the market size?
The market size is estimated to be USD XX Million as of 2022.
5. What are some drivers contributing to market growth?
Rising Prevalence of Amyotrophic Lateral Sclerosis; Growing Geriatric Population.
6. What are the notable trends driving market growth?
Medications Are Expected To Witness Healthy Growth Over the Forecast Period.
7. Are there any restraints impacting market growth?
High Cost of Treatment.
8. Can you provide examples of recent developments in the market?
In June 2022, Canada approved Amylyx Pharmaceuticals Inc.'s new drug ALBRIOZA (also known as AMX0035) for amyotrophic lateral sclerosis.
9. What pricing options are available for accessing the report?
Pricing options include single-user, multi-user, and enterprise licenses priced at USD 4750, USD 5250, and USD 8750 respectively.
10. Is the market size provided in terms of value or volume?
The market size is provided in terms of value, measured in Million and volume, measured in K Unit.
11. Are there any specific market keywords associated with the report?
Yes, the market keyword associated with the report is "Amyotrophic Lateral Sclerosis Industry," which aids in identifying and referencing the specific market segment covered.
12. How do I determine which pricing option suits my needs best?
The pricing options vary based on user requirements and access needs. Individual users may opt for single-user licenses, while businesses requiring broader access may choose multi-user or enterprise licenses for cost-effective access to the report.
13. Are there any additional resources or data provided in the Amyotrophic Lateral Sclerosis Industry report?
While the report offers comprehensive insights, it's advisable to review the specific contents or supplementary materials provided to ascertain if additional resources or data are available.
14. How can I stay updated on further developments or reports in the Amyotrophic Lateral Sclerosis Industry?
To stay informed about further developments, trends, and reports in the Amyotrophic Lateral Sclerosis Industry, consider subscribing to industry newsletters, following relevant companies and organizations, or regularly checking reputable industry news sources and publications.
Methodology
Step 1 - Identification of Relevant Samples Size from Population Database


Step 2 - Approaches for Defining Global Market Size (Value, Volume* & Price*)

Note*: In applicable scenarios
Step 3 - Data Sources
Primary Research
- Web Analytics
- Survey Reports
- Research Institute
- Latest Research Reports
- Opinion Leaders
Secondary Research
- Annual Reports
- White Paper
- Latest Press Release
- Industry Association
- Paid Database
- Investor Presentations

Step 4 - Data Triangulation
Involves using different sources of information in order to increase the validity of a study
These sources are likely to be stakeholders in a program - participants, other researchers, program staff, other community members, and so on.
Then we put all data in single framework & apply various statistical tools to find out the dynamic on the market.
During the analysis stage, feedback from the stakeholder groups would be compared to determine areas of agreement as well as areas of divergence


