
Key Insights
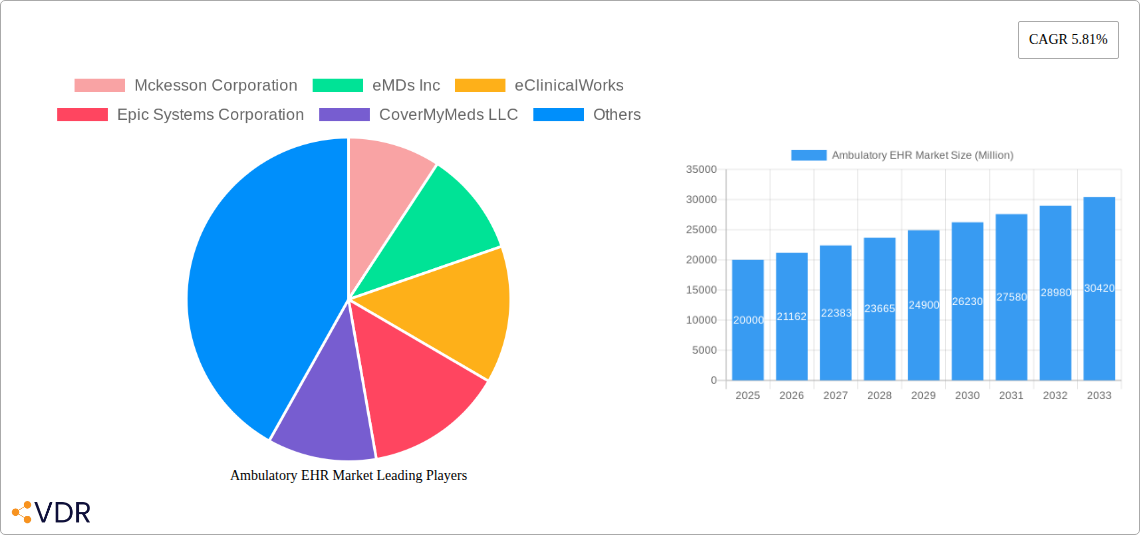
The Ambulatory Electronic Health Record (EHR) market, valued at $20 billion in 2025, is projected to experience robust growth, driven by the increasing adoption of EHR systems in ambulatory care settings. This growth is fueled by several key factors. Firstly, the imperative for improved patient care and operational efficiency is driving widespread adoption. Secondly, government regulations and incentives, such as Meaningful Use programs in the US, are pushing healthcare providers to implement EHR systems to enhance data exchange and quality reporting. Technological advancements, including cloud-based solutions and mobile accessibility, are also significantly contributing to market expansion. The market is segmented by application (practice management, patient management, e-prescribing, etc.), delivery mode (cloud-based vs. on-premise), and practice size (small, medium, large). Cloud-based solutions are gaining significant traction due to their scalability, cost-effectiveness, and accessibility. The largest segment is likely Practice Management, given its fundamental role in ambulatory clinics. Competition is fierce, with major players like McKesson, eMDs, Epic Systems, and Allscripts vying for market share through innovation and strategic acquisitions. The North American market currently holds a dominant position, driven by high technology adoption and robust healthcare infrastructure, followed by Europe and the Asia-Pacific region, which are experiencing accelerated growth.
The projected Compound Annual Growth Rate (CAGR) of 5.81% from 2025 to 2033 suggests a steady expansion of the market. However, growth may face challenges. These include the high initial investment costs associated with EHR implementation and integration, concerns about data security and privacy, and the need for ongoing training and support. Furthermore, the diverse needs of various practice sizes may lead to varying rates of adoption, with smaller practices potentially lagging behind larger organizations due to financial constraints. Despite these restraints, the long-term outlook for the ambulatory EHR market remains positive, propelled by technological advancements, increasing regulatory pressure, and the continued need for efficient and effective healthcare delivery. Regional variations in healthcare infrastructure and regulatory landscapes will influence growth rates across different geographical segments.
Ambulatory EHR Market Report: 2019-2033
This comprehensive report provides a detailed analysis of the Ambulatory EHR market, encompassing market dynamics, growth trends, regional insights, product landscape, key players, and future outlook. The study period spans from 2019 to 2033, with a base year of 2025 and a forecast period of 2025-2033. This report is invaluable for healthcare professionals, investors, and businesses seeking to understand and capitalize on the opportunities within this dynamic market. The market is segmented by Application (Practice Management, Patient Management, E-prescribing, Referral Management, Population Health Management, Other Applications), Delivery Mode (Cloud-based Solutions, On-premise Solutions), Practice Size (Large, Medium, Small), and End User (Hospital-owned Ambulatory Centers, Independent Ambulatory Centers). Key players analyzed include McKesson Corporation, eMDs Inc, eClinicalWorks, Epic Systems Corporation, CoverMyMeds LLC, CureMD, Medical Information Technology Inc, Greenway Health LLC, Oracle Corporation, Allscripts Healthcare Solutions Inc, NextGen Healthcare Information Systems LLC, Medhost, and Athenahealth Inc.
Ambulatory EHR Market Market Dynamics & Structure
The Ambulatory EHR market is characterized by moderate concentration, with a few major players holding significant market share. Technological innovation, particularly in areas like AI-powered diagnostics and cloud-based solutions, is a key driver of market growth. Regulatory frameworks, such as HIPAA compliance in the US and GDPR in Europe, heavily influence market practices. The market also faces competition from legacy systems and emerging alternative solutions. Market dynamics are further shaped by evolving end-user demographics and increased demand for interoperability. Mergers and acquisitions (M&A) activity has been relatively high in recent years, reflecting consolidation within the sector. The market size in 2025 is estimated at $XX million.
- Market Concentration: Top 5 players account for approximately xx% of the market share in 2025.
- Technological Innovation: AI, machine learning, and cloud computing are driving product differentiation and market expansion.
- Regulatory Landscape: Stringent data privacy and security regulations impact market adoption and vendor strategies.
- M&A Activity: An estimated xx M&A deals occurred between 2019 and 2024, leading to market consolidation.
- Innovation Barriers: High development costs and complexities in integrating with existing healthcare systems.
Ambulatory EHR Market Growth Trends & Insights
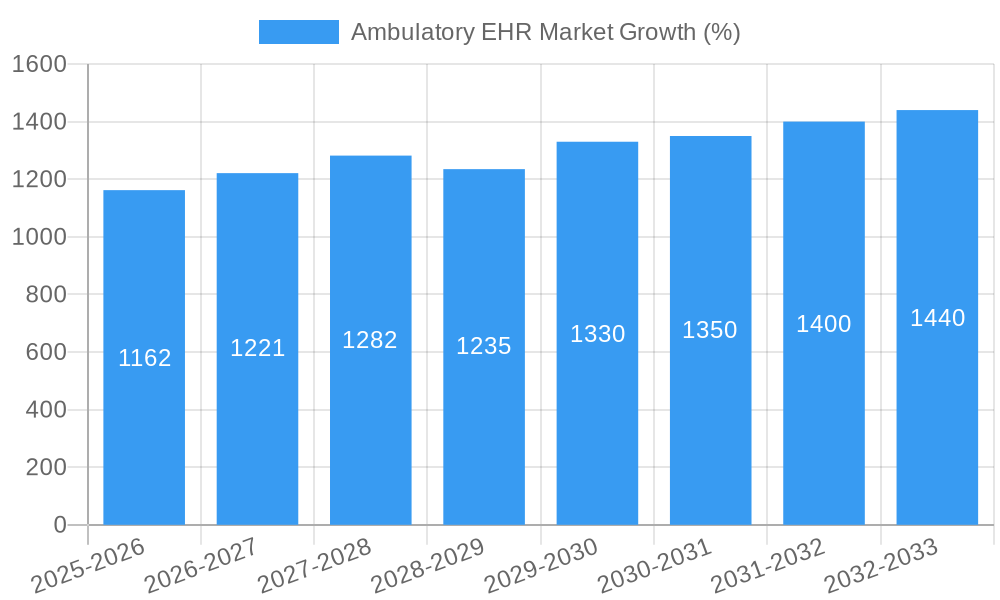
The Ambulatory EHR market has witnessed significant growth over the historical period (2019-2024), driven by increasing adoption among small and medium-sized practices. The market is projected to continue its expansion during the forecast period (2025-2033), with a Compound Annual Growth Rate (CAGR) of xx%. This growth is fueled by factors like rising healthcare expenditures, government initiatives promoting electronic health records, and the increasing need for efficient patient management. The shift towards cloud-based solutions is accelerating market adoption, offering scalability and cost-effectiveness. Consumer behavior shifts, particularly the rising preference for telehealth and remote patient monitoring, further contribute to market growth. Market penetration in 2025 is estimated at xx%.
Dominant Regions, Countries, or Segments in Ambulatory EHR Market
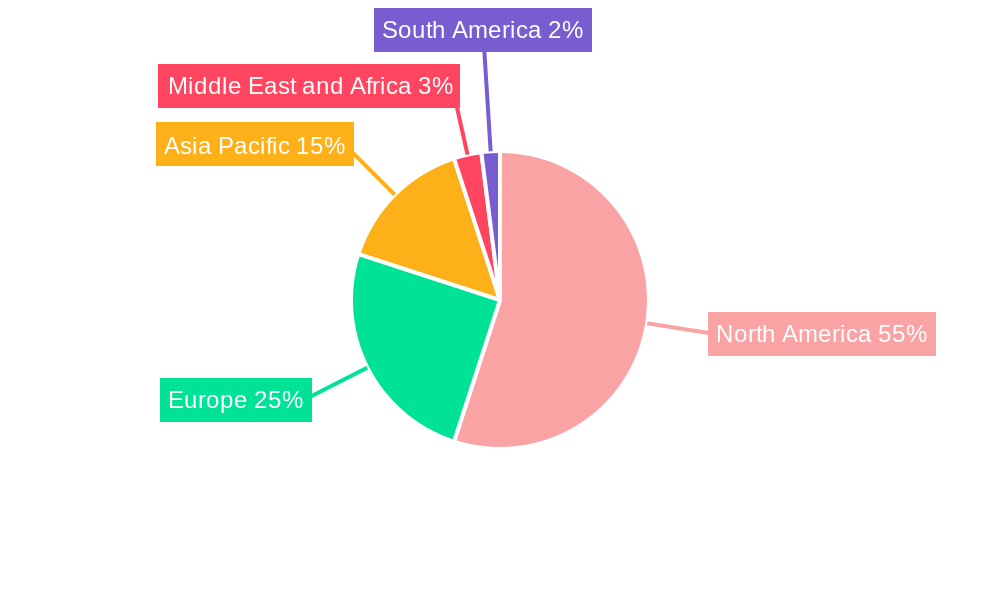
The North American market holds the largest market share, driven by high healthcare spending and advanced technological infrastructure. Within applications, Practice Management and Patient Management are the most dominant segments due to their essential role in streamlining administrative and clinical workflows. Cloud-based solutions dominate the delivery mode segment due to its cost-effectiveness and scalability. Large practices are also significant adopters of Ambulatory EHRs due to their resources and capabilities.
- Key Drivers: Government regulations incentivizing EHR adoption, rising demand for interoperability, and increasing investments in healthcare IT infrastructure.
- North America: High adoption rates due to advanced technological infrastructure and favorable regulatory environment.
- Europe: Growing market driven by increasing digitalization and government initiatives to improve healthcare quality.
- Asia-Pacific: Rapid market growth driven by increasing healthcare spending and rising adoption among emerging economies.
Ambulatory EHR Market Product Landscape
Ambulatory EHR systems are constantly evolving, integrating advanced features like AI-powered diagnostic tools, predictive analytics, and robust patient portals. Key selling propositions include improved patient engagement, streamlined workflows, enhanced data security, and seamless interoperability. Technological advancements like cloud-based architecture, mobile accessibility, and advanced reporting capabilities are driving market innovation.
Key Drivers, Barriers & Challenges in Ambulatory EHR Market
Key Drivers: Rising demand for improved patient care, increased healthcare efficiency, and government regulations mandating EHR adoption. The increasing prevalence of chronic diseases and the growing elderly population are also driving market growth.
Key Challenges: High initial investment costs, integration complexities with existing healthcare systems, data security concerns, and the need for ongoing training and support. The shortage of skilled IT professionals represents a considerable impediment. A conservative estimate shows approximately xx million USD in lost revenue annually due to these challenges.
Emerging Opportunities in Ambulatory EHR Market
Emerging opportunities lie in the integration of telehealth platforms, the expansion into underserved regions, and the development of specialized EHR systems for specific medical specialties. The growing adoption of AI and machine learning in diagnostics and treatment planning is opening new avenues for innovation. The focus on population health management also presents a significant growth opportunity.
Growth Accelerators in the Ambulatory EHR Market Industry
Strategic partnerships between EHR vendors and healthcare providers, as well as investments in research and development, are accelerating market growth. The development of user-friendly interfaces and the integration of advanced analytics are enhancing the value proposition of EHR systems. Expansion into emerging markets and the adoption of subscription-based models are also contributing to long-term growth.
Key Players Shaping the Ambulatory EHR Market Market
- McKesson Corporation
- eMDs Inc
- eClinicalWorks
- Epic Systems Corporation
- CoverMyMeds LLC
- CureMD
- Medical Information Technology Inc
- Greenway Health LLC
- Oracle Corporation
- Allscripts Healthcare Solutions Inc
- Nextgen Healthcare Information Systems LLC
- Medhost
- Athenahealth Inc
Notable Milestones in Ambulatory EHR Market Sector
- March 2023: NextGen Healthcare launched Mirth Cloud Connect, enhancing healthcare interoperability.
- April 2023: eClinicalWorks reported Palm Plastic Surgery & Medspa's transition to its cloud EHR system.
In-Depth Ambulatory EHR Market Market Outlook
The Ambulatory EHR market is poised for sustained growth, driven by technological advancements, increasing healthcare spending, and rising demand for efficient patient management. Strategic partnerships, acquisitions, and the development of innovative features will shape the future of the market. The focus on interoperability, AI, and improved user experience will be crucial for success in this evolving landscape. The market is expected to reach $XX million by 2033.
Ambulatory EHR Market Segmentation
-
1. Application
- 1.1. Practice Management
- 1.2. Patient Management
- 1.3. E-prescribing
- 1.4. Referral Management
- 1.5. Population Health Management
- 1.6. Other Applications
-
2. Delivery Mode
- 2.1. Cloud-based Solutions
- 2.2. On-premise Solutions
-
3. Practice Size
- 3.1. Large Practices
- 3.2. Medium-sized Practices
- 3.3. Small Practices
-
4. End User
- 4.1. Hospital-owned Ambulatory Centers
- 4.2. Independent Ambulatory Centers
Ambulatory EHR Market Segmentation By Geography
-
1. North America
- 1.1. United States
- 1.2. Canada
- 1.3. Mexico
-
2. Europe
- 2.1. Germany
- 2.2. United Kingdom
- 2.3. France
- 2.4. Italy
- 2.5. Spain
- 2.6. Rest of Europe
-
3. Asia Pacific
- 3.1. China
- 3.2. Japan
- 3.3. India
- 3.4. Australia
- 3.5. South Korea
- 3.6. Rest of Asia Pacific
-
4. Middle East and Africa
- 4.1. GCC
- 4.2. South Africa
- 4.3. Rest of Middle East and Africa
-
5. South America
- 5.1. Brazil
- 5.2. Argentina
- 5.3. Rest of South America
Ambulatory EHR Market REPORT HIGHLIGHTS
| Aspects | Details |
|---|---|
| Study Period | 2019-2033 |
| Base Year | 2024 |
| Estimated Year | 2025 |
| Forecast Period | 2025-2033 |
| Historical Period | 2019-2024 |
| Growth Rate | CAGR of 5.81% from 2019-2033 |
| Segmentation |
|
Table of Contents
- 1. Introduction
- 1.1. Research Scope
- 1.2. Market Segmentation
- 1.3. Research Methodology
- 1.4. Definitions and Assumptions
- 2. Executive Summary
- 2.1. Introduction
- 3. Market Dynamics
- 3.1. Introduction
- 3.2. Market Drivers
- 3.2.1. Rising Adoption of EHR Solutions in Developed Markets; Increasing Need for Fluid Movement of Healthcare Information and Technological Advancements; Government Initiatives to Maintain and Enhance Patient Health Record Portals
- 3.3. Market Restrains
- 3.3.1. Inconsistent EHR Adoption across Emerging Markets; Regulatory Barriers
- 3.4. Market Trends
- 3.4.1. Cloud-based Solutions Segment Is Expected to Witness Significant Growth Over the Forecast Period
- 4. Market Factor Analysis
- 4.1. Porters Five Forces
- 4.2. Supply/Value Chain
- 4.3. PESTEL analysis
- 4.4. Market Entropy
- 4.5. Patent/Trademark Analysis
- 5. Global Ambulatory EHR Market Analysis, Insights and Forecast, 2019-2031
- 5.1. Market Analysis, Insights and Forecast - by Application
- 5.1.1. Practice Management
- 5.1.2. Patient Management
- 5.1.3. E-prescribing
- 5.1.4. Referral Management
- 5.1.5. Population Health Management
- 5.1.6. Other Applications
- 5.2. Market Analysis, Insights and Forecast - by Delivery Mode
- 5.2.1. Cloud-based Solutions
- 5.2.2. On-premise Solutions
- 5.3. Market Analysis, Insights and Forecast - by Practice Size
- 5.3.1. Large Practices
- 5.3.2. Medium-sized Practices
- 5.3.3. Small Practices
- 5.4. Market Analysis, Insights and Forecast - by End User
- 5.4.1. Hospital-owned Ambulatory Centers
- 5.4.2. Independent Ambulatory Centers
- 5.5. Market Analysis, Insights and Forecast - by Region
- 5.5.1. North America
- 5.5.2. Europe
- 5.5.3. Asia Pacific
- 5.5.4. Middle East and Africa
- 5.5.5. South America
- 5.1. Market Analysis, Insights and Forecast - by Application
- 6. North America Ambulatory EHR Market Analysis, Insights and Forecast, 2019-2031
- 6.1. Market Analysis, Insights and Forecast - by Application
- 6.1.1. Practice Management
- 6.1.2. Patient Management
- 6.1.3. E-prescribing
- 6.1.4. Referral Management
- 6.1.5. Population Health Management
- 6.1.6. Other Applications
- 6.2. Market Analysis, Insights and Forecast - by Delivery Mode
- 6.2.1. Cloud-based Solutions
- 6.2.2. On-premise Solutions
- 6.3. Market Analysis, Insights and Forecast - by Practice Size
- 6.3.1. Large Practices
- 6.3.2. Medium-sized Practices
- 6.3.3. Small Practices
- 6.4. Market Analysis, Insights and Forecast - by End User
- 6.4.1. Hospital-owned Ambulatory Centers
- 6.4.2. Independent Ambulatory Centers
- 6.1. Market Analysis, Insights and Forecast - by Application
- 7. Europe Ambulatory EHR Market Analysis, Insights and Forecast, 2019-2031
- 7.1. Market Analysis, Insights and Forecast - by Application
- 7.1.1. Practice Management
- 7.1.2. Patient Management
- 7.1.3. E-prescribing
- 7.1.4. Referral Management
- 7.1.5. Population Health Management
- 7.1.6. Other Applications
- 7.2. Market Analysis, Insights and Forecast - by Delivery Mode
- 7.2.1. Cloud-based Solutions
- 7.2.2. On-premise Solutions
- 7.3. Market Analysis, Insights and Forecast - by Practice Size
- 7.3.1. Large Practices
- 7.3.2. Medium-sized Practices
- 7.3.3. Small Practices
- 7.4. Market Analysis, Insights and Forecast - by End User
- 7.4.1. Hospital-owned Ambulatory Centers
- 7.4.2. Independent Ambulatory Centers
- 7.1. Market Analysis, Insights and Forecast - by Application
- 8. Asia Pacific Ambulatory EHR Market Analysis, Insights and Forecast, 2019-2031
- 8.1. Market Analysis, Insights and Forecast - by Application
- 8.1.1. Practice Management
- 8.1.2. Patient Management
- 8.1.3. E-prescribing
- 8.1.4. Referral Management
- 8.1.5. Population Health Management
- 8.1.6. Other Applications
- 8.2. Market Analysis, Insights and Forecast - by Delivery Mode
- 8.2.1. Cloud-based Solutions
- 8.2.2. On-premise Solutions
- 8.3. Market Analysis, Insights and Forecast - by Practice Size
- 8.3.1. Large Practices
- 8.3.2. Medium-sized Practices
- 8.3.3. Small Practices
- 8.4. Market Analysis, Insights and Forecast - by End User
- 8.4.1. Hospital-owned Ambulatory Centers
- 8.4.2. Independent Ambulatory Centers
- 8.1. Market Analysis, Insights and Forecast - by Application
- 9. Middle East and Africa Ambulatory EHR Market Analysis, Insights and Forecast, 2019-2031
- 9.1. Market Analysis, Insights and Forecast - by Application
- 9.1.1. Practice Management
- 9.1.2. Patient Management
- 9.1.3. E-prescribing
- 9.1.4. Referral Management
- 9.1.5. Population Health Management
- 9.1.6. Other Applications
- 9.2. Market Analysis, Insights and Forecast - by Delivery Mode
- 9.2.1. Cloud-based Solutions
- 9.2.2. On-premise Solutions
- 9.3. Market Analysis, Insights and Forecast - by Practice Size
- 9.3.1. Large Practices
- 9.3.2. Medium-sized Practices
- 9.3.3. Small Practices
- 9.4. Market Analysis, Insights and Forecast - by End User
- 9.4.1. Hospital-owned Ambulatory Centers
- 9.4.2. Independent Ambulatory Centers
- 9.1. Market Analysis, Insights and Forecast - by Application
- 10. South America Ambulatory EHR Market Analysis, Insights and Forecast, 2019-2031
- 10.1. Market Analysis, Insights and Forecast - by Application
- 10.1.1. Practice Management
- 10.1.2. Patient Management
- 10.1.3. E-prescribing
- 10.1.4. Referral Management
- 10.1.5. Population Health Management
- 10.1.6. Other Applications
- 10.2. Market Analysis, Insights and Forecast - by Delivery Mode
- 10.2.1. Cloud-based Solutions
- 10.2.2. On-premise Solutions
- 10.3. Market Analysis, Insights and Forecast - by Practice Size
- 10.3.1. Large Practices
- 10.3.2. Medium-sized Practices
- 10.3.3. Small Practices
- 10.4. Market Analysis, Insights and Forecast - by End User
- 10.4.1. Hospital-owned Ambulatory Centers
- 10.4.2. Independent Ambulatory Centers
- 10.1. Market Analysis, Insights and Forecast - by Application
- 11. North America Ambulatory EHR Market Analysis, Insights and Forecast, 2019-2031
- 11.1. Market Analysis, Insights and Forecast - By Country/Sub-region
- 11.1.1 United States
- 11.1.2 Canada
- 11.1.3 Mexico
- 12. Europe Ambulatory EHR Market Analysis, Insights and Forecast, 2019-2031
- 12.1. Market Analysis, Insights and Forecast - By Country/Sub-region
- 12.1.1 Germany
- 12.1.2 United Kingdom
- 12.1.3 France
- 12.1.4 Italy
- 12.1.5 Spain
- 12.1.6 Rest of Europe
- 13. Asia Pacific Ambulatory EHR Market Analysis, Insights and Forecast, 2019-2031
- 13.1. Market Analysis, Insights and Forecast - By Country/Sub-region
- 13.1.1 China
- 13.1.2 Japan
- 13.1.3 India
- 13.1.4 Australia
- 13.1.5 South Korea
- 13.1.6 Rest of Asia Pacific
- 14. Middle East and Africa Ambulatory EHR Market Analysis, Insights and Forecast, 2019-2031
- 14.1. Market Analysis, Insights and Forecast - By Country/Sub-region
- 14.1.1 GCC
- 14.1.2 South Africa
- 14.1.3 Rest of Middle East and Africa
- 15. South America Ambulatory EHR Market Analysis, Insights and Forecast, 2019-2031
- 15.1. Market Analysis, Insights and Forecast - By Country/Sub-region
- 15.1.1 Brazil
- 15.1.2 Argentina
- 15.1.3 Rest of South America
- 16. Competitive Analysis
- 16.1. Global Market Share Analysis 2024
- 16.2. Company Profiles
- 16.2.1 Mckesson Corporation
- 16.2.1.1. Overview
- 16.2.1.2. Products
- 16.2.1.3. SWOT Analysis
- 16.2.1.4. Recent Developments
- 16.2.1.5. Financials (Based on Availability)
- 16.2.2 eMDs Inc
- 16.2.2.1. Overview
- 16.2.2.2. Products
- 16.2.2.3. SWOT Analysis
- 16.2.2.4. Recent Developments
- 16.2.2.5. Financials (Based on Availability)
- 16.2.3 eClinicalWorks
- 16.2.3.1. Overview
- 16.2.3.2. Products
- 16.2.3.3. SWOT Analysis
- 16.2.3.4. Recent Developments
- 16.2.3.5. Financials (Based on Availability)
- 16.2.4 Epic Systems Corporation
- 16.2.4.1. Overview
- 16.2.4.2. Products
- 16.2.4.3. SWOT Analysis
- 16.2.4.4. Recent Developments
- 16.2.4.5. Financials (Based on Availability)
- 16.2.5 CoverMyMeds LLC
- 16.2.5.1. Overview
- 16.2.5.2. Products
- 16.2.5.3. SWOT Analysis
- 16.2.5.4. Recent Developments
- 16.2.5.5. Financials (Based on Availability)
- 16.2.6 CureMD
- 16.2.6.1. Overview
- 16.2.6.2. Products
- 16.2.6.3. SWOT Analysis
- 16.2.6.4. Recent Developments
- 16.2.6.5. Financials (Based on Availability)
- 16.2.7 Medical Information Technology Inc
- 16.2.7.1. Overview
- 16.2.7.2. Products
- 16.2.7.3. SWOT Analysis
- 16.2.7.4. Recent Developments
- 16.2.7.5. Financials (Based on Availability)
- 16.2.8 Greenway Health LLC
- 16.2.8.1. Overview
- 16.2.8.2. Products
- 16.2.8.3. SWOT Analysis
- 16.2.8.4. Recent Developments
- 16.2.8.5. Financials (Based on Availability)
- 16.2.9 Oracle Corporation
- 16.2.9.1. Overview
- 16.2.9.2. Products
- 16.2.9.3. SWOT Analysis
- 16.2.9.4. Recent Developments
- 16.2.9.5. Financials (Based on Availability)
- 16.2.10 Allscripts Healthcare Solutions Inc
- 16.2.10.1. Overview
- 16.2.10.2. Products
- 16.2.10.3. SWOT Analysis
- 16.2.10.4. Recent Developments
- 16.2.10.5. Financials (Based on Availability)
- 16.2.11 Nextgen Healthcare Information Systems LLC
- 16.2.11.1. Overview
- 16.2.11.2. Products
- 16.2.11.3. SWOT Analysis
- 16.2.11.4. Recent Developments
- 16.2.11.5. Financials (Based on Availability)
- 16.2.12 Medhost
- 16.2.12.1. Overview
- 16.2.12.2. Products
- 16.2.12.3. SWOT Analysis
- 16.2.12.4. Recent Developments
- 16.2.12.5. Financials (Based on Availability)
- 16.2.13 Athenahealth Inc
- 16.2.13.1. Overview
- 16.2.13.2. Products
- 16.2.13.3. SWOT Analysis
- 16.2.13.4. Recent Developments
- 16.2.13.5. Financials (Based on Availability)
- 16.2.1 Mckesson Corporation
List of Figures
- Figure 1: Global Ambulatory EHR Market Revenue Breakdown (Million, %) by Region 2024 & 2032
- Figure 2: Global Ambulatory EHR Market Volume Breakdown (K Unit, %) by Region 2024 & 2032
- Figure 3: North America Ambulatory EHR Market Revenue (Million), by Country 2024 & 2032
- Figure 4: North America Ambulatory EHR Market Volume (K Unit), by Country 2024 & 2032
- Figure 5: North America Ambulatory EHR Market Revenue Share (%), by Country 2024 & 2032
- Figure 6: North America Ambulatory EHR Market Volume Share (%), by Country 2024 & 2032
- Figure 7: Europe Ambulatory EHR Market Revenue (Million), by Country 2024 & 2032
- Figure 8: Europe Ambulatory EHR Market Volume (K Unit), by Country 2024 & 2032
- Figure 9: Europe Ambulatory EHR Market Revenue Share (%), by Country 2024 & 2032
- Figure 10: Europe Ambulatory EHR Market Volume Share (%), by Country 2024 & 2032
- Figure 11: Asia Pacific Ambulatory EHR Market Revenue (Million), by Country 2024 & 2032
- Figure 12: Asia Pacific Ambulatory EHR Market Volume (K Unit), by Country 2024 & 2032
- Figure 13: Asia Pacific Ambulatory EHR Market Revenue Share (%), by Country 2024 & 2032
- Figure 14: Asia Pacific Ambulatory EHR Market Volume Share (%), by Country 2024 & 2032
- Figure 15: Middle East and Africa Ambulatory EHR Market Revenue (Million), by Country 2024 & 2032
- Figure 16: Middle East and Africa Ambulatory EHR Market Volume (K Unit), by Country 2024 & 2032
- Figure 17: Middle East and Africa Ambulatory EHR Market Revenue Share (%), by Country 2024 & 2032
- Figure 18: Middle East and Africa Ambulatory EHR Market Volume Share (%), by Country 2024 & 2032
- Figure 19: South America Ambulatory EHR Market Revenue (Million), by Country 2024 & 2032
- Figure 20: South America Ambulatory EHR Market Volume (K Unit), by Country 2024 & 2032
- Figure 21: South America Ambulatory EHR Market Revenue Share (%), by Country 2024 & 2032
- Figure 22: South America Ambulatory EHR Market Volume Share (%), by Country 2024 & 2032
- Figure 23: North America Ambulatory EHR Market Revenue (Million), by Application 2024 & 2032
- Figure 24: North America Ambulatory EHR Market Volume (K Unit), by Application 2024 & 2032
- Figure 25: North America Ambulatory EHR Market Revenue Share (%), by Application 2024 & 2032
- Figure 26: North America Ambulatory EHR Market Volume Share (%), by Application 2024 & 2032
- Figure 27: North America Ambulatory EHR Market Revenue (Million), by Delivery Mode 2024 & 2032
- Figure 28: North America Ambulatory EHR Market Volume (K Unit), by Delivery Mode 2024 & 2032
- Figure 29: North America Ambulatory EHR Market Revenue Share (%), by Delivery Mode 2024 & 2032
- Figure 30: North America Ambulatory EHR Market Volume Share (%), by Delivery Mode 2024 & 2032
- Figure 31: North America Ambulatory EHR Market Revenue (Million), by Practice Size 2024 & 2032
- Figure 32: North America Ambulatory EHR Market Volume (K Unit), by Practice Size 2024 & 2032
- Figure 33: North America Ambulatory EHR Market Revenue Share (%), by Practice Size 2024 & 2032
- Figure 34: North America Ambulatory EHR Market Volume Share (%), by Practice Size 2024 & 2032
- Figure 35: North America Ambulatory EHR Market Revenue (Million), by End User 2024 & 2032
- Figure 36: North America Ambulatory EHR Market Volume (K Unit), by End User 2024 & 2032
- Figure 37: North America Ambulatory EHR Market Revenue Share (%), by End User 2024 & 2032
- Figure 38: North America Ambulatory EHR Market Volume Share (%), by End User 2024 & 2032
- Figure 39: North America Ambulatory EHR Market Revenue (Million), by Country 2024 & 2032
- Figure 40: North America Ambulatory EHR Market Volume (K Unit), by Country 2024 & 2032
- Figure 41: North America Ambulatory EHR Market Revenue Share (%), by Country 2024 & 2032
- Figure 42: North America Ambulatory EHR Market Volume Share (%), by Country 2024 & 2032
- Figure 43: Europe Ambulatory EHR Market Revenue (Million), by Application 2024 & 2032
- Figure 44: Europe Ambulatory EHR Market Volume (K Unit), by Application 2024 & 2032
- Figure 45: Europe Ambulatory EHR Market Revenue Share (%), by Application 2024 & 2032
- Figure 46: Europe Ambulatory EHR Market Volume Share (%), by Application 2024 & 2032
- Figure 47: Europe Ambulatory EHR Market Revenue (Million), by Delivery Mode 2024 & 2032
- Figure 48: Europe Ambulatory EHR Market Volume (K Unit), by Delivery Mode 2024 & 2032
- Figure 49: Europe Ambulatory EHR Market Revenue Share (%), by Delivery Mode 2024 & 2032
- Figure 50: Europe Ambulatory EHR Market Volume Share (%), by Delivery Mode 2024 & 2032
- Figure 51: Europe Ambulatory EHR Market Revenue (Million), by Practice Size 2024 & 2032
- Figure 52: Europe Ambulatory EHR Market Volume (K Unit), by Practice Size 2024 & 2032
- Figure 53: Europe Ambulatory EHR Market Revenue Share (%), by Practice Size 2024 & 2032
- Figure 54: Europe Ambulatory EHR Market Volume Share (%), by Practice Size 2024 & 2032
- Figure 55: Europe Ambulatory EHR Market Revenue (Million), by End User 2024 & 2032
- Figure 56: Europe Ambulatory EHR Market Volume (K Unit), by End User 2024 & 2032
- Figure 57: Europe Ambulatory EHR Market Revenue Share (%), by End User 2024 & 2032
- Figure 58: Europe Ambulatory EHR Market Volume Share (%), by End User 2024 & 2032
- Figure 59: Europe Ambulatory EHR Market Revenue (Million), by Country 2024 & 2032
- Figure 60: Europe Ambulatory EHR Market Volume (K Unit), by Country 2024 & 2032
- Figure 61: Europe Ambulatory EHR Market Revenue Share (%), by Country 2024 & 2032
- Figure 62: Europe Ambulatory EHR Market Volume Share (%), by Country 2024 & 2032
- Figure 63: Asia Pacific Ambulatory EHR Market Revenue (Million), by Application 2024 & 2032
- Figure 64: Asia Pacific Ambulatory EHR Market Volume (K Unit), by Application 2024 & 2032
- Figure 65: Asia Pacific Ambulatory EHR Market Revenue Share (%), by Application 2024 & 2032
- Figure 66: Asia Pacific Ambulatory EHR Market Volume Share (%), by Application 2024 & 2032
- Figure 67: Asia Pacific Ambulatory EHR Market Revenue (Million), by Delivery Mode 2024 & 2032
- Figure 68: Asia Pacific Ambulatory EHR Market Volume (K Unit), by Delivery Mode 2024 & 2032
- Figure 69: Asia Pacific Ambulatory EHR Market Revenue Share (%), by Delivery Mode 2024 & 2032
- Figure 70: Asia Pacific Ambulatory EHR Market Volume Share (%), by Delivery Mode 2024 & 2032
- Figure 71: Asia Pacific Ambulatory EHR Market Revenue (Million), by Practice Size 2024 & 2032
- Figure 72: Asia Pacific Ambulatory EHR Market Volume (K Unit), by Practice Size 2024 & 2032
- Figure 73: Asia Pacific Ambulatory EHR Market Revenue Share (%), by Practice Size 2024 & 2032
- Figure 74: Asia Pacific Ambulatory EHR Market Volume Share (%), by Practice Size 2024 & 2032
- Figure 75: Asia Pacific Ambulatory EHR Market Revenue (Million), by End User 2024 & 2032
- Figure 76: Asia Pacific Ambulatory EHR Market Volume (K Unit), by End User 2024 & 2032
- Figure 77: Asia Pacific Ambulatory EHR Market Revenue Share (%), by End User 2024 & 2032
- Figure 78: Asia Pacific Ambulatory EHR Market Volume Share (%), by End User 2024 & 2032
- Figure 79: Asia Pacific Ambulatory EHR Market Revenue (Million), by Country 2024 & 2032
- Figure 80: Asia Pacific Ambulatory EHR Market Volume (K Unit), by Country 2024 & 2032
- Figure 81: Asia Pacific Ambulatory EHR Market Revenue Share (%), by Country 2024 & 2032
- Figure 82: Asia Pacific Ambulatory EHR Market Volume Share (%), by Country 2024 & 2032
- Figure 83: Middle East and Africa Ambulatory EHR Market Revenue (Million), by Application 2024 & 2032
- Figure 84: Middle East and Africa Ambulatory EHR Market Volume (K Unit), by Application 2024 & 2032
- Figure 85: Middle East and Africa Ambulatory EHR Market Revenue Share (%), by Application 2024 & 2032
- Figure 86: Middle East and Africa Ambulatory EHR Market Volume Share (%), by Application 2024 & 2032
- Figure 87: Middle East and Africa Ambulatory EHR Market Revenue (Million), by Delivery Mode 2024 & 2032
- Figure 88: Middle East and Africa Ambulatory EHR Market Volume (K Unit), by Delivery Mode 2024 & 2032
- Figure 89: Middle East and Africa Ambulatory EHR Market Revenue Share (%), by Delivery Mode 2024 & 2032
- Figure 90: Middle East and Africa Ambulatory EHR Market Volume Share (%), by Delivery Mode 2024 & 2032
- Figure 91: Middle East and Africa Ambulatory EHR Market Revenue (Million), by Practice Size 2024 & 2032
- Figure 92: Middle East and Africa Ambulatory EHR Market Volume (K Unit), by Practice Size 2024 & 2032
- Figure 93: Middle East and Africa Ambulatory EHR Market Revenue Share (%), by Practice Size 2024 & 2032
- Figure 94: Middle East and Africa Ambulatory EHR Market Volume Share (%), by Practice Size 2024 & 2032
- Figure 95: Middle East and Africa Ambulatory EHR Market Revenue (Million), by End User 2024 & 2032
- Figure 96: Middle East and Africa Ambulatory EHR Market Volume (K Unit), by End User 2024 & 2032
- Figure 97: Middle East and Africa Ambulatory EHR Market Revenue Share (%), by End User 2024 & 2032
- Figure 98: Middle East and Africa Ambulatory EHR Market Volume Share (%), by End User 2024 & 2032
- Figure 99: Middle East and Africa Ambulatory EHR Market Revenue (Million), by Country 2024 & 2032
- Figure 100: Middle East and Africa Ambulatory EHR Market Volume (K Unit), by Country 2024 & 2032
- Figure 101: Middle East and Africa Ambulatory EHR Market Revenue Share (%), by Country 2024 & 2032
- Figure 102: Middle East and Africa Ambulatory EHR Market Volume Share (%), by Country 2024 & 2032
- Figure 103: South America Ambulatory EHR Market Revenue (Million), by Application 2024 & 2032
- Figure 104: South America Ambulatory EHR Market Volume (K Unit), by Application 2024 & 2032
- Figure 105: South America Ambulatory EHR Market Revenue Share (%), by Application 2024 & 2032
- Figure 106: South America Ambulatory EHR Market Volume Share (%), by Application 2024 & 2032
- Figure 107: South America Ambulatory EHR Market Revenue (Million), by Delivery Mode 2024 & 2032
- Figure 108: South America Ambulatory EHR Market Volume (K Unit), by Delivery Mode 2024 & 2032
- Figure 109: South America Ambulatory EHR Market Revenue Share (%), by Delivery Mode 2024 & 2032
- Figure 110: South America Ambulatory EHR Market Volume Share (%), by Delivery Mode 2024 & 2032
- Figure 111: South America Ambulatory EHR Market Revenue (Million), by Practice Size 2024 & 2032
- Figure 112: South America Ambulatory EHR Market Volume (K Unit), by Practice Size 2024 & 2032
- Figure 113: South America Ambulatory EHR Market Revenue Share (%), by Practice Size 2024 & 2032
- Figure 114: South America Ambulatory EHR Market Volume Share (%), by Practice Size 2024 & 2032
- Figure 115: South America Ambulatory EHR Market Revenue (Million), by End User 2024 & 2032
- Figure 116: South America Ambulatory EHR Market Volume (K Unit), by End User 2024 & 2032
- Figure 117: South America Ambulatory EHR Market Revenue Share (%), by End User 2024 & 2032
- Figure 118: South America Ambulatory EHR Market Volume Share (%), by End User 2024 & 2032
- Figure 119: South America Ambulatory EHR Market Revenue (Million), by Country 2024 & 2032
- Figure 120: South America Ambulatory EHR Market Volume (K Unit), by Country 2024 & 2032
- Figure 121: South America Ambulatory EHR Market Revenue Share (%), by Country 2024 & 2032
- Figure 122: South America Ambulatory EHR Market Volume Share (%), by Country 2024 & 2032
List of Tables
- Table 1: Global Ambulatory EHR Market Revenue Million Forecast, by Region 2019 & 2032
- Table 2: Global Ambulatory EHR Market Volume K Unit Forecast, by Region 2019 & 2032
- Table 3: Global Ambulatory EHR Market Revenue Million Forecast, by Application 2019 & 2032
- Table 4: Global Ambulatory EHR Market Volume K Unit Forecast, by Application 2019 & 2032
- Table 5: Global Ambulatory EHR Market Revenue Million Forecast, by Delivery Mode 2019 & 2032
- Table 6: Global Ambulatory EHR Market Volume K Unit Forecast, by Delivery Mode 2019 & 2032
- Table 7: Global Ambulatory EHR Market Revenue Million Forecast, by Practice Size 2019 & 2032
- Table 8: Global Ambulatory EHR Market Volume K Unit Forecast, by Practice Size 2019 & 2032
- Table 9: Global Ambulatory EHR Market Revenue Million Forecast, by End User 2019 & 2032
- Table 10: Global Ambulatory EHR Market Volume K Unit Forecast, by End User 2019 & 2032
- Table 11: Global Ambulatory EHR Market Revenue Million Forecast, by Region 2019 & 2032
- Table 12: Global Ambulatory EHR Market Volume K Unit Forecast, by Region 2019 & 2032
- Table 13: Global Ambulatory EHR Market Revenue Million Forecast, by Country 2019 & 2032
- Table 14: Global Ambulatory EHR Market Volume K Unit Forecast, by Country 2019 & 2032
- Table 15: United States Ambulatory EHR Market Revenue (Million) Forecast, by Application 2019 & 2032
- Table 16: United States Ambulatory EHR Market Volume (K Unit) Forecast, by Application 2019 & 2032
- Table 17: Canada Ambulatory EHR Market Revenue (Million) Forecast, by Application 2019 & 2032
- Table 18: Canada Ambulatory EHR Market Volume (K Unit) Forecast, by Application 2019 & 2032
- Table 19: Mexico Ambulatory EHR Market Revenue (Million) Forecast, by Application 2019 & 2032
- Table 20: Mexico Ambulatory EHR Market Volume (K Unit) Forecast, by Application 2019 & 2032
- Table 21: Global Ambulatory EHR Market Revenue Million Forecast, by Country 2019 & 2032
- Table 22: Global Ambulatory EHR Market Volume K Unit Forecast, by Country 2019 & 2032
- Table 23: Germany Ambulatory EHR Market Revenue (Million) Forecast, by Application 2019 & 2032
- Table 24: Germany Ambulatory EHR Market Volume (K Unit) Forecast, by Application 2019 & 2032
- Table 25: United Kingdom Ambulatory EHR Market Revenue (Million) Forecast, by Application 2019 & 2032
- Table 26: United Kingdom Ambulatory EHR Market Volume (K Unit) Forecast, by Application 2019 & 2032
- Table 27: France Ambulatory EHR Market Revenue (Million) Forecast, by Application 2019 & 2032
- Table 28: France Ambulatory EHR Market Volume (K Unit) Forecast, by Application 2019 & 2032
- Table 29: Italy Ambulatory EHR Market Revenue (Million) Forecast, by Application 2019 & 2032
- Table 30: Italy Ambulatory EHR Market Volume (K Unit) Forecast, by Application 2019 & 2032
- Table 31: Spain Ambulatory EHR Market Revenue (Million) Forecast, by Application 2019 & 2032
- Table 32: Spain Ambulatory EHR Market Volume (K Unit) Forecast, by Application 2019 & 2032
- Table 33: Rest of Europe Ambulatory EHR Market Revenue (Million) Forecast, by Application 2019 & 2032
- Table 34: Rest of Europe Ambulatory EHR Market Volume (K Unit) Forecast, by Application 2019 & 2032
- Table 35: Global Ambulatory EHR Market Revenue Million Forecast, by Country 2019 & 2032
- Table 36: Global Ambulatory EHR Market Volume K Unit Forecast, by Country 2019 & 2032
- Table 37: China Ambulatory EHR Market Revenue (Million) Forecast, by Application 2019 & 2032
- Table 38: China Ambulatory EHR Market Volume (K Unit) Forecast, by Application 2019 & 2032
- Table 39: Japan Ambulatory EHR Market Revenue (Million) Forecast, by Application 2019 & 2032
- Table 40: Japan Ambulatory EHR Market Volume (K Unit) Forecast, by Application 2019 & 2032
- Table 41: India Ambulatory EHR Market Revenue (Million) Forecast, by Application 2019 & 2032
- Table 42: India Ambulatory EHR Market Volume (K Unit) Forecast, by Application 2019 & 2032
- Table 43: Australia Ambulatory EHR Market Revenue (Million) Forecast, by Application 2019 & 2032
- Table 44: Australia Ambulatory EHR Market Volume (K Unit) Forecast, by Application 2019 & 2032
- Table 45: South Korea Ambulatory EHR Market Revenue (Million) Forecast, by Application 2019 & 2032
- Table 46: South Korea Ambulatory EHR Market Volume (K Unit) Forecast, by Application 2019 & 2032
- Table 47: Rest of Asia Pacific Ambulatory EHR Market Revenue (Million) Forecast, by Application 2019 & 2032
- Table 48: Rest of Asia Pacific Ambulatory EHR Market Volume (K Unit) Forecast, by Application 2019 & 2032
- Table 49: Global Ambulatory EHR Market Revenue Million Forecast, by Country 2019 & 2032
- Table 50: Global Ambulatory EHR Market Volume K Unit Forecast, by Country 2019 & 2032
- Table 51: GCC Ambulatory EHR Market Revenue (Million) Forecast, by Application 2019 & 2032
- Table 52: GCC Ambulatory EHR Market Volume (K Unit) Forecast, by Application 2019 & 2032
- Table 53: South Africa Ambulatory EHR Market Revenue (Million) Forecast, by Application 2019 & 2032
- Table 54: South Africa Ambulatory EHR Market Volume (K Unit) Forecast, by Application 2019 & 2032
- Table 55: Rest of Middle East and Africa Ambulatory EHR Market Revenue (Million) Forecast, by Application 2019 & 2032
- Table 56: Rest of Middle East and Africa Ambulatory EHR Market Volume (K Unit) Forecast, by Application 2019 & 2032
- Table 57: Global Ambulatory EHR Market Revenue Million Forecast, by Country 2019 & 2032
- Table 58: Global Ambulatory EHR Market Volume K Unit Forecast, by Country 2019 & 2032
- Table 59: Brazil Ambulatory EHR Market Revenue (Million) Forecast, by Application 2019 & 2032
- Table 60: Brazil Ambulatory EHR Market Volume (K Unit) Forecast, by Application 2019 & 2032
- Table 61: Argentina Ambulatory EHR Market Revenue (Million) Forecast, by Application 2019 & 2032
- Table 62: Argentina Ambulatory EHR Market Volume (K Unit) Forecast, by Application 2019 & 2032
- Table 63: Rest of South America Ambulatory EHR Market Revenue (Million) Forecast, by Application 2019 & 2032
- Table 64: Rest of South America Ambulatory EHR Market Volume (K Unit) Forecast, by Application 2019 & 2032
- Table 65: Global Ambulatory EHR Market Revenue Million Forecast, by Application 2019 & 2032
- Table 66: Global Ambulatory EHR Market Volume K Unit Forecast, by Application 2019 & 2032
- Table 67: Global Ambulatory EHR Market Revenue Million Forecast, by Delivery Mode 2019 & 2032
- Table 68: Global Ambulatory EHR Market Volume K Unit Forecast, by Delivery Mode 2019 & 2032
- Table 69: Global Ambulatory EHR Market Revenue Million Forecast, by Practice Size 2019 & 2032
- Table 70: Global Ambulatory EHR Market Volume K Unit Forecast, by Practice Size 2019 & 2032
- Table 71: Global Ambulatory EHR Market Revenue Million Forecast, by End User 2019 & 2032
- Table 72: Global Ambulatory EHR Market Volume K Unit Forecast, by End User 2019 & 2032
- Table 73: Global Ambulatory EHR Market Revenue Million Forecast, by Country 2019 & 2032
- Table 74: Global Ambulatory EHR Market Volume K Unit Forecast, by Country 2019 & 2032
- Table 75: United States Ambulatory EHR Market Revenue (Million) Forecast, by Application 2019 & 2032
- Table 76: United States Ambulatory EHR Market Volume (K Unit) Forecast, by Application 2019 & 2032
- Table 77: Canada Ambulatory EHR Market Revenue (Million) Forecast, by Application 2019 & 2032
- Table 78: Canada Ambulatory EHR Market Volume (K Unit) Forecast, by Application 2019 & 2032
- Table 79: Mexico Ambulatory EHR Market Revenue (Million) Forecast, by Application 2019 & 2032
- Table 80: Mexico Ambulatory EHR Market Volume (K Unit) Forecast, by Application 2019 & 2032
- Table 81: Global Ambulatory EHR Market Revenue Million Forecast, by Application 2019 & 2032
- Table 82: Global Ambulatory EHR Market Volume K Unit Forecast, by Application 2019 & 2032
- Table 83: Global Ambulatory EHR Market Revenue Million Forecast, by Delivery Mode 2019 & 2032
- Table 84: Global Ambulatory EHR Market Volume K Unit Forecast, by Delivery Mode 2019 & 2032
- Table 85: Global Ambulatory EHR Market Revenue Million Forecast, by Practice Size 2019 & 2032
- Table 86: Global Ambulatory EHR Market Volume K Unit Forecast, by Practice Size 2019 & 2032
- Table 87: Global Ambulatory EHR Market Revenue Million Forecast, by End User 2019 & 2032
- Table 88: Global Ambulatory EHR Market Volume K Unit Forecast, by End User 2019 & 2032
- Table 89: Global Ambulatory EHR Market Revenue Million Forecast, by Country 2019 & 2032
- Table 90: Global Ambulatory EHR Market Volume K Unit Forecast, by Country 2019 & 2032
- Table 91: Germany Ambulatory EHR Market Revenue (Million) Forecast, by Application 2019 & 2032
- Table 92: Germany Ambulatory EHR Market Volume (K Unit) Forecast, by Application 2019 & 2032
- Table 93: United Kingdom Ambulatory EHR Market Revenue (Million) Forecast, by Application 2019 & 2032
- Table 94: United Kingdom Ambulatory EHR Market Volume (K Unit) Forecast, by Application 2019 & 2032
- Table 95: France Ambulatory EHR Market Revenue (Million) Forecast, by Application 2019 & 2032
- Table 96: France Ambulatory EHR Market Volume (K Unit) Forecast, by Application 2019 & 2032
- Table 97: Italy Ambulatory EHR Market Revenue (Million) Forecast, by Application 2019 & 2032
- Table 98: Italy Ambulatory EHR Market Volume (K Unit) Forecast, by Application 2019 & 2032
- Table 99: Spain Ambulatory EHR Market Revenue (Million) Forecast, by Application 2019 & 2032
- Table 100: Spain Ambulatory EHR Market Volume (K Unit) Forecast, by Application 2019 & 2032
- Table 101: Rest of Europe Ambulatory EHR Market Revenue (Million) Forecast, by Application 2019 & 2032
- Table 102: Rest of Europe Ambulatory EHR Market Volume (K Unit) Forecast, by Application 2019 & 2032
- Table 103: Global Ambulatory EHR Market Revenue Million Forecast, by Application 2019 & 2032
- Table 104: Global Ambulatory EHR Market Volume K Unit Forecast, by Application 2019 & 2032
- Table 105: Global Ambulatory EHR Market Revenue Million Forecast, by Delivery Mode 2019 & 2032
- Table 106: Global Ambulatory EHR Market Volume K Unit Forecast, by Delivery Mode 2019 & 2032
- Table 107: Global Ambulatory EHR Market Revenue Million Forecast, by Practice Size 2019 & 2032
- Table 108: Global Ambulatory EHR Market Volume K Unit Forecast, by Practice Size 2019 & 2032
- Table 109: Global Ambulatory EHR Market Revenue Million Forecast, by End User 2019 & 2032
- Table 110: Global Ambulatory EHR Market Volume K Unit Forecast, by End User 2019 & 2032
- Table 111: Global Ambulatory EHR Market Revenue Million Forecast, by Country 2019 & 2032
- Table 112: Global Ambulatory EHR Market Volume K Unit Forecast, by Country 2019 & 2032
- Table 113: China Ambulatory EHR Market Revenue (Million) Forecast, by Application 2019 & 2032
- Table 114: China Ambulatory EHR Market Volume (K Unit) Forecast, by Application 2019 & 2032
- Table 115: Japan Ambulatory EHR Market Revenue (Million) Forecast, by Application 2019 & 2032
- Table 116: Japan Ambulatory EHR Market Volume (K Unit) Forecast, by Application 2019 & 2032
- Table 117: India Ambulatory EHR Market Revenue (Million) Forecast, by Application 2019 & 2032
- Table 118: India Ambulatory EHR Market Volume (K Unit) Forecast, by Application 2019 & 2032
- Table 119: Australia Ambulatory EHR Market Revenue (Million) Forecast, by Application 2019 & 2032
- Table 120: Australia Ambulatory EHR Market Volume (K Unit) Forecast, by Application 2019 & 2032
- Table 121: South Korea Ambulatory EHR Market Revenue (Million) Forecast, by Application 2019 & 2032
- Table 122: South Korea Ambulatory EHR Market Volume (K Unit) Forecast, by Application 2019 & 2032
- Table 123: Rest of Asia Pacific Ambulatory EHR Market Revenue (Million) Forecast, by Application 2019 & 2032
- Table 124: Rest of Asia Pacific Ambulatory EHR Market Volume (K Unit) Forecast, by Application 2019 & 2032
- Table 125: Global Ambulatory EHR Market Revenue Million Forecast, by Application 2019 & 2032
- Table 126: Global Ambulatory EHR Market Volume K Unit Forecast, by Application 2019 & 2032
- Table 127: Global Ambulatory EHR Market Revenue Million Forecast, by Delivery Mode 2019 & 2032
- Table 128: Global Ambulatory EHR Market Volume K Unit Forecast, by Delivery Mode 2019 & 2032
- Table 129: Global Ambulatory EHR Market Revenue Million Forecast, by Practice Size 2019 & 2032
- Table 130: Global Ambulatory EHR Market Volume K Unit Forecast, by Practice Size 2019 & 2032
- Table 131: Global Ambulatory EHR Market Revenue Million Forecast, by End User 2019 & 2032
- Table 132: Global Ambulatory EHR Market Volume K Unit Forecast, by End User 2019 & 2032
- Table 133: Global Ambulatory EHR Market Revenue Million Forecast, by Country 2019 & 2032
- Table 134: Global Ambulatory EHR Market Volume K Unit Forecast, by Country 2019 & 2032
- Table 135: GCC Ambulatory EHR Market Revenue (Million) Forecast, by Application 2019 & 2032
- Table 136: GCC Ambulatory EHR Market Volume (K Unit) Forecast, by Application 2019 & 2032
- Table 137: South Africa Ambulatory EHR Market Revenue (Million) Forecast, by Application 2019 & 2032
- Table 138: South Africa Ambulatory EHR Market Volume (K Unit) Forecast, by Application 2019 & 2032
- Table 139: Rest of Middle East and Africa Ambulatory EHR Market Revenue (Million) Forecast, by Application 2019 & 2032
- Table 140: Rest of Middle East and Africa Ambulatory EHR Market Volume (K Unit) Forecast, by Application 2019 & 2032
- Table 141: Global Ambulatory EHR Market Revenue Million Forecast, by Application 2019 & 2032
- Table 142: Global Ambulatory EHR Market Volume K Unit Forecast, by Application 2019 & 2032
- Table 143: Global Ambulatory EHR Market Revenue Million Forecast, by Delivery Mode 2019 & 2032
- Table 144: Global Ambulatory EHR Market Volume K Unit Forecast, by Delivery Mode 2019 & 2032
- Table 145: Global Ambulatory EHR Market Revenue Million Forecast, by Practice Size 2019 & 2032
- Table 146: Global Ambulatory EHR Market Volume K Unit Forecast, by Practice Size 2019 & 2032
- Table 147: Global Ambulatory EHR Market Revenue Million Forecast, by End User 2019 & 2032
- Table 148: Global Ambulatory EHR Market Volume K Unit Forecast, by End User 2019 & 2032
- Table 149: Global Ambulatory EHR Market Revenue Million Forecast, by Country 2019 & 2032
- Table 150: Global Ambulatory EHR Market Volume K Unit Forecast, by Country 2019 & 2032
- Table 151: Brazil Ambulatory EHR Market Revenue (Million) Forecast, by Application 2019 & 2032
- Table 152: Brazil Ambulatory EHR Market Volume (K Unit) Forecast, by Application 2019 & 2032
- Table 153: Argentina Ambulatory EHR Market Revenue (Million) Forecast, by Application 2019 & 2032
- Table 154: Argentina Ambulatory EHR Market Volume (K Unit) Forecast, by Application 2019 & 2032
- Table 155: Rest of South America Ambulatory EHR Market Revenue (Million) Forecast, by Application 2019 & 2032
- Table 156: Rest of South America Ambulatory EHR Market Volume (K Unit) Forecast, by Application 2019 & 2032
Frequently Asked Questions
1. What is the projected Compound Annual Growth Rate (CAGR) of the Ambulatory EHR Market?
The projected CAGR is approximately 5.81%.
2. Which companies are prominent players in the Ambulatory EHR Market?
Key companies in the market include Mckesson Corporation, eMDs Inc, eClinicalWorks, Epic Systems Corporation, CoverMyMeds LLC, CureMD, Medical Information Technology Inc, Greenway Health LLC, Oracle Corporation, Allscripts Healthcare Solutions Inc, Nextgen Healthcare Information Systems LLC, Medhost, Athenahealth Inc.
3. What are the main segments of the Ambulatory EHR Market?
The market segments include Application, Delivery Mode, Practice Size, End User.
4. Can you provide details about the market size?
The market size is estimated to be USD 20 Million as of 2022.
5. What are some drivers contributing to market growth?
Rising Adoption of EHR Solutions in Developed Markets; Increasing Need for Fluid Movement of Healthcare Information and Technological Advancements; Government Initiatives to Maintain and Enhance Patient Health Record Portals.
6. What are the notable trends driving market growth?
Cloud-based Solutions Segment Is Expected to Witness Significant Growth Over the Forecast Period.
7. Are there any restraints impacting market growth?
Inconsistent EHR Adoption across Emerging Markets; Regulatory Barriers.
8. Can you provide examples of recent developments in the market?
March 2023: NextGen Healthcare, an ambulatory EHR vendor, launched Mirth Cloud Connect, a cloud-based solution that aims to streamline healthcare interoperability. The tool integrates patient data flow from multiple trusted sources for actionable insights at the point of care.
9. What pricing options are available for accessing the report?
Pricing options include single-user, multi-user, and enterprise licenses priced at USD 4750, USD 5250, and USD 8750 respectively.
10. Is the market size provided in terms of value or volume?
The market size is provided in terms of value, measured in Million and volume, measured in K Unit.
11. Are there any specific market keywords associated with the report?
Yes, the market keyword associated with the report is "Ambulatory EHR Market," which aids in identifying and referencing the specific market segment covered.
12. How do I determine which pricing option suits my needs best?
The pricing options vary based on user requirements and access needs. Individual users may opt for single-user licenses, while businesses requiring broader access may choose multi-user or enterprise licenses for cost-effective access to the report.
13. Are there any additional resources or data provided in the Ambulatory EHR Market report?
While the report offers comprehensive insights, it's advisable to review the specific contents or supplementary materials provided to ascertain if additional resources or data are available.
14. How can I stay updated on further developments or reports in the Ambulatory EHR Market?
To stay informed about further developments, trends, and reports in the Ambulatory EHR Market, consider subscribing to industry newsletters, following relevant companies and organizations, or regularly checking reputable industry news sources and publications.
Methodology
Step 1 - Identification of Relevant Samples Size from Population Database


Step 2 - Approaches for Defining Global Market Size (Value, Volume* & Price*)

Note*: In applicable scenarios
Step 3 - Data Sources
Primary Research
- Web Analytics
- Survey Reports
- Research Institute
- Latest Research Reports
- Opinion Leaders
Secondary Research
- Annual Reports
- White Paper
- Latest Press Release
- Industry Association
- Paid Database
- Investor Presentations

Step 4 - Data Triangulation
Involves using different sources of information in order to increase the validity of a study
These sources are likely to be stakeholders in a program - participants, other researchers, program staff, other community members, and so on.
Then we put all data in single framework & apply various statistical tools to find out the dynamic on the market.
During the analysis stage, feedback from the stakeholder groups would be compared to determine areas of agreement as well as areas of divergence


