

Key Insights
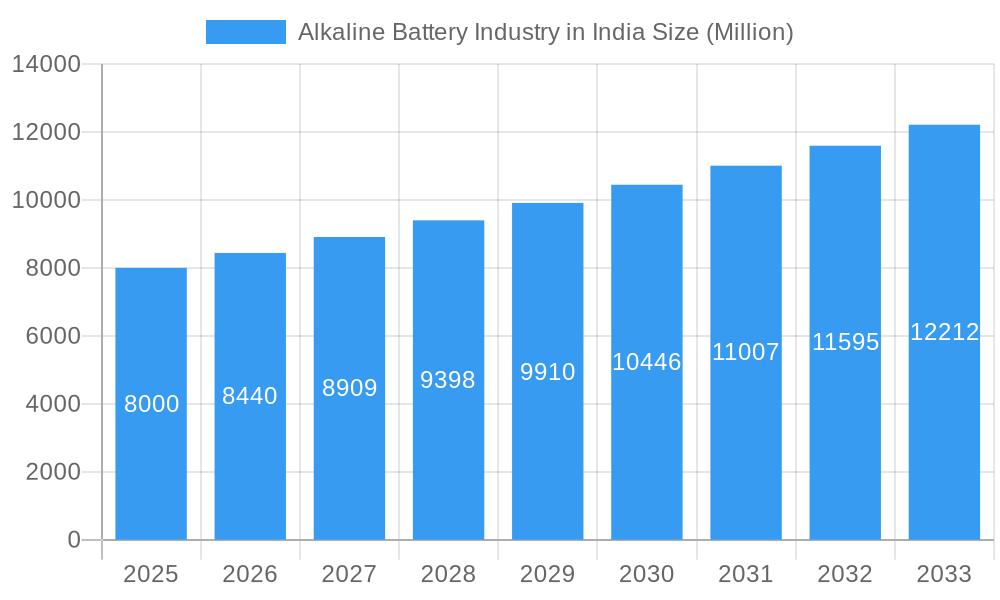
The Indian alkaline battery market, projected at 910 million in its base year of 2025, is poised for significant expansion. Forecasted to grow at a Compound Annual Growth Rate (CAGR) of 6.89% from 2025 to 2033, this growth is propelled by robust demand for portable electronics, including smartphones, tablets, and remote controls. The burgeoning e-commerce sector and increased adoption of battery-powered consumer goods and toys further stimulate market demand. Industrial and commercial applications, such as emergency lighting and security systems, present substantial growth avenues. Within market segmentation, primary batteries, particularly for consumer electronics, hold the dominant share. However, the commercial segment is anticipated to experience accelerated growth driven by industrial uses. Despite challenges like raw material price volatility and environmental disposal concerns, the market trajectory remains highly positive.
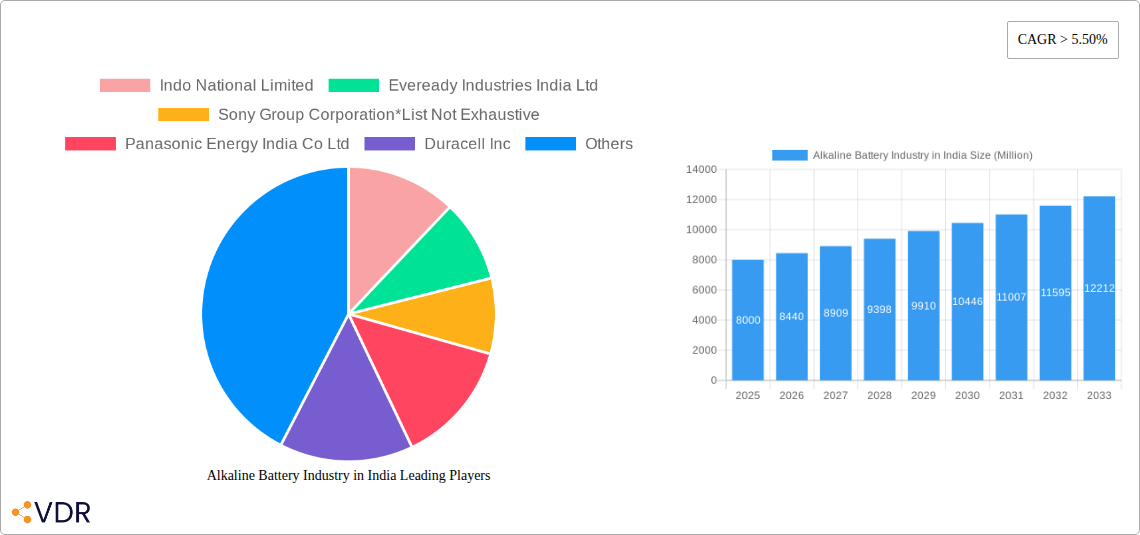
Alkaline Battery Industry in India Market Size (In Million)
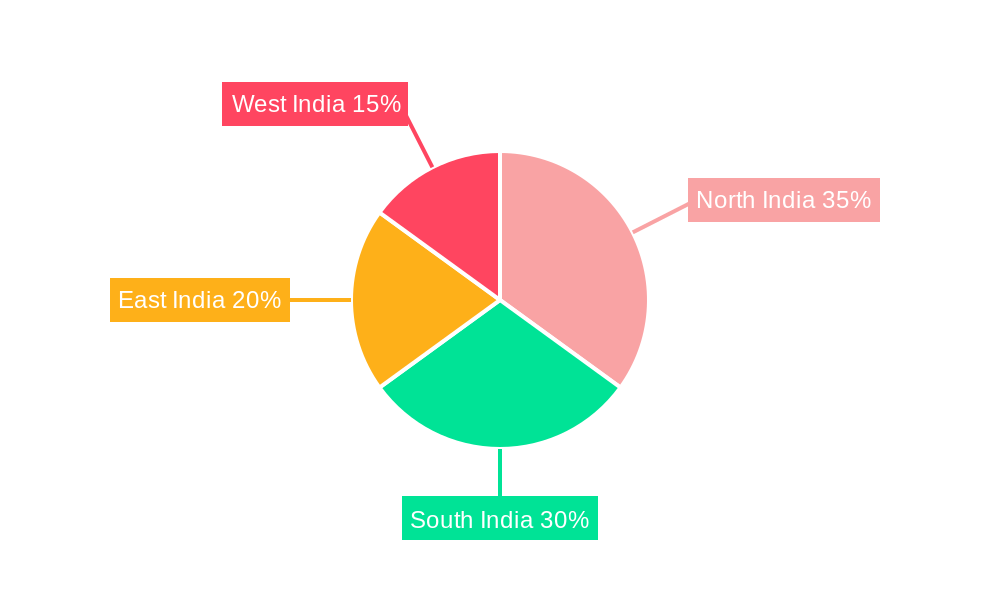
Key market participants such as Indo National Limited, Eveready Industries India Ltd, Sony, Panasonic, Duracell, GP Batteries, and Energizer are actively innovating. Their focus areas include enhancing product performance, extending battery lifespan, and developing eco-friendly alternatives. Regional market leadership is expected from North and South India, attributed to higher population densities and increased consumer expenditure on electronics. The forecast period (2025-2033) anticipates sustained market growth, fueled by rising disposable incomes, urbanization, and the expanding consumer electronics landscape. Strategic opportunities for market players include developing energy-efficient designs, establishing sustainable recycling processes, and targeting niche commercial and industrial segments. Mergers, acquisitions, and strategic partnerships will likely be pivotal in shaping the market's evolution.
Alkaline Battery Industry in India Company Market Share
Alkaline Battery Industry in India: A Comprehensive Market Report (2019-2033)
This comprehensive report provides an in-depth analysis of the alkaline battery industry in India, covering market dynamics, growth trends, key players, and future outlook. The study period spans from 2019 to 2033, with 2025 serving as both the base and estimated year. The report meticulously examines the parent market (battery industry) and its child market (alkaline batteries), offering granular insights valuable to industry professionals, investors, and researchers. All values are presented in million units.
Alkaline Battery Industry in India Market Dynamics & Structure
This section analyzes the competitive landscape, technological advancements, regulatory environment, and market trends within the Indian alkaline battery industry. The market is characterized by a moderate level of concentration, with key players vying for market share. Technological innovation is driven by the demand for higher energy density and longer lifespan batteries, particularly in the consumer electronics segment.
- Market Concentration: The top five players hold an estimated xx% market share in 2025.
- Technological Innovation: Focus on improving energy density, extending battery life, and developing eco-friendly materials.
- Regulatory Framework: The MoEFCC's battery waste management regulations (issued March 2020) are reshaping the industry, impacting production and disposal practices. Compliance costs are estimated to impact profitability by xx% by 2030.
- Competitive Substitutes: Rechargeable batteries (NiMH, Li-ion) pose a significant threat, leading to increased competition. Market share of rechargeable batteries is projected to increase by xx% by 2033.
- End-User Demographics: Growth is primarily driven by the expanding consumer electronics market and increasing demand from the commercial sector.
- M&A Trends: A moderate level of M&A activity is expected, primarily driven by consolidation efforts among smaller players. An estimated xx M&A deals are predicted between 2025 and 2033.
Alkaline Battery Industry in India Growth Trends & Insights
The Indian alkaline battery market exhibits steady growth, fueled by rising disposable incomes, increasing urbanization, and expanding consumer electronics adoption. This section analyzes market size evolution, adoption rates, technological disruptions, and evolving consumer behavior patterns.
The market size increased from xx million units in 2019 to xx million units in 2024, demonstrating a CAGR of xx%. This growth trajectory is expected to continue, with the market projected to reach xx million units by 2033, exhibiting a CAGR of xx% during the forecast period (2025-2033). Technological advancements, such as improved energy density and extended shelf life, are key drivers. Shifting consumer preferences towards portable electronics and increased demand from emerging sectors like commercial applications further fuel this growth. Market penetration in rural areas is also expected to increase significantly.
Dominant Regions, Countries, or Segments in Alkaline Battery Industry in India
The report identifies the leading regions and segments driving market growth. Urban centers in major states like Maharashtra, Gujarat, and Tamil Nadu are key contributors. Consumer electronics dominate application-wise, followed by the commercial sector. Primary alkaline batteries still hold a larger market share compared to secondary batteries.
- Key Drivers: Rapid urbanization, rising disposable incomes, expanding consumer electronics market, and increasing industrialization.
- Dominant Segment: Consumer electronics segment holds the largest market share with xx% in 2025, projected to reach xx% by 2033.
- Growth Potential: Significant growth potential lies in rural markets and emerging applications within the commercial and industrial sectors.
Alkaline Battery Industry in India Product Landscape
The alkaline battery market offers a range of products catering to diverse applications. Key product innovations include improved energy density, longer shelf life, and eco-friendly designs. The focus is shifting towards high-performance batteries for demanding applications like power tools and portable medical devices. Unique selling propositions often include enhanced durability, reliability, and superior performance.
Key Drivers, Barriers & Challenges in Alkaline Battery Industry in India
Key Drivers:
- Increasing demand for portable electronics.
- Growth of the e-commerce sector.
- Expansion of the commercial sector.
- Government initiatives promoting industrial growth.
Challenges & Restraints:
- Intense competition from rechargeable battery alternatives.
- Fluctuations in raw material prices.
- Stringent environmental regulations.
- Supply chain disruptions leading to xx% increase in production costs in 2024.
Emerging Opportunities in Alkaline Battery Industry in India
- Expansion into rural markets.
- Development of specialized batteries for niche applications.
- Adoption of sustainable manufacturing practices.
- Increased focus on battery recycling and waste management to comply with MoEFCC regulations.
Growth Accelerators in the Alkaline Battery Industry in India Industry
Technological breakthroughs in battery chemistry and design are crucial growth drivers. Strategic partnerships for technology transfer and market access are also becoming increasingly important. Expansion into new markets and applications will further propel the industry's growth trajectory.
Key Players Shaping the Alkaline Battery Industry in India Market
- Indo National Limited
- Eveready Industries India Ltd
- Sony Group Corporation
- Panasonic Energy India Co Ltd
- Duracell Inc
- GPB International Limited
- Geep Industries Pvt Ltd
- FUTURISTIC IDC Pvt Ltd
- Energizer Holdings
- Coslight India
Notable Milestones in Alkaline Battery Industry in India Sector
- March 2020: MoEFCC issues draft notification for battery waste management.
In-Depth Alkaline Battery Industry in India Market Outlook
The Indian alkaline battery market is poised for continued growth, driven by technological advancements, expanding applications, and increasing consumer demand. Strategic investments in research and development, coupled with sustainable manufacturing practices, will be crucial for long-term success. The market presents significant opportunities for both established players and new entrants.
Alkaline Battery Industry in India Segmentation
-
1. Type
- 1.1. Primary
- 1.2. Secondary
-
2. Application
- 2.1. Consumer Electronics
- 2.2. Commercial
- 2.3. Others
Alkaline Battery Industry in India Segmentation By Geography
-
1. North America
- 1.1. United States
- 1.2. Canada
- 1.3. Mexico
-
2. South America
- 2.1. Brazil
- 2.2. Argentina
- 2.3. Rest of South America
-
3. Europe
- 3.1. United Kingdom
- 3.2. Germany
- 3.3. France
- 3.4. Italy
- 3.5. Spain
- 3.6. Russia
- 3.7. Benelux
- 3.8. Nordics
- 3.9. Rest of Europe
-
4. Middle East & Africa
- 4.1. Turkey
- 4.2. Israel
- 4.3. GCC
- 4.4. North Africa
- 4.5. South Africa
- 4.6. Rest of Middle East & Africa
-
5. Asia Pacific
- 5.1. China
- 5.2. India
- 5.3. Japan
- 5.4. South Korea
- 5.5. ASEAN
- 5.6. Oceania
- 5.7. Rest of Asia Pacific
Alkaline Battery Industry in India Regional Market Share
Geographic Coverage of Alkaline Battery Industry in India
Alkaline Battery Industry in India REPORT HIGHLIGHTS
| Aspects | Details |
|---|---|
| Study Period | 2020-2034 |
| Base Year | 2025 |
| Estimated Year | 2026 |
| Forecast Period | 2026-2034 |
| Historical Period | 2020-2025 |
| Growth Rate | CAGR of 6.89% from 2020-2034 |
| Segmentation |
|
Table of Contents
- 1. Introduction
- 1.1. Research Scope
- 1.2. Market Segmentation
- 1.3. Research Objective
- 1.4. Definitions and Assumptions
- 2. Executive Summary
- 2.1. Market Snapshot
- 3. Market Dynamics
- 3.1. Market Drivers
- 3.2. Market Restrains
- 3.3. Market Trends
- 3.4. Market Opportunities
- 4. Market Factor Analysis
- 4.1. Porters Five Forces
- 4.1.1. Bargaining Power of Suppliers
- 4.1.2. Bargaining Power of Buyers
- 4.1.3. Threat of New Entrants
- 4.1.4. Threat of Substitutes
- 4.1.5. Competitive Rivalry
- 4.2. PESTEL analysis
- 4.3. BCG Analysis
- 4.3.1. Stars (High Growth, High Market Share)
- 4.3.2. Cash Cows (Low Growth, High Market Share)
- 4.3.3. Question Mark (High Growth, Low Market Share)
- 4.3.4. Dogs (Low Growth, Low Market Share)
- 4.4. Ansoff Matrix Analysis
- 4.5. Supply Chain Analysis
- 4.6. Regulatory Landscape
- 4.7. Current Market Potential and Opportunity Assessment (TAM–SAM–SOM Framework)
- 4.8. VDR Analyst Note
- 4.1. Porters Five Forces
- 5. Market Analysis, Insights and Forecast 2021-2033
- 5.1. Market Analysis, Insights and Forecast - by Type
- 5.1.1. Primary
- 5.1.2. Secondary
- 5.2. Market Analysis, Insights and Forecast - by Application
- 5.2.1. Consumer Electronics
- 5.2.2. Commercial
- 5.2.3. Others
- 5.3. Market Analysis, Insights and Forecast - by Region
- 5.3.1. North America
- 5.3.2. South America
- 5.3.3. Europe
- 5.3.4. Middle East & Africa
- 5.3.5. Asia Pacific
- 5.1. Market Analysis, Insights and Forecast - by Type
- 6. Global Alkaline Battery Industry in India Analysis, Insights and Forecast, 2021-2033
- 6.1. Market Analysis, Insights and Forecast - by Type
- 6.1.1. Primary
- 6.1.2. Secondary
- 6.2. Market Analysis, Insights and Forecast - by Application
- 6.2.1. Consumer Electronics
- 6.2.2. Commercial
- 6.2.3. Others
- 6.1. Market Analysis, Insights and Forecast - by Type
- 7. North America Alkaline Battery Industry in India Analysis, Insights and Forecast, 2021-2033
- 7.1. Market Analysis, Insights and Forecast - by Type
- 7.1.1. Primary
- 7.1.2. Secondary
- 7.2. Market Analysis, Insights and Forecast - by Application
- 7.2.1. Consumer Electronics
- 7.2.2. Commercial
- 7.2.3. Others
- 7.1. Market Analysis, Insights and Forecast - by Type
- 8. South America Alkaline Battery Industry in India Analysis, Insights and Forecast, 2021-2033
- 8.1. Market Analysis, Insights and Forecast - by Type
- 8.1.1. Primary
- 8.1.2. Secondary
- 8.2. Market Analysis, Insights and Forecast - by Application
- 8.2.1. Consumer Electronics
- 8.2.2. Commercial
- 8.2.3. Others
- 8.1. Market Analysis, Insights and Forecast - by Type
- 9. Europe Alkaline Battery Industry in India Analysis, Insights and Forecast, 2021-2033
- 9.1. Market Analysis, Insights and Forecast - by Type
- 9.1.1. Primary
- 9.1.2. Secondary
- 9.2. Market Analysis, Insights and Forecast - by Application
- 9.2.1. Consumer Electronics
- 9.2.2. Commercial
- 9.2.3. Others
- 9.1. Market Analysis, Insights and Forecast - by Type
- 10. Middle East & Africa Alkaline Battery Industry in India Analysis, Insights and Forecast, 2021-2033
- 10.1. Market Analysis, Insights and Forecast - by Type
- 10.1.1. Primary
- 10.1.2. Secondary
- 10.2. Market Analysis, Insights and Forecast - by Application
- 10.2.1. Consumer Electronics
- 10.2.2. Commercial
- 10.2.3. Others
- 10.1. Market Analysis, Insights and Forecast - by Type
- 11. Asia Pacific Alkaline Battery Industry in India Analysis, Insights and Forecast, 2021-2033
- 11.1. Market Analysis, Insights and Forecast - by Type
- 11.1.1. Primary
- 11.1.2. Secondary
- 11.2. Market Analysis, Insights and Forecast - by Application
- 11.2.1. Consumer Electronics
- 11.2.2. Commercial
- 11.2.3. Others
- 11.1. Market Analysis, Insights and Forecast - by Type
- 12. Competitive Analysis
- 12.1. Company Profiles
- 12.1.1 Indo National Limited
- 12.1.1.1. Company Overview
- 12.1.1.2. Products
- 12.1.1.3. Company Financials
- 12.1.1.4. SWOT Analysis
- 12.1.2 Eveready Industries India Ltd
- 12.1.2.1. Company Overview
- 12.1.2.2. Products
- 12.1.2.3. Company Financials
- 12.1.2.4. SWOT Analysis
- 12.1.3 Sony Group Corporation*List Not Exhaustive
- 12.1.3.1. Company Overview
- 12.1.3.2. Products
- 12.1.3.3. Company Financials
- 12.1.3.4. SWOT Analysis
- 12.1.4 Panasonic Energy India Co Ltd
- 12.1.4.1. Company Overview
- 12.1.4.2. Products
- 12.1.4.3. Company Financials
- 12.1.4.4. SWOT Analysis
- 12.1.5 Duracell Inc
- 12.1.5.1. Company Overview
- 12.1.5.2. Products
- 12.1.5.3. Company Financials
- 12.1.5.4. SWOT Analysis
- 12.1.6 GPB International Limited
- 12.1.6.1. Company Overview
- 12.1.6.2. Products
- 12.1.6.3. Company Financials
- 12.1.6.4. SWOT Analysis
- 12.1.7 Geep Industries Pvt Ltd
- 12.1.7.1. Company Overview
- 12.1.7.2. Products
- 12.1.7.3. Company Financials
- 12.1.7.4. SWOT Analysis
- 12.1.8 FUTURISTIC IDC Pvt Ltd
- 12.1.8.1. Company Overview
- 12.1.8.2. Products
- 12.1.8.3. Company Financials
- 12.1.8.4. SWOT Analysis
- 12.1.9 Energizer Holdings
- 12.1.9.1. Company Overview
- 12.1.9.2. Products
- 12.1.9.3. Company Financials
- 12.1.9.4. SWOT Analysis
- 12.1.10 Coslight India
- 12.1.10.1. Company Overview
- 12.1.10.2. Products
- 12.1.10.3. Company Financials
- 12.1.10.4. SWOT Analysis
- 12.1.1 Indo National Limited
- 12.2. Market Entropy
- 12.2.1 Company's Key Areas Served
- 12.2.2 Recent Developments
- 12.3. Company Market Share Analysis 2025
- 12.3.1 Top 5 Companies Market Share Analysis
- 12.3.2 Top 3 Companies Market Share Analysis
- 12.4. List of Potential Customers
- 13. Research Methodology
List of Figures
- Figure 1: Global Alkaline Battery Industry in India Revenue Breakdown (million, %) by Region 2025 & 2033
- Figure 2: Global Alkaline Battery Industry in India Volume Breakdown (K Tons, %) by Region 2025 & 2033
- Figure 3: North America Alkaline Battery Industry in India Revenue (million), by Type 2025 & 2033
- Figure 4: North America Alkaline Battery Industry in India Volume (K Tons), by Type 2025 & 2033
- Figure 5: North America Alkaline Battery Industry in India Revenue Share (%), by Type 2025 & 2033
- Figure 6: North America Alkaline Battery Industry in India Volume Share (%), by Type 2025 & 2033
- Figure 7: North America Alkaline Battery Industry in India Revenue (million), by Application 2025 & 2033
- Figure 8: North America Alkaline Battery Industry in India Volume (K Tons), by Application 2025 & 2033
- Figure 9: North America Alkaline Battery Industry in India Revenue Share (%), by Application 2025 & 2033
- Figure 10: North America Alkaline Battery Industry in India Volume Share (%), by Application 2025 & 2033
- Figure 11: North America Alkaline Battery Industry in India Revenue (million), by Country 2025 & 2033
- Figure 12: North America Alkaline Battery Industry in India Volume (K Tons), by Country 2025 & 2033
- Figure 13: North America Alkaline Battery Industry in India Revenue Share (%), by Country 2025 & 2033
- Figure 14: North America Alkaline Battery Industry in India Volume Share (%), by Country 2025 & 2033
- Figure 15: South America Alkaline Battery Industry in India Revenue (million), by Type 2025 & 2033
- Figure 16: South America Alkaline Battery Industry in India Volume (K Tons), by Type 2025 & 2033
- Figure 17: South America Alkaline Battery Industry in India Revenue Share (%), by Type 2025 & 2033
- Figure 18: South America Alkaline Battery Industry in India Volume Share (%), by Type 2025 & 2033
- Figure 19: South America Alkaline Battery Industry in India Revenue (million), by Application 2025 & 2033
- Figure 20: South America Alkaline Battery Industry in India Volume (K Tons), by Application 2025 & 2033
- Figure 21: South America Alkaline Battery Industry in India Revenue Share (%), by Application 2025 & 2033
- Figure 22: South America Alkaline Battery Industry in India Volume Share (%), by Application 2025 & 2033
- Figure 23: South America Alkaline Battery Industry in India Revenue (million), by Country 2025 & 2033
- Figure 24: South America Alkaline Battery Industry in India Volume (K Tons), by Country 2025 & 2033
- Figure 25: South America Alkaline Battery Industry in India Revenue Share (%), by Country 2025 & 2033
- Figure 26: South America Alkaline Battery Industry in India Volume Share (%), by Country 2025 & 2033
- Figure 27: Europe Alkaline Battery Industry in India Revenue (million), by Type 2025 & 2033
- Figure 28: Europe Alkaline Battery Industry in India Volume (K Tons), by Type 2025 & 2033
- Figure 29: Europe Alkaline Battery Industry in India Revenue Share (%), by Type 2025 & 2033
- Figure 30: Europe Alkaline Battery Industry in India Volume Share (%), by Type 2025 & 2033
- Figure 31: Europe Alkaline Battery Industry in India Revenue (million), by Application 2025 & 2033
- Figure 32: Europe Alkaline Battery Industry in India Volume (K Tons), by Application 2025 & 2033
- Figure 33: Europe Alkaline Battery Industry in India Revenue Share (%), by Application 2025 & 2033
- Figure 34: Europe Alkaline Battery Industry in India Volume Share (%), by Application 2025 & 2033
- Figure 35: Europe Alkaline Battery Industry in India Revenue (million), by Country 2025 & 2033
- Figure 36: Europe Alkaline Battery Industry in India Volume (K Tons), by Country 2025 & 2033
- Figure 37: Europe Alkaline Battery Industry in India Revenue Share (%), by Country 2025 & 2033
- Figure 38: Europe Alkaline Battery Industry in India Volume Share (%), by Country 2025 & 2033
- Figure 39: Middle East & Africa Alkaline Battery Industry in India Revenue (million), by Type 2025 & 2033
- Figure 40: Middle East & Africa Alkaline Battery Industry in India Volume (K Tons), by Type 2025 & 2033
- Figure 41: Middle East & Africa Alkaline Battery Industry in India Revenue Share (%), by Type 2025 & 2033
- Figure 42: Middle East & Africa Alkaline Battery Industry in India Volume Share (%), by Type 2025 & 2033
- Figure 43: Middle East & Africa Alkaline Battery Industry in India Revenue (million), by Application 2025 & 2033
- Figure 44: Middle East & Africa Alkaline Battery Industry in India Volume (K Tons), by Application 2025 & 2033
- Figure 45: Middle East & Africa Alkaline Battery Industry in India Revenue Share (%), by Application 2025 & 2033
- Figure 46: Middle East & Africa Alkaline Battery Industry in India Volume Share (%), by Application 2025 & 2033
- Figure 47: Middle East & Africa Alkaline Battery Industry in India Revenue (million), by Country 2025 & 2033
- Figure 48: Middle East & Africa Alkaline Battery Industry in India Volume (K Tons), by Country 2025 & 2033
- Figure 49: Middle East & Africa Alkaline Battery Industry in India Revenue Share (%), by Country 2025 & 2033
- Figure 50: Middle East & Africa Alkaline Battery Industry in India Volume Share (%), by Country 2025 & 2033
- Figure 51: Asia Pacific Alkaline Battery Industry in India Revenue (million), by Type 2025 & 2033
- Figure 52: Asia Pacific Alkaline Battery Industry in India Volume (K Tons), by Type 2025 & 2033
- Figure 53: Asia Pacific Alkaline Battery Industry in India Revenue Share (%), by Type 2025 & 2033
- Figure 54: Asia Pacific Alkaline Battery Industry in India Volume Share (%), by Type 2025 & 2033
- Figure 55: Asia Pacific Alkaline Battery Industry in India Revenue (million), by Application 2025 & 2033
- Figure 56: Asia Pacific Alkaline Battery Industry in India Volume (K Tons), by Application 2025 & 2033
- Figure 57: Asia Pacific Alkaline Battery Industry in India Revenue Share (%), by Application 2025 & 2033
- Figure 58: Asia Pacific Alkaline Battery Industry in India Volume Share (%), by Application 2025 & 2033
- Figure 59: Asia Pacific Alkaline Battery Industry in India Revenue (million), by Country 2025 & 2033
- Figure 60: Asia Pacific Alkaline Battery Industry in India Volume (K Tons), by Country 2025 & 2033
- Figure 61: Asia Pacific Alkaline Battery Industry in India Revenue Share (%), by Country 2025 & 2033
- Figure 62: Asia Pacific Alkaline Battery Industry in India Volume Share (%), by Country 2025 & 2033
List of Tables
- Table 1: Global Alkaline Battery Industry in India Revenue million Forecast, by Type 2020 & 2033
- Table 2: Global Alkaline Battery Industry in India Volume K Tons Forecast, by Type 2020 & 2033
- Table 3: Global Alkaline Battery Industry in India Revenue million Forecast, by Application 2020 & 2033
- Table 4: Global Alkaline Battery Industry in India Volume K Tons Forecast, by Application 2020 & 2033
- Table 5: Global Alkaline Battery Industry in India Revenue million Forecast, by Region 2020 & 2033
- Table 6: Global Alkaline Battery Industry in India Volume K Tons Forecast, by Region 2020 & 2033
- Table 7: Global Alkaline Battery Industry in India Revenue million Forecast, by Type 2020 & 2033
- Table 8: Global Alkaline Battery Industry in India Volume K Tons Forecast, by Type 2020 & 2033
- Table 9: Global Alkaline Battery Industry in India Revenue million Forecast, by Application 2020 & 2033
- Table 10: Global Alkaline Battery Industry in India Volume K Tons Forecast, by Application 2020 & 2033
- Table 11: Global Alkaline Battery Industry in India Revenue million Forecast, by Country 2020 & 2033
- Table 12: Global Alkaline Battery Industry in India Volume K Tons Forecast, by Country 2020 & 2033
- Table 13: United States Alkaline Battery Industry in India Revenue (million) Forecast, by Application 2020 & 2033
- Table 14: United States Alkaline Battery Industry in India Volume (K Tons) Forecast, by Application 2020 & 2033
- Table 15: Canada Alkaline Battery Industry in India Revenue (million) Forecast, by Application 2020 & 2033
- Table 16: Canada Alkaline Battery Industry in India Volume (K Tons) Forecast, by Application 2020 & 2033
- Table 17: Mexico Alkaline Battery Industry in India Revenue (million) Forecast, by Application 2020 & 2033
- Table 18: Mexico Alkaline Battery Industry in India Volume (K Tons) Forecast, by Application 2020 & 2033
- Table 19: Global Alkaline Battery Industry in India Revenue million Forecast, by Type 2020 & 2033
- Table 20: Global Alkaline Battery Industry in India Volume K Tons Forecast, by Type 2020 & 2033
- Table 21: Global Alkaline Battery Industry in India Revenue million Forecast, by Application 2020 & 2033
- Table 22: Global Alkaline Battery Industry in India Volume K Tons Forecast, by Application 2020 & 2033
- Table 23: Global Alkaline Battery Industry in India Revenue million Forecast, by Country 2020 & 2033
- Table 24: Global Alkaline Battery Industry in India Volume K Tons Forecast, by Country 2020 & 2033
- Table 25: Brazil Alkaline Battery Industry in India Revenue (million) Forecast, by Application 2020 & 2033
- Table 26: Brazil Alkaline Battery Industry in India Volume (K Tons) Forecast, by Application 2020 & 2033
- Table 27: Argentina Alkaline Battery Industry in India Revenue (million) Forecast, by Application 2020 & 2033
- Table 28: Argentina Alkaline Battery Industry in India Volume (K Tons) Forecast, by Application 2020 & 2033
- Table 29: Rest of South America Alkaline Battery Industry in India Revenue (million) Forecast, by Application 2020 & 2033
- Table 30: Rest of South America Alkaline Battery Industry in India Volume (K Tons) Forecast, by Application 2020 & 2033
- Table 31: Global Alkaline Battery Industry in India Revenue million Forecast, by Type 2020 & 2033
- Table 32: Global Alkaline Battery Industry in India Volume K Tons Forecast, by Type 2020 & 2033
- Table 33: Global Alkaline Battery Industry in India Revenue million Forecast, by Application 2020 & 2033
- Table 34: Global Alkaline Battery Industry in India Volume K Tons Forecast, by Application 2020 & 2033
- Table 35: Global Alkaline Battery Industry in India Revenue million Forecast, by Country 2020 & 2033
- Table 36: Global Alkaline Battery Industry in India Volume K Tons Forecast, by Country 2020 & 2033
- Table 37: United Kingdom Alkaline Battery Industry in India Revenue (million) Forecast, by Application 2020 & 2033
- Table 38: United Kingdom Alkaline Battery Industry in India Volume (K Tons) Forecast, by Application 2020 & 2033
- Table 39: Germany Alkaline Battery Industry in India Revenue (million) Forecast, by Application 2020 & 2033
- Table 40: Germany Alkaline Battery Industry in India Volume (K Tons) Forecast, by Application 2020 & 2033
- Table 41: France Alkaline Battery Industry in India Revenue (million) Forecast, by Application 2020 & 2033
- Table 42: France Alkaline Battery Industry in India Volume (K Tons) Forecast, by Application 2020 & 2033
- Table 43: Italy Alkaline Battery Industry in India Revenue (million) Forecast, by Application 2020 & 2033
- Table 44: Italy Alkaline Battery Industry in India Volume (K Tons) Forecast, by Application 2020 & 2033
- Table 45: Spain Alkaline Battery Industry in India Revenue (million) Forecast, by Application 2020 & 2033
- Table 46: Spain Alkaline Battery Industry in India Volume (K Tons) Forecast, by Application 2020 & 2033
- Table 47: Russia Alkaline Battery Industry in India Revenue (million) Forecast, by Application 2020 & 2033
- Table 48: Russia Alkaline Battery Industry in India Volume (K Tons) Forecast, by Application 2020 & 2033
- Table 49: Benelux Alkaline Battery Industry in India Revenue (million) Forecast, by Application 2020 & 2033
- Table 50: Benelux Alkaline Battery Industry in India Volume (K Tons) Forecast, by Application 2020 & 2033
- Table 51: Nordics Alkaline Battery Industry in India Revenue (million) Forecast, by Application 2020 & 2033
- Table 52: Nordics Alkaline Battery Industry in India Volume (K Tons) Forecast, by Application 2020 & 2033
- Table 53: Rest of Europe Alkaline Battery Industry in India Revenue (million) Forecast, by Application 2020 & 2033
- Table 54: Rest of Europe Alkaline Battery Industry in India Volume (K Tons) Forecast, by Application 2020 & 2033
- Table 55: Global Alkaline Battery Industry in India Revenue million Forecast, by Type 2020 & 2033
- Table 56: Global Alkaline Battery Industry in India Volume K Tons Forecast, by Type 2020 & 2033
- Table 57: Global Alkaline Battery Industry in India Revenue million Forecast, by Application 2020 & 2033
- Table 58: Global Alkaline Battery Industry in India Volume K Tons Forecast, by Application 2020 & 2033
- Table 59: Global Alkaline Battery Industry in India Revenue million Forecast, by Country 2020 & 2033
- Table 60: Global Alkaline Battery Industry in India Volume K Tons Forecast, by Country 2020 & 2033
- Table 61: Turkey Alkaline Battery Industry in India Revenue (million) Forecast, by Application 2020 & 2033
- Table 62: Turkey Alkaline Battery Industry in India Volume (K Tons) Forecast, by Application 2020 & 2033
- Table 63: Israel Alkaline Battery Industry in India Revenue (million) Forecast, by Application 2020 & 2033
- Table 64: Israel Alkaline Battery Industry in India Volume (K Tons) Forecast, by Application 2020 & 2033
- Table 65: GCC Alkaline Battery Industry in India Revenue (million) Forecast, by Application 2020 & 2033
- Table 66: GCC Alkaline Battery Industry in India Volume (K Tons) Forecast, by Application 2020 & 2033
- Table 67: North Africa Alkaline Battery Industry in India Revenue (million) Forecast, by Application 2020 & 2033
- Table 68: North Africa Alkaline Battery Industry in India Volume (K Tons) Forecast, by Application 2020 & 2033
- Table 69: South Africa Alkaline Battery Industry in India Revenue (million) Forecast, by Application 2020 & 2033
- Table 70: South Africa Alkaline Battery Industry in India Volume (K Tons) Forecast, by Application 2020 & 2033
- Table 71: Rest of Middle East & Africa Alkaline Battery Industry in India Revenue (million) Forecast, by Application 2020 & 2033
- Table 72: Rest of Middle East & Africa Alkaline Battery Industry in India Volume (K Tons) Forecast, by Application 2020 & 2033
- Table 73: Global Alkaline Battery Industry in India Revenue million Forecast, by Type 2020 & 2033
- Table 74: Global Alkaline Battery Industry in India Volume K Tons Forecast, by Type 2020 & 2033
- Table 75: Global Alkaline Battery Industry in India Revenue million Forecast, by Application 2020 & 2033
- Table 76: Global Alkaline Battery Industry in India Volume K Tons Forecast, by Application 2020 & 2033
- Table 77: Global Alkaline Battery Industry in India Revenue million Forecast, by Country 2020 & 2033
- Table 78: Global Alkaline Battery Industry in India Volume K Tons Forecast, by Country 2020 & 2033
- Table 79: China Alkaline Battery Industry in India Revenue (million) Forecast, by Application 2020 & 2033
- Table 80: China Alkaline Battery Industry in India Volume (K Tons) Forecast, by Application 2020 & 2033
- Table 81: India Alkaline Battery Industry in India Revenue (million) Forecast, by Application 2020 & 2033
- Table 82: India Alkaline Battery Industry in India Volume (K Tons) Forecast, by Application 2020 & 2033
- Table 83: Japan Alkaline Battery Industry in India Revenue (million) Forecast, by Application 2020 & 2033
- Table 84: Japan Alkaline Battery Industry in India Volume (K Tons) Forecast, by Application 2020 & 2033
- Table 85: South Korea Alkaline Battery Industry in India Revenue (million) Forecast, by Application 2020 & 2033
- Table 86: South Korea Alkaline Battery Industry in India Volume (K Tons) Forecast, by Application 2020 & 2033
- Table 87: ASEAN Alkaline Battery Industry in India Revenue (million) Forecast, by Application 2020 & 2033
- Table 88: ASEAN Alkaline Battery Industry in India Volume (K Tons) Forecast, by Application 2020 & 2033
- Table 89: Oceania Alkaline Battery Industry in India Revenue (million) Forecast, by Application 2020 & 2033
- Table 90: Oceania Alkaline Battery Industry in India Volume (K Tons) Forecast, by Application 2020 & 2033
- Table 91: Rest of Asia Pacific Alkaline Battery Industry in India Revenue (million) Forecast, by Application 2020 & 2033
- Table 92: Rest of Asia Pacific Alkaline Battery Industry in India Volume (K Tons) Forecast, by Application 2020 & 2033
Frequently Asked Questions
1. What is the projected Compound Annual Growth Rate (CAGR) of the Alkaline Battery Industry in India?
The projected CAGR is approximately 6.89%.
2. Which companies are prominent players in the Alkaline Battery Industry in India?
Key companies in the market include Indo National Limited, Eveready Industries India Ltd, Sony Group Corporation*List Not Exhaustive, Panasonic Energy India Co Ltd, Duracell Inc, GPB International Limited, Geep Industries Pvt Ltd, FUTURISTIC IDC Pvt Ltd, Energizer Holdings , Coslight India.
3. What are the main segments of the Alkaline Battery Industry in India?
The market segments include Type, Application.
4. Can you provide details about the market size?
The market size is estimated to be USD 910 million as of 2022.
5. What are some drivers contributing to market growth?
4.; Increasing Investments in Water Treatment by Developing Countries4.; Growing Demand for the Various End-Use Sectors.
6. What are the notable trends driving market growth?
Primary Segment is Expected to Dominate the Market.
7. Are there any restraints impacting market growth?
4.; Availability of Cheap and Alternative Pumps.
8. Can you provide examples of recent developments in the market?
In March 2020, the Ministry of Environment, Forest, and Climate Change (MoEFCC) issued a draft notification for battery waste management. The regulations will apply to all types of batteries, regardless of their shape, volume, weight, material, and composition, or use.
9. What pricing options are available for accessing the report?
Pricing options include single-user, multi-user, and enterprise licenses priced at USD 3800, USD 4500, and USD 5800 respectively.
10. Is the market size provided in terms of value or volume?
The market size is provided in terms of value, measured in million and volume, measured in K Tons.
11. Are there any specific market keywords associated with the report?
Yes, the market keyword associated with the report is "Alkaline Battery Industry in India," which aids in identifying and referencing the specific market segment covered.
12. How do I determine which pricing option suits my needs best?
The pricing options vary based on user requirements and access needs. Individual users may opt for single-user licenses, while businesses requiring broader access may choose multi-user or enterprise licenses for cost-effective access to the report.
13. Are there any additional resources or data provided in the Alkaline Battery Industry in India report?
While the report offers comprehensive insights, it's advisable to review the specific contents or supplementary materials provided to ascertain if additional resources or data are available.
14. How can I stay updated on further developments or reports in the Alkaline Battery Industry in India?
To stay informed about further developments, trends, and reports in the Alkaline Battery Industry in India, consider subscribing to industry newsletters, following relevant companies and organizations, or regularly checking reputable industry news sources and publications.
Methodology
Step 1 - Identification of Relevant Samples Size from Population Database


Step 2 - Approaches for Defining Global Market Size (Value, Volume* & Price*)

Note*: In applicable scenarios
Step 3 - Data Sources
Primary Research
- Web Analytics
- Survey Reports
- Research Institute
- Latest Research Reports
- Opinion Leaders
Secondary Research
- Annual Reports
- White Paper
- Latest Press Release
- Industry Association
- Paid Database
- Investor Presentations

Step 4 - Data Triangulation
Involves using different sources of information in order to increase the validity of a study
These sources are likely to be stakeholders in a program - participants, other researchers, program staff, other community members, and so on.
Then we put all data in single framework & apply various statistical tools to find out the dynamic on the market.
During the analysis stage, feedback from the stakeholder groups would be compared to determine areas of agreement as well as areas of divergence