

Key Insights
The global alcoholic drinks packaging market, valued at approximately $168.08 billion in 2025, is projected for robust expansion, forecasting a compound annual growth rate (CAGR) of 5.05% from 2025 to 2033. This growth trajectory is propelled by increasing demand for convenient and portable alcoholic beverages, driving innovation in packaging solutions like lightweight pouches and resealable cans. Growing consumer emphasis on sustainability is further accelerating the adoption of eco-friendly materials, including recycled paper and plastics. The premiumization trend within the alcoholic beverage sector, characterized by a consumer preference for high-quality and visually appealing products, also contributes significantly, as sophisticated packaging enhances brand perception and shelf presence. Despite challenges posed by fluctuating raw material costs and stringent disposal regulations, the market outlook remains optimistic. Segmentation by package type (bottles, cans, cartons, jars, pouches), product type (beer, spirits, wine), and material type (plastic, paper, metal, glass) presents diverse growth avenues. While North America and Europe currently lead, the Asia Pacific region is poised for substantial growth, fueled by rising disposable incomes and evolving consumption habits.
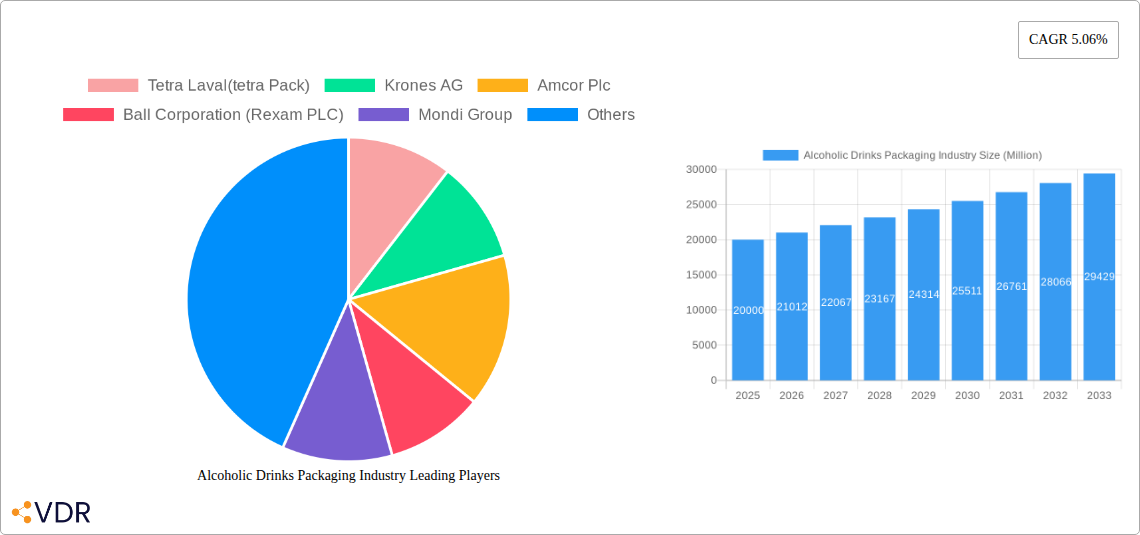
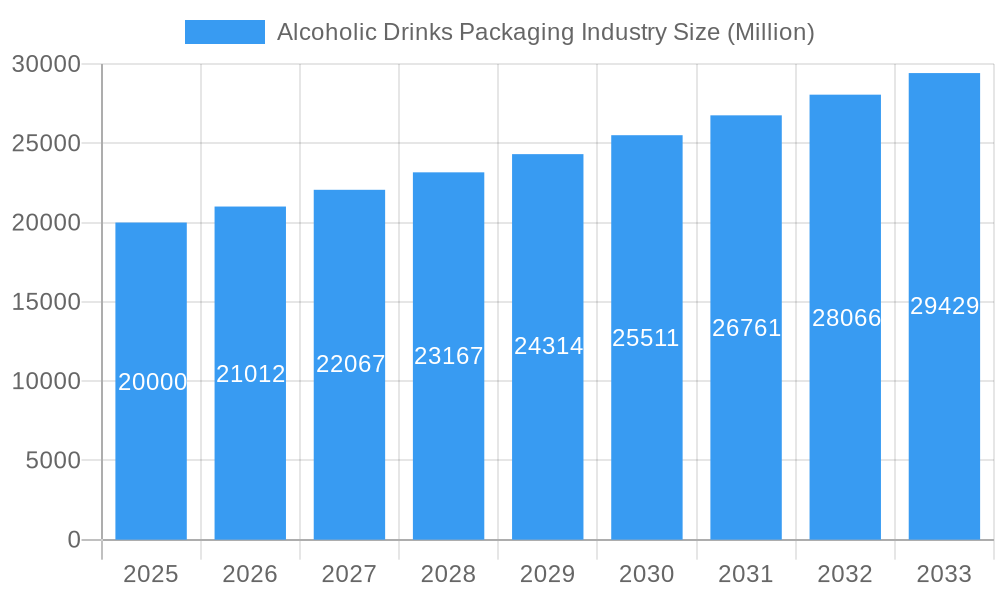
Alcoholic Drinks Packaging Industry Market Size (In Billion)
The competitive arena features a mix of multinational corporations and specialized firms. Key industry players, including Tetra Laval, Krones AG, Amcor Plc, Ball Corporation, Mondi Group, Saint Gobain SA, Sidel Inc, and Crown Holdings Incorporated, are committed to advancing packaging technologies and meeting the dynamic needs of the beverage industry. Their strategies involve mergers, acquisitions, capacity expansions, and strategic alliances to secure market share and broaden their geographical reach. Future expansion will be shaped by advancements in packaging materials, a heightened focus on sustainability, and adaptability to evolving consumer preferences for convenience, aesthetics, and environmental responsibility. The ongoing trend toward personalized and customized packaging is anticipated to further stimulate market growth in the upcoming years.
Alcoholic Drinks Packaging Industry Company Market Share
Alcoholic Drinks Packaging Industry: A Comprehensive Market Report (2019-2033)
This comprehensive report provides an in-depth analysis of the Alcoholic Drinks Packaging Industry, offering valuable insights into market dynamics, growth trends, and future opportunities. The study covers the period from 2019 to 2033, with 2025 as the base year and a forecast period extending to 2033. The report segments the market by package type (bottles, metal cans, cartons, jars, pouches, other), product (beer, spirits, wine, other), and material (plastic, paper, metal, glass, other). Key players analyzed include Tetra Laval (Tetra Pak), Krones AG, Amcor Plc, Ball Corporation (Rexam PLC), Mondi Group, Saint Gobain SA, Sidel Inc., Crown Holdings Incorporated, and others. The total market size is projected to reach xx Million units by 2033.
Alcoholic Drinks Packaging Industry Market Dynamics & Structure
The alcoholic drinks packaging market is characterized by moderate concentration, with several large multinational companies holding significant market share. Technological innovation, driven by sustainability concerns and consumer demand for enhanced convenience, plays a crucial role. Stringent regulatory frameworks regarding material safety and labeling influence packaging choices. Competition from alternative packaging solutions and substitution effects from changing consumer preferences are significant factors. Market consolidation through mergers and acquisitions (M&A) is observed, with a total of xx M&A deals recorded between 2019 and 2024.
- Market Concentration: High (xx%), with top 5 players accounting for approximately xx% of the market share in 2024.
- Technological Innovation: Focus on lightweighting, sustainable materials (e.g., recycled content), and improved barrier properties.
- Regulatory Framework: Compliance with food safety regulations and labeling requirements varies across regions.
- Competitive Substitutes: Growing competition from flexible packaging solutions and alternative closure systems.
- End-User Demographics: Shifting consumer preferences towards premiumization and convenience are shaping packaging trends.
- M&A Trends: Consolidation among packaging manufacturers to achieve economies of scale and expand product portfolios.
Alcoholic Drinks Packaging Industry Growth Trends & Insights
The alcoholic drinks packaging market experienced a CAGR of xx% during the historical period (2019-2024). This growth is primarily fueled by the increasing demand for alcoholic beverages globally, coupled with technological advancements in packaging materials and designs. Adoption of sustainable packaging solutions is rising steadily, driven by consumer awareness and regulatory pressures. Technological disruptions, such as the introduction of smart packaging and improved printing techniques, are enhancing product appeal and brand visibility. Shifting consumer preferences towards convenience, portability, and premiumization are impacting packaging choices, leading to increased demand for innovative packaging formats. The market is expected to maintain a healthy growth trajectory with a projected CAGR of xx% from 2025 to 2033, reaching xx Million units by 2033. Market penetration of sustainable packaging is estimated at xx% in 2025, projected to increase to xx% by 2033.
Dominant Regions, Countries, or Segments in Alcoholic Drinks Packaging Industry
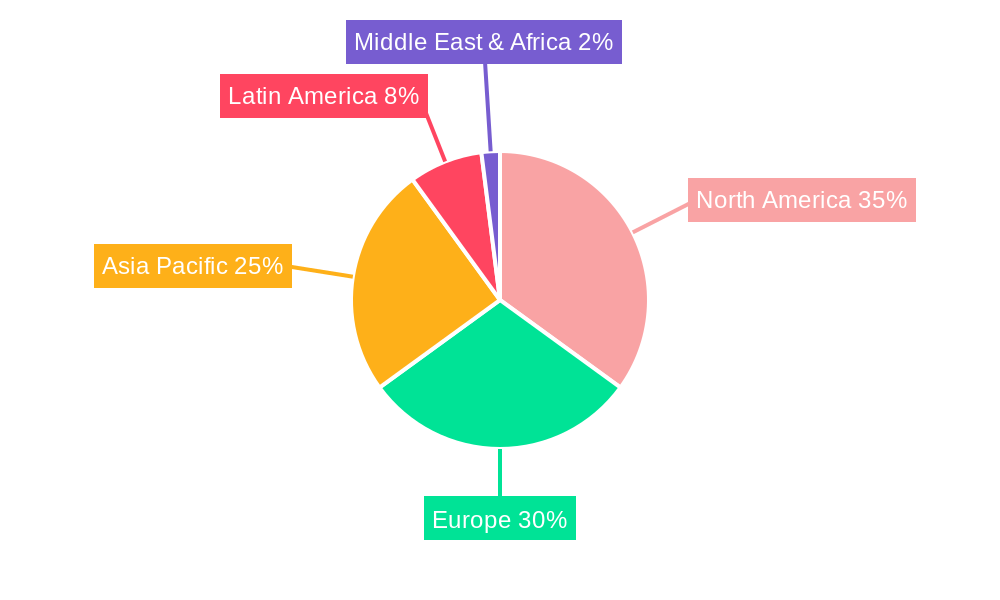
North America and Europe currently hold the largest market share within the alcoholic drinks packaging industry, driven by established alcoholic beverage markets and high consumer spending. However, the Asia-Pacific region is anticipated to exhibit the fastest growth rate over the forecast period, fueled by rising disposable incomes and increasing consumption of alcoholic beverages in developing economies. Within segments, bottles remain the dominant package type globally, although metal cans are experiencing robust growth, particularly in the beer segment.
- Leading Region: North America (xx% market share in 2025)
- Fastest-Growing Region: Asia-Pacific (projected CAGR of xx% from 2025-2033)
- Dominant Package Type: Bottles (xx Million units in 2025)
- Fastest-Growing Package Type: Metal Cans (projected CAGR of xx% from 2025-2033)
- Key Drivers: Rising disposable incomes, urbanization, changing lifestyles, and favorable government policies.
Alcoholic Drinks Packaging Industry Product Landscape
The alcoholic drinks packaging market showcases a wide array of innovative products, including lightweight bottles, recyclable cans with improved barrier properties, and sustainable cartons with enhanced printing capabilities. These innovations address consumer demands for convenience, sustainability, and aesthetic appeal. Unique selling propositions include improved tamper evidence, enhanced shelf life, and reduced environmental impact. Technological advancements include the integration of smart packaging features (e.g., NFC tags) and the development of bio-based materials.
Key Drivers, Barriers & Challenges in Alcoholic Drinks Packaging Industry
Key Drivers: Growing demand for alcoholic beverages, increasing consumer preference for convenient and sustainable packaging, technological innovations in materials and manufacturing processes, and supportive government policies promoting sustainability.
Challenges: Fluctuating raw material prices, stringent environmental regulations, intense competition among packaging manufacturers, and potential supply chain disruptions. The impact of these challenges is estimated to reduce the market growth by approximately xx% during the forecast period.
Emerging Opportunities in Alcoholic Drinks Packaging Industry
Untapped markets in developing economies, the growing demand for premium and personalized packaging, and the increasing focus on sustainable and eco-friendly packaging options present significant opportunities. Innovation in package design, incorporating functionalities like resealable closures and integrated dispensing systems, also offers potential for growth.
Growth Accelerators in the Alcoholic Drinks Packaging Industry
Technological breakthroughs in material science and manufacturing processes, coupled with strategic partnerships between packaging manufacturers and alcoholic beverage companies, are key growth catalysts. Market expansion into emerging economies, leveraging favorable demographic trends and increasing consumer spending, will also contribute to long-term growth.
Key Players Shaping the Alcoholic Drinks Packaging Industry Market
- Tetra Laval (Tetra Pak)
- Krones AG
- Amcor Plc
- Ball Corporation (Rexam PLC)
- Mondi Group
- Saint Gobain SA
- Sidel Inc.
- Crown Holdings Incorporated
Notable Milestones in Alcoholic Drinks Packaging Industry Sector
- 2020: Amcor Plc launches a new range of sustainable packaging solutions for wine bottles.
- 2021: Ball Corporation invests in advanced recycling technologies for aluminum cans.
- 2022: Tetra Pak introduces a new carton design with improved barrier properties.
- 2023: Several key players announce strategic partnerships to develop innovative packaging solutions.
- 2024: Increased regulatory pressure on plastic packaging leads to a shift towards sustainable alternatives.
In-Depth Alcoholic Drinks Packaging Industry Market Outlook
The alcoholic drinks packaging market is poised for substantial growth driven by technological advancements, sustainable practices, and evolving consumer preferences. Strategic partnerships and investments in research and development will be crucial for maintaining market competitiveness. The focus on sustainability and the expansion into untapped markets will be key determinants of long-term success in the industry. The overall outlook is positive, with opportunities for significant expansion in both developed and emerging markets.
Alcoholic Drinks Packaging Industry Segmentation
-
1. Material
- 1.1. Plastic
- 1.2. Paper
- 1.3. Metal
- 1.4. Glass
- 1.5. Other Materials
-
2. Package Type
- 2.1. Bottles
- 2.2. Metal Cans
- 2.3. Cartons
- 2.4. Jars
- 2.5. Pouches
- 2.6. Other Package Types
-
3. Product
- 3.1. Beer
- 3.2. Spirit
- 3.3. Wine
- 3.4. Other Products
Alcoholic Drinks Packaging Industry Segmentation By Geography
-
1. North America
- 1.1. United States
- 1.2. Canada
-
2. Europe
- 2.1. Germany
- 2.2. United Kingdom
- 2.3. France
- 2.4. Rest of Europe
-
3. Asia Pacific
- 3.1. China
- 3.2. Japan
- 3.3. India
- 3.4. Rest of Asia Pacific
-
4. Latin America
- 4.1. Brazil
- 4.2. Argentina
- 4.3. Mexico
- 4.4. Rest of Latin America
- 5. Middle East
-
6. UAE
- 6.1. South Africa
- 6.2. Rest of Middle East
Alcoholic Drinks Packaging Industry Regional Market Share
Geographic Coverage of Alcoholic Drinks Packaging Industry
Alcoholic Drinks Packaging Industry REPORT HIGHLIGHTS
| Aspects | Details |
|---|---|
| Study Period | 2020-2034 |
| Base Year | 2025 |
| Estimated Year | 2026 |
| Forecast Period | 2026-2034 |
| Historical Period | 2020-2025 |
| Growth Rate | CAGR of 5.05% from 2020-2034 |
| Segmentation |
|
Table of Contents
- 1. Introduction
- 1.1. Research Scope
- 1.2. Market Segmentation
- 1.3. Research Objective
- 1.4. Definitions and Assumptions
- 2. Executive Summary
- 2.1. Market Snapshot
- 3. Market Dynamics
- 3.1. Market Drivers
- 3.2. Market Restrains
- 3.3. Market Trends
- 3.4. Market Opportunities
- 4. Market Factor Analysis
- 4.1. Porters Five Forces
- 4.1.1. Bargaining Power of Suppliers
- 4.1.2. Bargaining Power of Buyers
- 4.1.3. Threat of New Entrants
- 4.1.4. Threat of Substitutes
- 4.1.5. Competitive Rivalry
- 4.2. PESTEL analysis
- 4.3. BCG Analysis
- 4.3.1. Stars (High Growth, High Market Share)
- 4.3.2. Cash Cows (Low Growth, High Market Share)
- 4.3.3. Question Mark (High Growth, Low Market Share)
- 4.3.4. Dogs (Low Growth, Low Market Share)
- 4.4. Ansoff Matrix Analysis
- 4.5. Supply Chain Analysis
- 4.6. Regulatory Landscape
- 4.7. Current Market Potential and Opportunity Assessment (TAM–SAM–SOM Framework)
- 4.8. VDR Analyst Note
- 4.1. Porters Five Forces
- 5. Market Analysis, Insights and Forecast 2021-2033
- 5.1. Market Analysis, Insights and Forecast - by Material
- 5.1.1. Plastic
- 5.1.2. Paper
- 5.1.3. Metal
- 5.1.4. Glass
- 5.1.5. Other Materials
- 5.2. Market Analysis, Insights and Forecast - by Package Type
- 5.2.1. Bottles
- 5.2.2. Metal Cans
- 5.2.3. Cartons
- 5.2.4. Jars
- 5.2.5. Pouches
- 5.2.6. Other Package Types
- 5.3. Market Analysis, Insights and Forecast - by Product
- 5.3.1. Beer
- 5.3.2. Spirit
- 5.3.3. Wine
- 5.3.4. Other Products
- 5.4. Market Analysis, Insights and Forecast - by Region
- 5.4.1. North America
- 5.4.2. Europe
- 5.4.3. Asia Pacific
- 5.4.4. Latin America
- 5.4.5. Middle East
- 5.4.6. UAE
- 5.1. Market Analysis, Insights and Forecast - by Material
- 6. Global Alcoholic Drinks Packaging Industry Analysis, Insights and Forecast, 2021-2033
- 6.1. Market Analysis, Insights and Forecast - by Material
- 6.1.1. Plastic
- 6.1.2. Paper
- 6.1.3. Metal
- 6.1.4. Glass
- 6.1.5. Other Materials
- 6.2. Market Analysis, Insights and Forecast - by Package Type
- 6.2.1. Bottles
- 6.2.2. Metal Cans
- 6.2.3. Cartons
- 6.2.4. Jars
- 6.2.5. Pouches
- 6.2.6. Other Package Types
- 6.3. Market Analysis, Insights and Forecast - by Product
- 6.3.1. Beer
- 6.3.2. Spirit
- 6.3.3. Wine
- 6.3.4. Other Products
- 6.1. Market Analysis, Insights and Forecast - by Material
- 7. North America Alcoholic Drinks Packaging Industry Analysis, Insights and Forecast, 2021-2033
- 7.1. Market Analysis, Insights and Forecast - by Material
- 7.1.1. Plastic
- 7.1.2. Paper
- 7.1.3. Metal
- 7.1.4. Glass
- 7.1.5. Other Materials
- 7.2. Market Analysis, Insights and Forecast - by Package Type
- 7.2.1. Bottles
- 7.2.2. Metal Cans
- 7.2.3. Cartons
- 7.2.4. Jars
- 7.2.5. Pouches
- 7.2.6. Other Package Types
- 7.3. Market Analysis, Insights and Forecast - by Product
- 7.3.1. Beer
- 7.3.2. Spirit
- 7.3.3. Wine
- 7.3.4. Other Products
- 7.1. Market Analysis, Insights and Forecast - by Material
- 8. Europe Alcoholic Drinks Packaging Industry Analysis, Insights and Forecast, 2021-2033
- 8.1. Market Analysis, Insights and Forecast - by Material
- 8.1.1. Plastic
- 8.1.2. Paper
- 8.1.3. Metal
- 8.1.4. Glass
- 8.1.5. Other Materials
- 8.2. Market Analysis, Insights and Forecast - by Package Type
- 8.2.1. Bottles
- 8.2.2. Metal Cans
- 8.2.3. Cartons
- 8.2.4. Jars
- 8.2.5. Pouches
- 8.2.6. Other Package Types
- 8.3. Market Analysis, Insights and Forecast - by Product
- 8.3.1. Beer
- 8.3.2. Spirit
- 8.3.3. Wine
- 8.3.4. Other Products
- 8.1. Market Analysis, Insights and Forecast - by Material
- 9. Asia Pacific Alcoholic Drinks Packaging Industry Analysis, Insights and Forecast, 2021-2033
- 9.1. Market Analysis, Insights and Forecast - by Material
- 9.1.1. Plastic
- 9.1.2. Paper
- 9.1.3. Metal
- 9.1.4. Glass
- 9.1.5. Other Materials
- 9.2. Market Analysis, Insights and Forecast - by Package Type
- 9.2.1. Bottles
- 9.2.2. Metal Cans
- 9.2.3. Cartons
- 9.2.4. Jars
- 9.2.5. Pouches
- 9.2.6. Other Package Types
- 9.3. Market Analysis, Insights and Forecast - by Product
- 9.3.1. Beer
- 9.3.2. Spirit
- 9.3.3. Wine
- 9.3.4. Other Products
- 9.1. Market Analysis, Insights and Forecast - by Material
- 10. Latin America Alcoholic Drinks Packaging Industry Analysis, Insights and Forecast, 2021-2033
- 10.1. Market Analysis, Insights and Forecast - by Material
- 10.1.1. Plastic
- 10.1.2. Paper
- 10.1.3. Metal
- 10.1.4. Glass
- 10.1.5. Other Materials
- 10.2. Market Analysis, Insights and Forecast - by Package Type
- 10.2.1. Bottles
- 10.2.2. Metal Cans
- 10.2.3. Cartons
- 10.2.4. Jars
- 10.2.5. Pouches
- 10.2.6. Other Package Types
- 10.3. Market Analysis, Insights and Forecast - by Product
- 10.3.1. Beer
- 10.3.2. Spirit
- 10.3.3. Wine
- 10.3.4. Other Products
- 10.1. Market Analysis, Insights and Forecast - by Material
- 11. Middle East Alcoholic Drinks Packaging Industry Analysis, Insights and Forecast, 2021-2033
- 11.1. Market Analysis, Insights and Forecast - by Material
- 11.1.1. Plastic
- 11.1.2. Paper
- 11.1.3. Metal
- 11.1.4. Glass
- 11.1.5. Other Materials
- 11.2. Market Analysis, Insights and Forecast - by Package Type
- 11.2.1. Bottles
- 11.2.2. Metal Cans
- 11.2.3. Cartons
- 11.2.4. Jars
- 11.2.5. Pouches
- 11.2.6. Other Package Types
- 11.3. Market Analysis, Insights and Forecast - by Product
- 11.3.1. Beer
- 11.3.2. Spirit
- 11.3.3. Wine
- 11.3.4. Other Products
- 11.1. Market Analysis, Insights and Forecast - by Material
- 12. UAE Alcoholic Drinks Packaging Industry Analysis, Insights and Forecast, 2021-2033
- 12.1. Market Analysis, Insights and Forecast - by Material
- 12.1.1. Plastic
- 12.1.2. Paper
- 12.1.3. Metal
- 12.1.4. Glass
- 12.1.5. Other Materials
- 12.2. Market Analysis, Insights and Forecast - by Package Type
- 12.2.1. Bottles
- 12.2.2. Metal Cans
- 12.2.3. Cartons
- 12.2.4. Jars
- 12.2.5. Pouches
- 12.2.6. Other Package Types
- 12.3. Market Analysis, Insights and Forecast - by Product
- 12.3.1. Beer
- 12.3.2. Spirit
- 12.3.3. Wine
- 12.3.4. Other Products
- 12.1. Market Analysis, Insights and Forecast - by Material
- 13. Competitive Analysis
- 13.1. Company Profiles
- 13.1.1 Tetra Laval(tetra Pack)
- 13.1.1.1. Company Overview
- 13.1.1.2. Products
- 13.1.1.3. Company Financials
- 13.1.1.4. SWOT Analysis
- 13.1.2 Krones AG
- 13.1.2.1. Company Overview
- 13.1.2.2. Products
- 13.1.2.3. Company Financials
- 13.1.2.4. SWOT Analysis
- 13.1.3 Amcor Plc
- 13.1.3.1. Company Overview
- 13.1.3.2. Products
- 13.1.3.3. Company Financials
- 13.1.3.4. SWOT Analysis
- 13.1.4 Ball Corporation (Rexam PLC)
- 13.1.4.1. Company Overview
- 13.1.4.2. Products
- 13.1.4.3. Company Financials
- 13.1.4.4. SWOT Analysis
- 13.1.5 Mondi Group
- 13.1.5.1. Company Overview
- 13.1.5.2. Products
- 13.1.5.3. Company Financials
- 13.1.5.4. SWOT Analysis
- 13.1.6 Saint Gobain SA
- 13.1.6.1. Company Overview
- 13.1.6.2. Products
- 13.1.6.3. Company Financials
- 13.1.6.4. SWOT Analysis
- 13.1.7 Sidel Inc *List Not Exhaustive
- 13.1.7.1. Company Overview
- 13.1.7.2. Products
- 13.1.7.3. Company Financials
- 13.1.7.4. SWOT Analysis
- 13.1.8 Crown Holdings Incorporated
- 13.1.8.1. Company Overview
- 13.1.8.2. Products
- 13.1.8.3. Company Financials
- 13.1.8.4. SWOT Analysis
- 13.1.1 Tetra Laval(tetra Pack)
- 13.2. Market Entropy
- 13.2.1 Company's Key Areas Served
- 13.2.2 Recent Developments
- 13.3. Company Market Share Analysis 2025
- 13.3.1 Top 5 Companies Market Share Analysis
- 13.3.2 Top 3 Companies Market Share Analysis
- 13.4. List of Potential Customers
- 14. Research Methodology
List of Figures
- Figure 1: Global Alcoholic Drinks Packaging Industry Revenue Breakdown (billion, %) by Region 2025 & 2033
- Figure 2: North America Alcoholic Drinks Packaging Industry Revenue (billion), by Material 2025 & 2033
- Figure 3: North America Alcoholic Drinks Packaging Industry Revenue Share (%), by Material 2025 & 2033
- Figure 4: North America Alcoholic Drinks Packaging Industry Revenue (billion), by Package Type 2025 & 2033
- Figure 5: North America Alcoholic Drinks Packaging Industry Revenue Share (%), by Package Type 2025 & 2033
- Figure 6: North America Alcoholic Drinks Packaging Industry Revenue (billion), by Product 2025 & 2033
- Figure 7: North America Alcoholic Drinks Packaging Industry Revenue Share (%), by Product 2025 & 2033
- Figure 8: North America Alcoholic Drinks Packaging Industry Revenue (billion), by Country 2025 & 2033
- Figure 9: North America Alcoholic Drinks Packaging Industry Revenue Share (%), by Country 2025 & 2033
- Figure 10: Europe Alcoholic Drinks Packaging Industry Revenue (billion), by Material 2025 & 2033
- Figure 11: Europe Alcoholic Drinks Packaging Industry Revenue Share (%), by Material 2025 & 2033
- Figure 12: Europe Alcoholic Drinks Packaging Industry Revenue (billion), by Package Type 2025 & 2033
- Figure 13: Europe Alcoholic Drinks Packaging Industry Revenue Share (%), by Package Type 2025 & 2033
- Figure 14: Europe Alcoholic Drinks Packaging Industry Revenue (billion), by Product 2025 & 2033
- Figure 15: Europe Alcoholic Drinks Packaging Industry Revenue Share (%), by Product 2025 & 2033
- Figure 16: Europe Alcoholic Drinks Packaging Industry Revenue (billion), by Country 2025 & 2033
- Figure 17: Europe Alcoholic Drinks Packaging Industry Revenue Share (%), by Country 2025 & 2033
- Figure 18: Asia Pacific Alcoholic Drinks Packaging Industry Revenue (billion), by Material 2025 & 2033
- Figure 19: Asia Pacific Alcoholic Drinks Packaging Industry Revenue Share (%), by Material 2025 & 2033
- Figure 20: Asia Pacific Alcoholic Drinks Packaging Industry Revenue (billion), by Package Type 2025 & 2033
- Figure 21: Asia Pacific Alcoholic Drinks Packaging Industry Revenue Share (%), by Package Type 2025 & 2033
- Figure 22: Asia Pacific Alcoholic Drinks Packaging Industry Revenue (billion), by Product 2025 & 2033
- Figure 23: Asia Pacific Alcoholic Drinks Packaging Industry Revenue Share (%), by Product 2025 & 2033
- Figure 24: Asia Pacific Alcoholic Drinks Packaging Industry Revenue (billion), by Country 2025 & 2033
- Figure 25: Asia Pacific Alcoholic Drinks Packaging Industry Revenue Share (%), by Country 2025 & 2033
- Figure 26: Latin America Alcoholic Drinks Packaging Industry Revenue (billion), by Material 2025 & 2033
- Figure 27: Latin America Alcoholic Drinks Packaging Industry Revenue Share (%), by Material 2025 & 2033
- Figure 28: Latin America Alcoholic Drinks Packaging Industry Revenue (billion), by Package Type 2025 & 2033
- Figure 29: Latin America Alcoholic Drinks Packaging Industry Revenue Share (%), by Package Type 2025 & 2033
- Figure 30: Latin America Alcoholic Drinks Packaging Industry Revenue (billion), by Product 2025 & 2033
- Figure 31: Latin America Alcoholic Drinks Packaging Industry Revenue Share (%), by Product 2025 & 2033
- Figure 32: Latin America Alcoholic Drinks Packaging Industry Revenue (billion), by Country 2025 & 2033
- Figure 33: Latin America Alcoholic Drinks Packaging Industry Revenue Share (%), by Country 2025 & 2033
- Figure 34: Middle East Alcoholic Drinks Packaging Industry Revenue (billion), by Material 2025 & 2033
- Figure 35: Middle East Alcoholic Drinks Packaging Industry Revenue Share (%), by Material 2025 & 2033
- Figure 36: Middle East Alcoholic Drinks Packaging Industry Revenue (billion), by Package Type 2025 & 2033
- Figure 37: Middle East Alcoholic Drinks Packaging Industry Revenue Share (%), by Package Type 2025 & 2033
- Figure 38: Middle East Alcoholic Drinks Packaging Industry Revenue (billion), by Product 2025 & 2033
- Figure 39: Middle East Alcoholic Drinks Packaging Industry Revenue Share (%), by Product 2025 & 2033
- Figure 40: Middle East Alcoholic Drinks Packaging Industry Revenue (billion), by Country 2025 & 2033
- Figure 41: Middle East Alcoholic Drinks Packaging Industry Revenue Share (%), by Country 2025 & 2033
- Figure 42: UAE Alcoholic Drinks Packaging Industry Revenue (billion), by Material 2025 & 2033
- Figure 43: UAE Alcoholic Drinks Packaging Industry Revenue Share (%), by Material 2025 & 2033
- Figure 44: UAE Alcoholic Drinks Packaging Industry Revenue (billion), by Package Type 2025 & 2033
- Figure 45: UAE Alcoholic Drinks Packaging Industry Revenue Share (%), by Package Type 2025 & 2033
- Figure 46: UAE Alcoholic Drinks Packaging Industry Revenue (billion), by Product 2025 & 2033
- Figure 47: UAE Alcoholic Drinks Packaging Industry Revenue Share (%), by Product 2025 & 2033
- Figure 48: UAE Alcoholic Drinks Packaging Industry Revenue (billion), by Country 2025 & 2033
- Figure 49: UAE Alcoholic Drinks Packaging Industry Revenue Share (%), by Country 2025 & 2033
List of Tables
- Table 1: Global Alcoholic Drinks Packaging Industry Revenue billion Forecast, by Material 2020 & 2033
- Table 2: Global Alcoholic Drinks Packaging Industry Revenue billion Forecast, by Package Type 2020 & 2033
- Table 3: Global Alcoholic Drinks Packaging Industry Revenue billion Forecast, by Product 2020 & 2033
- Table 4: Global Alcoholic Drinks Packaging Industry Revenue billion Forecast, by Region 2020 & 2033
- Table 5: Global Alcoholic Drinks Packaging Industry Revenue billion Forecast, by Material 2020 & 2033
- Table 6: Global Alcoholic Drinks Packaging Industry Revenue billion Forecast, by Package Type 2020 & 2033
- Table 7: Global Alcoholic Drinks Packaging Industry Revenue billion Forecast, by Product 2020 & 2033
- Table 8: Global Alcoholic Drinks Packaging Industry Revenue billion Forecast, by Country 2020 & 2033
- Table 9: United States Alcoholic Drinks Packaging Industry Revenue (billion) Forecast, by Application 2020 & 2033
- Table 10: Canada Alcoholic Drinks Packaging Industry Revenue (billion) Forecast, by Application 2020 & 2033
- Table 11: Global Alcoholic Drinks Packaging Industry Revenue billion Forecast, by Material 2020 & 2033
- Table 12: Global Alcoholic Drinks Packaging Industry Revenue billion Forecast, by Package Type 2020 & 2033
- Table 13: Global Alcoholic Drinks Packaging Industry Revenue billion Forecast, by Product 2020 & 2033
- Table 14: Global Alcoholic Drinks Packaging Industry Revenue billion Forecast, by Country 2020 & 2033
- Table 15: Germany Alcoholic Drinks Packaging Industry Revenue (billion) Forecast, by Application 2020 & 2033
- Table 16: United Kingdom Alcoholic Drinks Packaging Industry Revenue (billion) Forecast, by Application 2020 & 2033
- Table 17: France Alcoholic Drinks Packaging Industry Revenue (billion) Forecast, by Application 2020 & 2033
- Table 18: Rest of Europe Alcoholic Drinks Packaging Industry Revenue (billion) Forecast, by Application 2020 & 2033
- Table 19: Global Alcoholic Drinks Packaging Industry Revenue billion Forecast, by Material 2020 & 2033
- Table 20: Global Alcoholic Drinks Packaging Industry Revenue billion Forecast, by Package Type 2020 & 2033
- Table 21: Global Alcoholic Drinks Packaging Industry Revenue billion Forecast, by Product 2020 & 2033
- Table 22: Global Alcoholic Drinks Packaging Industry Revenue billion Forecast, by Country 2020 & 2033
- Table 23: China Alcoholic Drinks Packaging Industry Revenue (billion) Forecast, by Application 2020 & 2033
- Table 24: Japan Alcoholic Drinks Packaging Industry Revenue (billion) Forecast, by Application 2020 & 2033
- Table 25: India Alcoholic Drinks Packaging Industry Revenue (billion) Forecast, by Application 2020 & 2033
- Table 26: Rest of Asia Pacific Alcoholic Drinks Packaging Industry Revenue (billion) Forecast, by Application 2020 & 2033
- Table 27: Global Alcoholic Drinks Packaging Industry Revenue billion Forecast, by Material 2020 & 2033
- Table 28: Global Alcoholic Drinks Packaging Industry Revenue billion Forecast, by Package Type 2020 & 2033
- Table 29: Global Alcoholic Drinks Packaging Industry Revenue billion Forecast, by Product 2020 & 2033
- Table 30: Global Alcoholic Drinks Packaging Industry Revenue billion Forecast, by Country 2020 & 2033
- Table 31: Brazil Alcoholic Drinks Packaging Industry Revenue (billion) Forecast, by Application 2020 & 2033
- Table 32: Argentina Alcoholic Drinks Packaging Industry Revenue (billion) Forecast, by Application 2020 & 2033
- Table 33: Mexico Alcoholic Drinks Packaging Industry Revenue (billion) Forecast, by Application 2020 & 2033
- Table 34: Rest of Latin America Alcoholic Drinks Packaging Industry Revenue (billion) Forecast, by Application 2020 & 2033
- Table 35: Global Alcoholic Drinks Packaging Industry Revenue billion Forecast, by Material 2020 & 2033
- Table 36: Global Alcoholic Drinks Packaging Industry Revenue billion Forecast, by Package Type 2020 & 2033
- Table 37: Global Alcoholic Drinks Packaging Industry Revenue billion Forecast, by Product 2020 & 2033
- Table 38: Global Alcoholic Drinks Packaging Industry Revenue billion Forecast, by Country 2020 & 2033
- Table 39: Global Alcoholic Drinks Packaging Industry Revenue billion Forecast, by Material 2020 & 2033
- Table 40: Global Alcoholic Drinks Packaging Industry Revenue billion Forecast, by Package Type 2020 & 2033
- Table 41: Global Alcoholic Drinks Packaging Industry Revenue billion Forecast, by Product 2020 & 2033
- Table 42: Global Alcoholic Drinks Packaging Industry Revenue billion Forecast, by Country 2020 & 2033
- Table 43: South Africa Alcoholic Drinks Packaging Industry Revenue (billion) Forecast, by Application 2020 & 2033
- Table 44: Rest of Middle East Alcoholic Drinks Packaging Industry Revenue (billion) Forecast, by Application 2020 & 2033
Frequently Asked Questions
1. What is the projected Compound Annual Growth Rate (CAGR) of the Alcoholic Drinks Packaging Industry?
The projected CAGR is approximately 5.05%.
2. Which companies are prominent players in the Alcoholic Drinks Packaging Industry?
Key companies in the market include Tetra Laval(tetra Pack), Krones AG, Amcor Plc, Ball Corporation (Rexam PLC), Mondi Group, Saint Gobain SA, Sidel Inc *List Not Exhaustive, Crown Holdings Incorporated.
3. What are the main segments of the Alcoholic Drinks Packaging Industry?
The market segments include Material, Package Type, Product.
4. Can you provide details about the market size?
The market size is estimated to be USD 168.08 billion as of 2022.
5. What are some drivers contributing to market growth?
; Increasing Prosperity and Urbanization; Rising Innovations in the Packaging Industry.
6. What are the notable trends driving market growth?
Glass Packing Accounts for the Largest Share in the Market.
7. Are there any restraints impacting market growth?
; Fluctuating Raw Material Prices.
8. Can you provide examples of recent developments in the market?
N/A
9. What pricing options are available for accessing the report?
Pricing options include single-user, multi-user, and enterprise licenses priced at USD 4750, USD 5250, and USD 8750 respectively.
10. Is the market size provided in terms of value or volume?
The market size is provided in terms of value, measured in billion.
11. Are there any specific market keywords associated with the report?
Yes, the market keyword associated with the report is "Alcoholic Drinks Packaging Industry," which aids in identifying and referencing the specific market segment covered.
12. How do I determine which pricing option suits my needs best?
The pricing options vary based on user requirements and access needs. Individual users may opt for single-user licenses, while businesses requiring broader access may choose multi-user or enterprise licenses for cost-effective access to the report.
13. Are there any additional resources or data provided in the Alcoholic Drinks Packaging Industry report?
While the report offers comprehensive insights, it's advisable to review the specific contents or supplementary materials provided to ascertain if additional resources or data are available.
14. How can I stay updated on further developments or reports in the Alcoholic Drinks Packaging Industry?
To stay informed about further developments, trends, and reports in the Alcoholic Drinks Packaging Industry, consider subscribing to industry newsletters, following relevant companies and organizations, or regularly checking reputable industry news sources and publications.
Methodology
Step 1 - Identification of Relevant Samples Size from Population Database


Step 2 - Approaches for Defining Global Market Size (Value, Volume* & Price*)

Note*: In applicable scenarios
Step 3 - Data Sources
Primary Research
- Web Analytics
- Survey Reports
- Research Institute
- Latest Research Reports
- Opinion Leaders
Secondary Research
- Annual Reports
- White Paper
- Latest Press Release
- Industry Association
- Paid Database
- Investor Presentations

Step 4 - Data Triangulation
Involves using different sources of information in order to increase the validity of a study
These sources are likely to be stakeholders in a program - participants, other researchers, program staff, other community members, and so on.
Then we put all data in single framework & apply various statistical tools to find out the dynamic on the market.
During the analysis stage, feedback from the stakeholder groups would be compared to determine areas of agreement as well as areas of divergence