

Key Insights
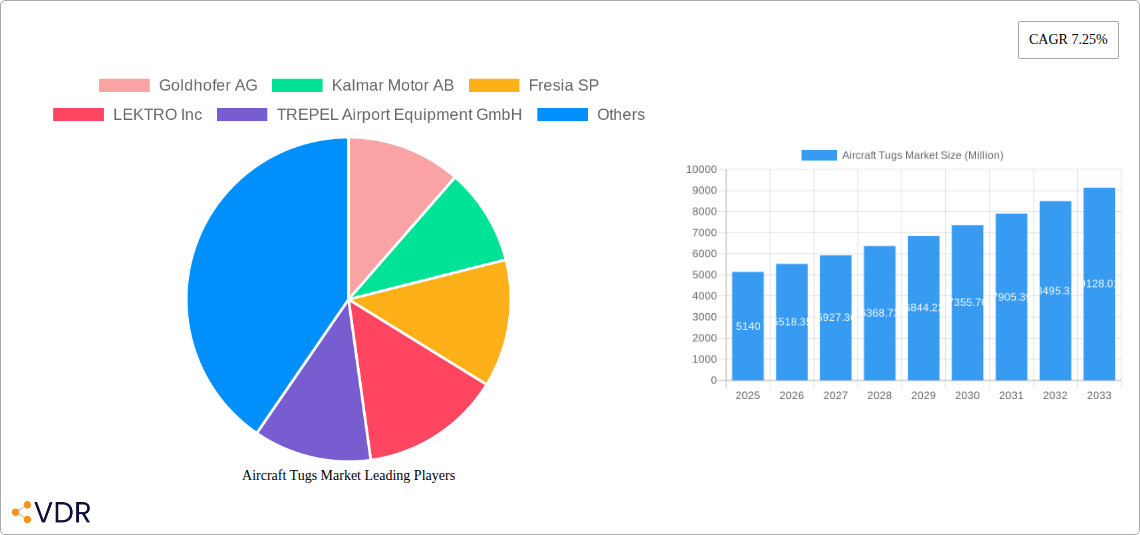
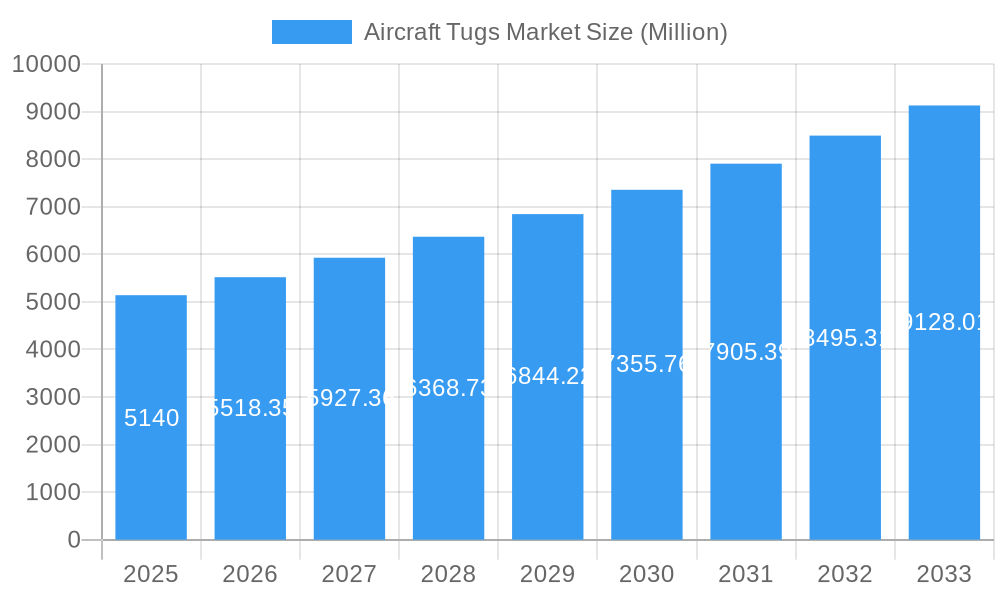
The global Aircraft Tugs Market, valued at $5.14 billion in 2025, is projected to experience robust growth, exhibiting a Compound Annual Growth Rate (CAGR) of 7.25% from 2025 to 2033. This expansion is fueled by several key factors. The increasing air passenger traffic globally necessitates efficient ground support equipment, driving demand for aircraft tugs. Furthermore, the ongoing trend toward larger aircraft and the consequent need for more powerful towing solutions contributes significantly to market growth. Technological advancements, such as the introduction of electric and towbarless tugs, are also boosting the market by offering improved fuel efficiency, reduced emissions, and enhanced operational safety. Regulations aimed at minimizing airport emissions are further incentivizing the adoption of eco-friendly electric tugs. However, the market faces certain restraints, including high initial investment costs for advanced tug models and the need for specialized infrastructure in some cases. The market segmentation reveals a strong preference for diesel-powered conventional tugs, although the electric segment is experiencing rapid growth, driven by environmental concerns and cost-saving potential over the long term.
Aircraft Tugs Market Market Size (In Billion)
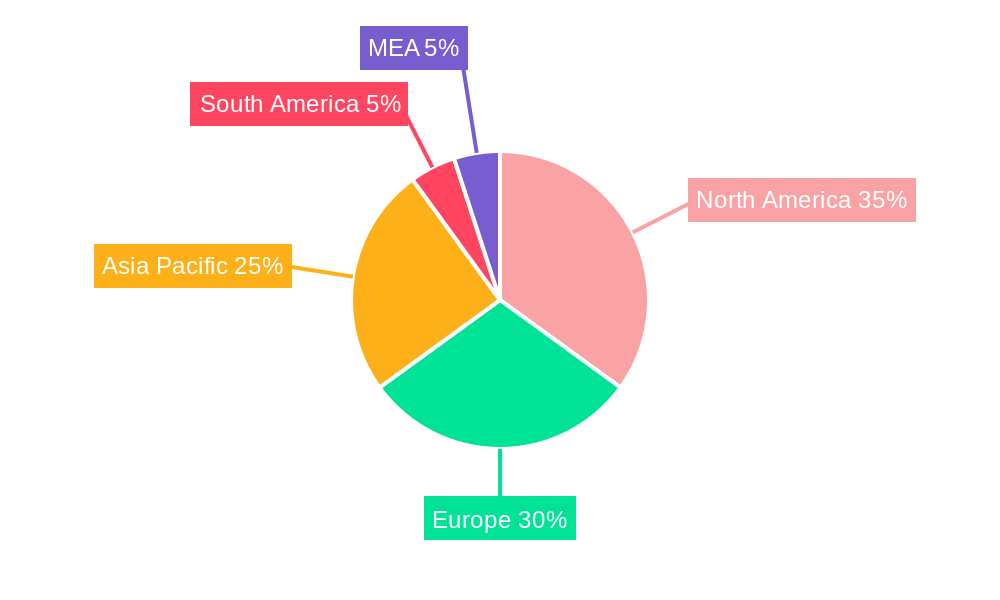
Regional analysis indicates strong demand across North America and Europe, driven by established aviation infrastructure and a high volume of air traffic. The Asia-Pacific region is also anticipated to witness significant growth during the forecast period, fueled by rapid expansion in the aviation sector in countries like China and India. Competitive landscape analysis indicates a blend of established players like Goldhofer AG and Kalmar Motor AB, alongside emerging companies innovating in electric and towbarless tug technologies. This competitive environment fosters innovation and price competitiveness, benefiting end-users and promoting market growth. The market is poised for continued expansion, driven by these factors, despite existing challenges related to costs and infrastructure requirements. The shift toward sustainability within the aviation industry is anticipated to further catalyze the growth of the electric aircraft tug segment in the coming years.
Aircraft Tugs Market Company Market Share
Aircraft Tugs Market: A Comprehensive Market Report (2019-2033)
This comprehensive report provides an in-depth analysis of the Aircraft Tugs Market, encompassing market dynamics, growth trends, regional dominance, product landscape, challenges, opportunities, and key players. The study period covers 2019-2033, with 2025 as the base and estimated year. The report utilizes a robust methodology to forecast market growth from 2025 to 2033, offering valuable insights for industry professionals, investors, and strategic decision-makers. The total market size is projected to reach xx Million units by 2033.
Aircraft Tugs Market Dynamics & Structure
The Aircraft Tugs Market, a sub-segment of the broader Ground Support Equipment (GSE) market, is characterized by moderate concentration with several key players competing for market share. Technological innovation, particularly in electric and towbarless tugs, is a significant driver, alongside stringent environmental regulations pushing the adoption of greener solutions. The market witnesses continuous mergers and acquisitions (M&A) activity, with xx major deals recorded between 2019 and 2024, representing a xx% increase compared to the previous period. The competitive landscape includes both established players and emerging companies offering a range of conventional and advanced tug types. The market is largely influenced by airport infrastructure development and airline fleet expansion.
- Market Concentration: Moderately concentrated, with top 5 players holding xx% market share in 2024.
- Technological Innovation: Focus on electric and autonomous tugs, improving efficiency and reducing emissions.
- Regulatory Framework: Stringent emission norms driving demand for electric tugs.
- Competitive Substitutes: Limited direct substitutes, but alternative ground handling methods exist.
- End-User Demographics: Primarily airports and airlines, with varying needs based on aircraft size and operational requirements.
- M&A Trends: Consolidation trend observed, with larger players acquiring smaller companies to expand market presence and technology portfolio.
Aircraft Tugs Market Growth Trends & Insights
The Aircraft Tugs Market witnessed steady growth during the historical period (2019-2024), with a CAGR of xx%. This growth is primarily attributed to the increasing air passenger traffic globally, leading to expanded airport operations and a higher demand for efficient ground support equipment. The market is further fueled by technological advancements in tug design, including the introduction of electric and towbarless models, which offer enhanced efficiency, reduced emissions, and improved safety. Adoption rates for electric tugs are projected to increase significantly over the forecast period, driven by environmental concerns and government incentives. Consumer behavior shifts towards sustainable practices are also influencing the demand for eco-friendly tugs. The market is expected to maintain a robust CAGR of xx% during the forecast period (2025-2033), reaching xx Million units by 2033.
Dominant Regions, Countries, or Segments in Aircraft Tugs Market
The global Aircraft Tugs Market is currently characterized by the strong presence of North America and Europe. These regions benefit from mature aviation ecosystems, stringent environmental mandates, and a high density of major international airports. However, the Asia-Pacific region is poised for the most dynamic growth in the coming years. This surge is propelled by the substantial expansion of air travel and significant investments in airport modernization and infrastructure development across the continent. Examining market segments, conventional tugs continue to command the largest market share, largely attributed to their proven reliability, established technology, and cost-effectiveness. Concurrently, the electric tug segment is projected to experience the most rapid ascent, driven by escalating environmental consciousness among aviation stakeholders and continuous advancements in battery technology and electric propulsion systems.
- Key Drivers for North America: Strict emission standards driving innovation, ongoing technological advancements in tug design, and a deeply entrenched and sophisticated aviation infrastructure.
- Key Drivers for Europe: Consistently high aircraft traffic volumes, extensive modernization initiatives for airport infrastructure, and a proactive adoption of eco-friendly and sustainable ground support equipment.
- Key Drivers for Asia-Pacific: Phenomenal growth in passenger and cargo air traffic, substantial investments in new airport construction and upgrades, and supportive government policies championing sustainable aviation practices.
- Segment Dominance & Growth: Conventional tugs currently hold the leading market share (estimated at 65-70%), but electric tugs are demonstrating the highest growth potential with an anticipated CAGR of 8-10% over the forecast period.
Aircraft Tugs Market Product Landscape
The Aircraft Tugs Market presents a rich and varied product portfolio, encompassing conventional tugs, towbarless tugs, and increasingly, electric tugs. Conventional tugs remain a popular choice due to their inherent robustness, straightforward operation, and favorable cost profile. Towbarless tugs, on the other hand, are highly valued for their superior maneuverability, enhanced safety during aircraft connection and disconnection, and reduced potential for damage to aircraft landing gear. The rise of electric tugs is a significant trend, driven by their zero-emission operation, considerably lower running costs, and contribution to a quieter airport environment. Current innovation efforts are keenly focused on optimizing energy efficiency, integrating advanced safety features such as sophisticated obstacle detection and automatic braking systems, and further reducing noise pollution. The unique selling propositions (USPs) of modern tugs often revolve around exceptional fuel efficiency (for conventional and hybrid models), intuitive user interfaces and ease of operation, and cutting-edge safety technologies that minimize risk and maximize operational efficiency.
Key Drivers, Barriers & Challenges in Aircraft Tugs Market
Key Drivers:
- Increasing air passenger traffic globally.
- Stringent environmental regulations promoting greener technologies.
- Technological advancements in tug design and functionality.
- Growing investments in airport infrastructure development.
Key Challenges & Restraints:
- High initial investment costs for electric tugs can hinder wider adoption.
- Limited availability of charging infrastructure for electric tugs at airports.
- Supply chain disruptions can impact production and delivery timelines.
- Intense competition among established and emerging players.
Emerging Opportunities in Aircraft Tugs Market
- Untapped Markets: Significant opportunities exist in expanding market reach into developing economies that are experiencing rapid growth in their aviation sectors, requiring substantial investment in ground support equipment.
- Innovative Applications: The development and deployment of autonomous and remotely operated tugs represent a key frontier, promising increased efficiency, reduced labor dependency, and enhanced safety in complex airport operations.
- Evolving Consumer Preferences: A growing demand for sustainable, environmentally conscious, and highly efficient ground support equipment is shaping product development and procurement decisions within the aviation industry.
- Technological Integration: Opportunities lie in integrating advanced connectivity and data analytics for predictive maintenance, optimized fleet management, and enhanced operational visibility.
Growth Accelerators in the Aircraft Tugs Market Industry
Technological breakthroughs, such as the development of more powerful and efficient electric motors, along with strategic partnerships between manufacturers and airlines to promote the adoption of electric tugs, are key catalysts driving long-term growth. Market expansion strategies targeting emerging markets with developing aviation sectors will further accelerate market growth.
Key Players Shaping the Aircraft Tugs Market Market
- Goldhofer AG
- Kalmar Motor AB
- Fresia SP
- LEKTRO Inc
- TREPEL Airport Equipment GmbH
- Tronair Inc
- John Bean Technologies Corp
- Tinka Resources Limited
- Textron Inc (Ground Support Equipment Inc)
- Airtug LLC
- MULAG
- MOTOTOK
Notable Milestones in Aircraft Tugs Market Sector
- June 2023: Lokpriyo Gopinath Bordoloi International Airport launched its first electric vehicle tug, signifying a shift towards sustainable ground operations.
- April 2023: Air India's adoption of pilot-controlled tow tractors for Airbus A320s at Delhi and Bengaluru airports highlights the industry's focus on emission reduction.
In-Depth Aircraft Tugs Market Market Outlook
The Aircraft Tugs Market is poised for significant growth, driven by the continued expansion of the aviation industry, increasing demand for sustainable ground support equipment, and ongoing technological advancements. Strategic partnerships and investments in research and development will play a crucial role in shaping the future of the market, with a strong focus on electric and autonomous solutions. The market presents significant opportunities for players who can innovate, adapt to evolving regulations, and offer cost-effective and environmentally friendly solutions.
Aircraft Tugs Market Segmentation
- 1. Production Analysis
- 2. Consumption Analysis
- 3. Import Market Analysis (Value & Volume)
- 4. Export Market Analysis (Value & Volume)
- 5. Price Trend Analysis
Aircraft Tugs Market Segmentation By Geography
-
1. North America
- 1.1. United States
- 1.2. Canada
- 1.3. Mexico
-
2. South America
- 2.1. Brazil
- 2.2. Argentina
- 2.3. Rest of South America
-
3. Europe
- 3.1. United Kingdom
- 3.2. Germany
- 3.3. France
- 3.4. Italy
- 3.5. Spain
- 3.6. Russia
- 3.7. Benelux
- 3.8. Nordics
- 3.9. Rest of Europe
-
4. Middle East & Africa
- 4.1. Turkey
- 4.2. Israel
- 4.3. GCC
- 4.4. North Africa
- 4.5. South Africa
- 4.6. Rest of Middle East & Africa
-
5. Asia Pacific
- 5.1. China
- 5.2. India
- 5.3. Japan
- 5.4. South Korea
- 5.5. ASEAN
- 5.6. Oceania
- 5.7. Rest of Asia Pacific
Aircraft Tugs Market Regional Market Share
Geographic Coverage of Aircraft Tugs Market
Aircraft Tugs Market REPORT HIGHLIGHTS
| Aspects | Details |
|---|---|
| Study Period | 2020-2034 |
| Base Year | 2025 |
| Estimated Year | 2026 |
| Forecast Period | 2026-2034 |
| Historical Period | 2020-2025 |
| Growth Rate | CAGR of 7.25% from 2020-2034 |
| Segmentation |
|
Table of Contents
- 1. Introduction
- 1.1. Research Scope
- 1.2. Market Segmentation
- 1.3. Research Objective
- 1.4. Definitions and Assumptions
- 2. Executive Summary
- 2.1. Market Snapshot
- 3. Market Dynamics
- 3.1. Market Drivers
- 3.2. Market Restrains
- 3.3. Market Trends
- 3.4. Market Opportunities
- 4. Market Factor Analysis
- 4.1. Porters Five Forces
- 4.1.1. Bargaining Power of Suppliers
- 4.1.2. Bargaining Power of Buyers
- 4.1.3. Threat of New Entrants
- 4.1.4. Threat of Substitutes
- 4.1.5. Competitive Rivalry
- 4.2. PESTEL analysis
- 4.3. BCG Analysis
- 4.3.1. Stars (High Growth, High Market Share)
- 4.3.2. Cash Cows (Low Growth, High Market Share)
- 4.3.3. Question Mark (High Growth, Low Market Share)
- 4.3.4. Dogs (Low Growth, Low Market Share)
- 4.4. Ansoff Matrix Analysis
- 4.5. Supply Chain Analysis
- 4.6. Regulatory Landscape
- 4.7. Current Market Potential and Opportunity Assessment (TAM–SAM–SOM Framework)
- 4.8. VDR Analyst Note
- 4.1. Porters Five Forces
- 5. Market Analysis, Insights and Forecast 2021-2033
- 5.1. Market Analysis, Insights and Forecast - by Production Analysis
- 5.2. Market Analysis, Insights and Forecast - by Consumption Analysis
- 5.3. Market Analysis, Insights and Forecast - by Import Market Analysis (Value & Volume)
- 5.4. Market Analysis, Insights and Forecast - by Export Market Analysis (Value & Volume)
- 5.5. Market Analysis, Insights and Forecast - by Price Trend Analysis
- 5.6. Market Analysis, Insights and Forecast - by Region
- 5.6.1. North America
- 5.6.2. South America
- 5.6.3. Europe
- 5.6.4. Middle East & Africa
- 5.6.5. Asia Pacific
- 6. Global Aircraft Tugs Market Analysis, Insights and Forecast, 2021-2033
- 6.1. Market Analysis, Insights and Forecast - by Production Analysis
- 6.2. Market Analysis, Insights and Forecast - by Consumption Analysis
- 6.3. Market Analysis, Insights and Forecast - by Import Market Analysis (Value & Volume)
- 6.4. Market Analysis, Insights and Forecast - by Export Market Analysis (Value & Volume)
- 6.5. Market Analysis, Insights and Forecast - by Price Trend Analysis
- 7. North America Aircraft Tugs Market Analysis, Insights and Forecast, 2021-2033
- 7.1. Market Analysis, Insights and Forecast - by Production Analysis
- 7.2. Market Analysis, Insights and Forecast - by Consumption Analysis
- 7.3. Market Analysis, Insights and Forecast - by Import Market Analysis (Value & Volume)
- 7.4. Market Analysis, Insights and Forecast - by Export Market Analysis (Value & Volume)
- 7.5. Market Analysis, Insights and Forecast - by Price Trend Analysis
- 8. South America Aircraft Tugs Market Analysis, Insights and Forecast, 2021-2033
- 8.1. Market Analysis, Insights and Forecast - by Production Analysis
- 8.2. Market Analysis, Insights and Forecast - by Consumption Analysis
- 8.3. Market Analysis, Insights and Forecast - by Import Market Analysis (Value & Volume)
- 8.4. Market Analysis, Insights and Forecast - by Export Market Analysis (Value & Volume)
- 8.5. Market Analysis, Insights and Forecast - by Price Trend Analysis
- 9. Europe Aircraft Tugs Market Analysis, Insights and Forecast, 2021-2033
- 9.1. Market Analysis, Insights and Forecast - by Production Analysis
- 9.2. Market Analysis, Insights and Forecast - by Consumption Analysis
- 9.3. Market Analysis, Insights and Forecast - by Import Market Analysis (Value & Volume)
- 9.4. Market Analysis, Insights and Forecast - by Export Market Analysis (Value & Volume)
- 9.5. Market Analysis, Insights and Forecast - by Price Trend Analysis
- 10. Middle East & Africa Aircraft Tugs Market Analysis, Insights and Forecast, 2021-2033
- 10.1. Market Analysis, Insights and Forecast - by Production Analysis
- 10.2. Market Analysis, Insights and Forecast - by Consumption Analysis
- 10.3. Market Analysis, Insights and Forecast - by Import Market Analysis (Value & Volume)
- 10.4. Market Analysis, Insights and Forecast - by Export Market Analysis (Value & Volume)
- 10.5. Market Analysis, Insights and Forecast - by Price Trend Analysis
- 11. Asia Pacific Aircraft Tugs Market Analysis, Insights and Forecast, 2021-2033
- 11.1. Market Analysis, Insights and Forecast - by Production Analysis
- 11.2. Market Analysis, Insights and Forecast - by Consumption Analysis
- 11.3. Market Analysis, Insights and Forecast - by Import Market Analysis (Value & Volume)
- 11.4. Market Analysis, Insights and Forecast - by Export Market Analysis (Value & Volume)
- 11.5. Market Analysis, Insights and Forecast - by Price Trend Analysis
- 12. Competitive Analysis
- 12.1. Company Profiles
- 12.1.1 Goldhofer AG
- 12.1.1.1. Company Overview
- 12.1.1.2. Products
- 12.1.1.3. Company Financials
- 12.1.1.4. SWOT Analysis
- 12.1.2 Kalmar Motor AB
- 12.1.2.1. Company Overview
- 12.1.2.2. Products
- 12.1.2.3. Company Financials
- 12.1.2.4. SWOT Analysis
- 12.1.3 Fresia SP
- 12.1.3.1. Company Overview
- 12.1.3.2. Products
- 12.1.3.3. Company Financials
- 12.1.3.4. SWOT Analysis
- 12.1.4 LEKTRO Inc
- 12.1.4.1. Company Overview
- 12.1.4.2. Products
- 12.1.4.3. Company Financials
- 12.1.4.4. SWOT Analysis
- 12.1.5 TREPEL Airport Equipment GmbH
- 12.1.5.1. Company Overview
- 12.1.5.2. Products
- 12.1.5.3. Company Financials
- 12.1.5.4. SWOT Analysis
- 12.1.6 Tronair Inc
- 12.1.6.1. Company Overview
- 12.1.6.2. Products
- 12.1.6.3. Company Financials
- 12.1.6.4. SWOT Analysis
- 12.1.7 John Bean Technologies Corp
- 12.1.7.1. Company Overview
- 12.1.7.2. Products
- 12.1.7.3. Company Financials
- 12.1.7.4. SWOT Analysis
- 12.1.8 Tinka Resources Limited
- 12.1.8.1. Company Overview
- 12.1.8.2. Products
- 12.1.8.3. Company Financials
- 12.1.8.4. SWOT Analysis
- 12.1.9 Textron Inc (Ground Support Equipment Inc )
- 12.1.9.1. Company Overview
- 12.1.9.2. Products
- 12.1.9.3. Company Financials
- 12.1.9.4. SWOT Analysis
- 12.1.10 Airtug LLC
- 12.1.10.1. Company Overview
- 12.1.10.2. Products
- 12.1.10.3. Company Financials
- 12.1.10.4. SWOT Analysis
- 12.1.11 MULAG
- 12.1.11.1. Company Overview
- 12.1.11.2. Products
- 12.1.11.3. Company Financials
- 12.1.11.4. SWOT Analysis
- 12.1.12 MOTOTOK
- 12.1.12.1. Company Overview
- 12.1.12.2. Products
- 12.1.12.3. Company Financials
- 12.1.12.4. SWOT Analysis
- 12.1.1 Goldhofer AG
- 12.2. Market Entropy
- 12.2.1 Company's Key Areas Served
- 12.2.2 Recent Developments
- 12.3. Company Market Share Analysis 2025
- 12.3.1 Top 5 Companies Market Share Analysis
- 12.3.2 Top 3 Companies Market Share Analysis
- 12.4. List of Potential Customers
- 13. Research Methodology
List of Figures
- Figure 1: Global Aircraft Tugs Market Revenue Breakdown (billion, %) by Region 2025 & 2033
- Figure 2: North America Aircraft Tugs Market Revenue (billion), by Production Analysis 2025 & 2033
- Figure 3: North America Aircraft Tugs Market Revenue Share (%), by Production Analysis 2025 & 2033
- Figure 4: North America Aircraft Tugs Market Revenue (billion), by Consumption Analysis 2025 & 2033
- Figure 5: North America Aircraft Tugs Market Revenue Share (%), by Consumption Analysis 2025 & 2033
- Figure 6: North America Aircraft Tugs Market Revenue (billion), by Import Market Analysis (Value & Volume) 2025 & 2033
- Figure 7: North America Aircraft Tugs Market Revenue Share (%), by Import Market Analysis (Value & Volume) 2025 & 2033
- Figure 8: North America Aircraft Tugs Market Revenue (billion), by Export Market Analysis (Value & Volume) 2025 & 2033
- Figure 9: North America Aircraft Tugs Market Revenue Share (%), by Export Market Analysis (Value & Volume) 2025 & 2033
- Figure 10: North America Aircraft Tugs Market Revenue (billion), by Price Trend Analysis 2025 & 2033
- Figure 11: North America Aircraft Tugs Market Revenue Share (%), by Price Trend Analysis 2025 & 2033
- Figure 12: North America Aircraft Tugs Market Revenue (billion), by Country 2025 & 2033
- Figure 13: North America Aircraft Tugs Market Revenue Share (%), by Country 2025 & 2033
- Figure 14: South America Aircraft Tugs Market Revenue (billion), by Production Analysis 2025 & 2033
- Figure 15: South America Aircraft Tugs Market Revenue Share (%), by Production Analysis 2025 & 2033
- Figure 16: South America Aircraft Tugs Market Revenue (billion), by Consumption Analysis 2025 & 2033
- Figure 17: South America Aircraft Tugs Market Revenue Share (%), by Consumption Analysis 2025 & 2033
- Figure 18: South America Aircraft Tugs Market Revenue (billion), by Import Market Analysis (Value & Volume) 2025 & 2033
- Figure 19: South America Aircraft Tugs Market Revenue Share (%), by Import Market Analysis (Value & Volume) 2025 & 2033
- Figure 20: South America Aircraft Tugs Market Revenue (billion), by Export Market Analysis (Value & Volume) 2025 & 2033
- Figure 21: South America Aircraft Tugs Market Revenue Share (%), by Export Market Analysis (Value & Volume) 2025 & 2033
- Figure 22: South America Aircraft Tugs Market Revenue (billion), by Price Trend Analysis 2025 & 2033
- Figure 23: South America Aircraft Tugs Market Revenue Share (%), by Price Trend Analysis 2025 & 2033
- Figure 24: South America Aircraft Tugs Market Revenue (billion), by Country 2025 & 2033
- Figure 25: South America Aircraft Tugs Market Revenue Share (%), by Country 2025 & 2033
- Figure 26: Europe Aircraft Tugs Market Revenue (billion), by Production Analysis 2025 & 2033
- Figure 27: Europe Aircraft Tugs Market Revenue Share (%), by Production Analysis 2025 & 2033
- Figure 28: Europe Aircraft Tugs Market Revenue (billion), by Consumption Analysis 2025 & 2033
- Figure 29: Europe Aircraft Tugs Market Revenue Share (%), by Consumption Analysis 2025 & 2033
- Figure 30: Europe Aircraft Tugs Market Revenue (billion), by Import Market Analysis (Value & Volume) 2025 & 2033
- Figure 31: Europe Aircraft Tugs Market Revenue Share (%), by Import Market Analysis (Value & Volume) 2025 & 2033
- Figure 32: Europe Aircraft Tugs Market Revenue (billion), by Export Market Analysis (Value & Volume) 2025 & 2033
- Figure 33: Europe Aircraft Tugs Market Revenue Share (%), by Export Market Analysis (Value & Volume) 2025 & 2033
- Figure 34: Europe Aircraft Tugs Market Revenue (billion), by Price Trend Analysis 2025 & 2033
- Figure 35: Europe Aircraft Tugs Market Revenue Share (%), by Price Trend Analysis 2025 & 2033
- Figure 36: Europe Aircraft Tugs Market Revenue (billion), by Country 2025 & 2033
- Figure 37: Europe Aircraft Tugs Market Revenue Share (%), by Country 2025 & 2033
- Figure 38: Middle East & Africa Aircraft Tugs Market Revenue (billion), by Production Analysis 2025 & 2033
- Figure 39: Middle East & Africa Aircraft Tugs Market Revenue Share (%), by Production Analysis 2025 & 2033
- Figure 40: Middle East & Africa Aircraft Tugs Market Revenue (billion), by Consumption Analysis 2025 & 2033
- Figure 41: Middle East & Africa Aircraft Tugs Market Revenue Share (%), by Consumption Analysis 2025 & 2033
- Figure 42: Middle East & Africa Aircraft Tugs Market Revenue (billion), by Import Market Analysis (Value & Volume) 2025 & 2033
- Figure 43: Middle East & Africa Aircraft Tugs Market Revenue Share (%), by Import Market Analysis (Value & Volume) 2025 & 2033
- Figure 44: Middle East & Africa Aircraft Tugs Market Revenue (billion), by Export Market Analysis (Value & Volume) 2025 & 2033
- Figure 45: Middle East & Africa Aircraft Tugs Market Revenue Share (%), by Export Market Analysis (Value & Volume) 2025 & 2033
- Figure 46: Middle East & Africa Aircraft Tugs Market Revenue (billion), by Price Trend Analysis 2025 & 2033
- Figure 47: Middle East & Africa Aircraft Tugs Market Revenue Share (%), by Price Trend Analysis 2025 & 2033
- Figure 48: Middle East & Africa Aircraft Tugs Market Revenue (billion), by Country 2025 & 2033
- Figure 49: Middle East & Africa Aircraft Tugs Market Revenue Share (%), by Country 2025 & 2033
- Figure 50: Asia Pacific Aircraft Tugs Market Revenue (billion), by Production Analysis 2025 & 2033
- Figure 51: Asia Pacific Aircraft Tugs Market Revenue Share (%), by Production Analysis 2025 & 2033
- Figure 52: Asia Pacific Aircraft Tugs Market Revenue (billion), by Consumption Analysis 2025 & 2033
- Figure 53: Asia Pacific Aircraft Tugs Market Revenue Share (%), by Consumption Analysis 2025 & 2033
- Figure 54: Asia Pacific Aircraft Tugs Market Revenue (billion), by Import Market Analysis (Value & Volume) 2025 & 2033
- Figure 55: Asia Pacific Aircraft Tugs Market Revenue Share (%), by Import Market Analysis (Value & Volume) 2025 & 2033
- Figure 56: Asia Pacific Aircraft Tugs Market Revenue (billion), by Export Market Analysis (Value & Volume) 2025 & 2033
- Figure 57: Asia Pacific Aircraft Tugs Market Revenue Share (%), by Export Market Analysis (Value & Volume) 2025 & 2033
- Figure 58: Asia Pacific Aircraft Tugs Market Revenue (billion), by Price Trend Analysis 2025 & 2033
- Figure 59: Asia Pacific Aircraft Tugs Market Revenue Share (%), by Price Trend Analysis 2025 & 2033
- Figure 60: Asia Pacific Aircraft Tugs Market Revenue (billion), by Country 2025 & 2033
- Figure 61: Asia Pacific Aircraft Tugs Market Revenue Share (%), by Country 2025 & 2033
List of Tables
- Table 1: Global Aircraft Tugs Market Revenue billion Forecast, by Production Analysis 2020 & 2033
- Table 2: Global Aircraft Tugs Market Revenue billion Forecast, by Consumption Analysis 2020 & 2033
- Table 3: Global Aircraft Tugs Market Revenue billion Forecast, by Import Market Analysis (Value & Volume) 2020 & 2033
- Table 4: Global Aircraft Tugs Market Revenue billion Forecast, by Export Market Analysis (Value & Volume) 2020 & 2033
- Table 5: Global Aircraft Tugs Market Revenue billion Forecast, by Price Trend Analysis 2020 & 2033
- Table 6: Global Aircraft Tugs Market Revenue billion Forecast, by Region 2020 & 2033
- Table 7: Global Aircraft Tugs Market Revenue billion Forecast, by Production Analysis 2020 & 2033
- Table 8: Global Aircraft Tugs Market Revenue billion Forecast, by Consumption Analysis 2020 & 2033
- Table 9: Global Aircraft Tugs Market Revenue billion Forecast, by Import Market Analysis (Value & Volume) 2020 & 2033
- Table 10: Global Aircraft Tugs Market Revenue billion Forecast, by Export Market Analysis (Value & Volume) 2020 & 2033
- Table 11: Global Aircraft Tugs Market Revenue billion Forecast, by Price Trend Analysis 2020 & 2033
- Table 12: Global Aircraft Tugs Market Revenue billion Forecast, by Country 2020 & 2033
- Table 13: United States Aircraft Tugs Market Revenue (billion) Forecast, by Application 2020 & 2033
- Table 14: Canada Aircraft Tugs Market Revenue (billion) Forecast, by Application 2020 & 2033
- Table 15: Mexico Aircraft Tugs Market Revenue (billion) Forecast, by Application 2020 & 2033
- Table 16: Global Aircraft Tugs Market Revenue billion Forecast, by Production Analysis 2020 & 2033
- Table 17: Global Aircraft Tugs Market Revenue billion Forecast, by Consumption Analysis 2020 & 2033
- Table 18: Global Aircraft Tugs Market Revenue billion Forecast, by Import Market Analysis (Value & Volume) 2020 & 2033
- Table 19: Global Aircraft Tugs Market Revenue billion Forecast, by Export Market Analysis (Value & Volume) 2020 & 2033
- Table 20: Global Aircraft Tugs Market Revenue billion Forecast, by Price Trend Analysis 2020 & 2033
- Table 21: Global Aircraft Tugs Market Revenue billion Forecast, by Country 2020 & 2033
- Table 22: Brazil Aircraft Tugs Market Revenue (billion) Forecast, by Application 2020 & 2033
- Table 23: Argentina Aircraft Tugs Market Revenue (billion) Forecast, by Application 2020 & 2033
- Table 24: Rest of South America Aircraft Tugs Market Revenue (billion) Forecast, by Application 2020 & 2033
- Table 25: Global Aircraft Tugs Market Revenue billion Forecast, by Production Analysis 2020 & 2033
- Table 26: Global Aircraft Tugs Market Revenue billion Forecast, by Consumption Analysis 2020 & 2033
- Table 27: Global Aircraft Tugs Market Revenue billion Forecast, by Import Market Analysis (Value & Volume) 2020 & 2033
- Table 28: Global Aircraft Tugs Market Revenue billion Forecast, by Export Market Analysis (Value & Volume) 2020 & 2033
- Table 29: Global Aircraft Tugs Market Revenue billion Forecast, by Price Trend Analysis 2020 & 2033
- Table 30: Global Aircraft Tugs Market Revenue billion Forecast, by Country 2020 & 2033
- Table 31: United Kingdom Aircraft Tugs Market Revenue (billion) Forecast, by Application 2020 & 2033
- Table 32: Germany Aircraft Tugs Market Revenue (billion) Forecast, by Application 2020 & 2033
- Table 33: France Aircraft Tugs Market Revenue (billion) Forecast, by Application 2020 & 2033
- Table 34: Italy Aircraft Tugs Market Revenue (billion) Forecast, by Application 2020 & 2033
- Table 35: Spain Aircraft Tugs Market Revenue (billion) Forecast, by Application 2020 & 2033
- Table 36: Russia Aircraft Tugs Market Revenue (billion) Forecast, by Application 2020 & 2033
- Table 37: Benelux Aircraft Tugs Market Revenue (billion) Forecast, by Application 2020 & 2033
- Table 38: Nordics Aircraft Tugs Market Revenue (billion) Forecast, by Application 2020 & 2033
- Table 39: Rest of Europe Aircraft Tugs Market Revenue (billion) Forecast, by Application 2020 & 2033
- Table 40: Global Aircraft Tugs Market Revenue billion Forecast, by Production Analysis 2020 & 2033
- Table 41: Global Aircraft Tugs Market Revenue billion Forecast, by Consumption Analysis 2020 & 2033
- Table 42: Global Aircraft Tugs Market Revenue billion Forecast, by Import Market Analysis (Value & Volume) 2020 & 2033
- Table 43: Global Aircraft Tugs Market Revenue billion Forecast, by Export Market Analysis (Value & Volume) 2020 & 2033
- Table 44: Global Aircraft Tugs Market Revenue billion Forecast, by Price Trend Analysis 2020 & 2033
- Table 45: Global Aircraft Tugs Market Revenue billion Forecast, by Country 2020 & 2033
- Table 46: Turkey Aircraft Tugs Market Revenue (billion) Forecast, by Application 2020 & 2033
- Table 47: Israel Aircraft Tugs Market Revenue (billion) Forecast, by Application 2020 & 2033
- Table 48: GCC Aircraft Tugs Market Revenue (billion) Forecast, by Application 2020 & 2033
- Table 49: North Africa Aircraft Tugs Market Revenue (billion) Forecast, by Application 2020 & 2033
- Table 50: South Africa Aircraft Tugs Market Revenue (billion) Forecast, by Application 2020 & 2033
- Table 51: Rest of Middle East & Africa Aircraft Tugs Market Revenue (billion) Forecast, by Application 2020 & 2033
- Table 52: Global Aircraft Tugs Market Revenue billion Forecast, by Production Analysis 2020 & 2033
- Table 53: Global Aircraft Tugs Market Revenue billion Forecast, by Consumption Analysis 2020 & 2033
- Table 54: Global Aircraft Tugs Market Revenue billion Forecast, by Import Market Analysis (Value & Volume) 2020 & 2033
- Table 55: Global Aircraft Tugs Market Revenue billion Forecast, by Export Market Analysis (Value & Volume) 2020 & 2033
- Table 56: Global Aircraft Tugs Market Revenue billion Forecast, by Price Trend Analysis 2020 & 2033
- Table 57: Global Aircraft Tugs Market Revenue billion Forecast, by Country 2020 & 2033
- Table 58: China Aircraft Tugs Market Revenue (billion) Forecast, by Application 2020 & 2033
- Table 59: India Aircraft Tugs Market Revenue (billion) Forecast, by Application 2020 & 2033
- Table 60: Japan Aircraft Tugs Market Revenue (billion) Forecast, by Application 2020 & 2033
- Table 61: South Korea Aircraft Tugs Market Revenue (billion) Forecast, by Application 2020 & 2033
- Table 62: ASEAN Aircraft Tugs Market Revenue (billion) Forecast, by Application 2020 & 2033
- Table 63: Oceania Aircraft Tugs Market Revenue (billion) Forecast, by Application 2020 & 2033
- Table 64: Rest of Asia Pacific Aircraft Tugs Market Revenue (billion) Forecast, by Application 2020 & 2033
Frequently Asked Questions
1. What is the projected Compound Annual Growth Rate (CAGR) of the Aircraft Tugs Market?
The projected CAGR is approximately 7.25%.
2. Which companies are prominent players in the Aircraft Tugs Market?
Key companies in the market include Goldhofer AG, Kalmar Motor AB, Fresia SP, LEKTRO Inc, TREPEL Airport Equipment GmbH, Tronair Inc, John Bean Technologies Corp, Tinka Resources Limited, Textron Inc (Ground Support Equipment Inc ), Airtug LLC, MULAG, MOTOTOK.
3. What are the main segments of the Aircraft Tugs Market?
The market segments include Production Analysis, Consumption Analysis, Import Market Analysis (Value & Volume), Export Market Analysis (Value & Volume), Price Trend Analysis.
4. Can you provide details about the market size?
The market size is estimated to be USD 5.51 billion as of 2022.
5. What are some drivers contributing to market growth?
Increase in Internet of Things (IoT) and Autonomous Systems; Rise in Demand for Military and Defense Satellite Communication Solutions.
6. What are the notable trends driving market growth?
Electric Segment is Anticipated to Register the Highest CAGR During the Forecast Period.
7. Are there any restraints impacting market growth?
Cybersecurity Threats to Satellite Communication; Interference in Transmission of Data.
8. Can you provide examples of recent developments in the market?
June 2023: Lokpriyo Gopinath Bordoloi International Airport launched its first electric vehicle tug to handle ground operations.
9. What pricing options are available for accessing the report?
Pricing options include single-user, multi-user, and enterprise licenses priced at USD 4750, USD 5250, and USD 8750 respectively.
10. Is the market size provided in terms of value or volume?
The market size is provided in terms of value, measured in billion.
11. Are there any specific market keywords associated with the report?
Yes, the market keyword associated with the report is "Aircraft Tugs Market," which aids in identifying and referencing the specific market segment covered.
12. How do I determine which pricing option suits my needs best?
The pricing options vary based on user requirements and access needs. Individual users may opt for single-user licenses, while businesses requiring broader access may choose multi-user or enterprise licenses for cost-effective access to the report.
13. Are there any additional resources or data provided in the Aircraft Tugs Market report?
While the report offers comprehensive insights, it's advisable to review the specific contents or supplementary materials provided to ascertain if additional resources or data are available.
14. How can I stay updated on further developments or reports in the Aircraft Tugs Market?
To stay informed about further developments, trends, and reports in the Aircraft Tugs Market, consider subscribing to industry newsletters, following relevant companies and organizations, or regularly checking reputable industry news sources and publications.
Methodology
Step 1 - Identification of Relevant Samples Size from Population Database


Step 2 - Approaches for Defining Global Market Size (Value, Volume* & Price*)

Note*: In applicable scenarios
Step 3 - Data Sources
Primary Research
- Web Analytics
- Survey Reports
- Research Institute
- Latest Research Reports
- Opinion Leaders
Secondary Research
- Annual Reports
- White Paper
- Latest Press Release
- Industry Association
- Paid Database
- Investor Presentations

Step 4 - Data Triangulation
Involves using different sources of information in order to increase the validity of a study
These sources are likely to be stakeholders in a program - participants, other researchers, program staff, other community members, and so on.
Then we put all data in single framework & apply various statistical tools to find out the dynamic on the market.
During the analysis stage, feedback from the stakeholder groups would be compared to determine areas of agreement as well as areas of divergence