

Key Insights
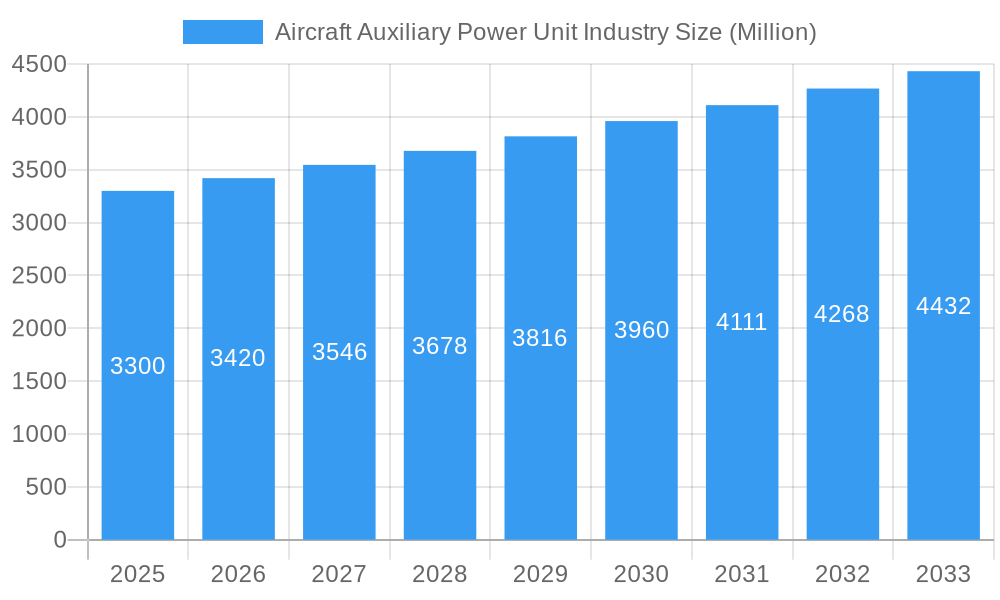
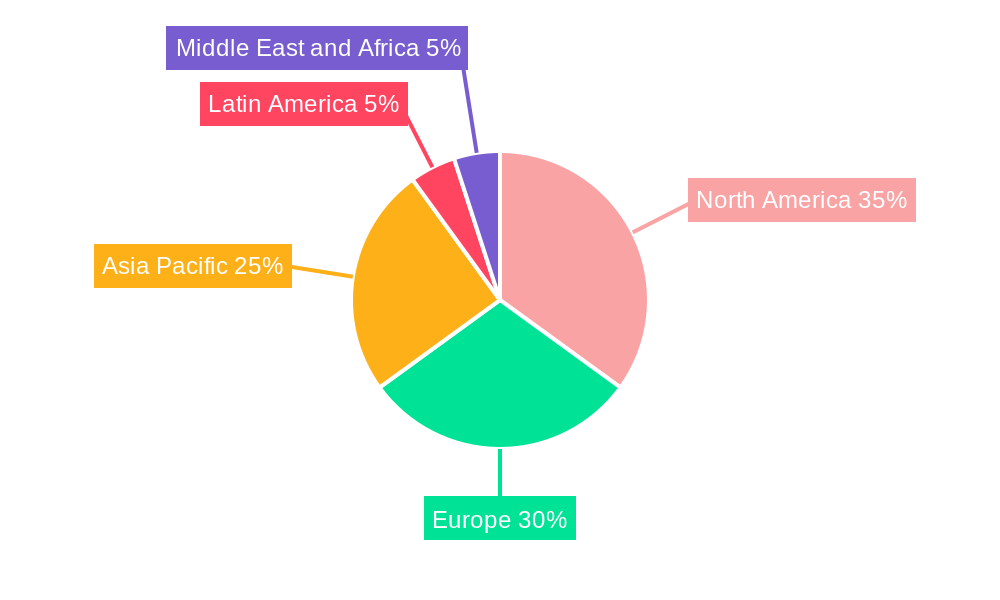
The Aircraft Auxiliary Power Unit (APU) market, valued at $3.30 billion in 2025, is projected to experience robust growth, driven by a Compound Annual Growth Rate (CAGR) of 3.79% from 2025 to 2033. This expansion is fueled by several key factors. The increasing demand for commercial air travel globally necessitates reliable and efficient APUs for ground power and in-flight emergency support. Furthermore, the burgeoning military aviation sector, coupled with the rise of unmanned aerial vehicles (UAVs), particularly in general aviation, significantly contributes to market growth. Technological advancements leading to lighter, more fuel-efficient, and environmentally friendly APUs are also driving adoption. The market is segmented by aircraft type (fixed-wing and rotary-wing), platform (commercial and military), and regional jet applications. While the exact contribution of each segment is not specified, a logical estimation suggests that commercial aviation holds the largest market share, followed by military and UAV segments. Regional variations exist, with North America and Europe anticipated to maintain substantial market shares due to their established aviation industries and higher aircraft density. However, the Asia-Pacific region is projected to witness the fastest growth rate driven by significant investments in airport infrastructure and rising air travel demand.
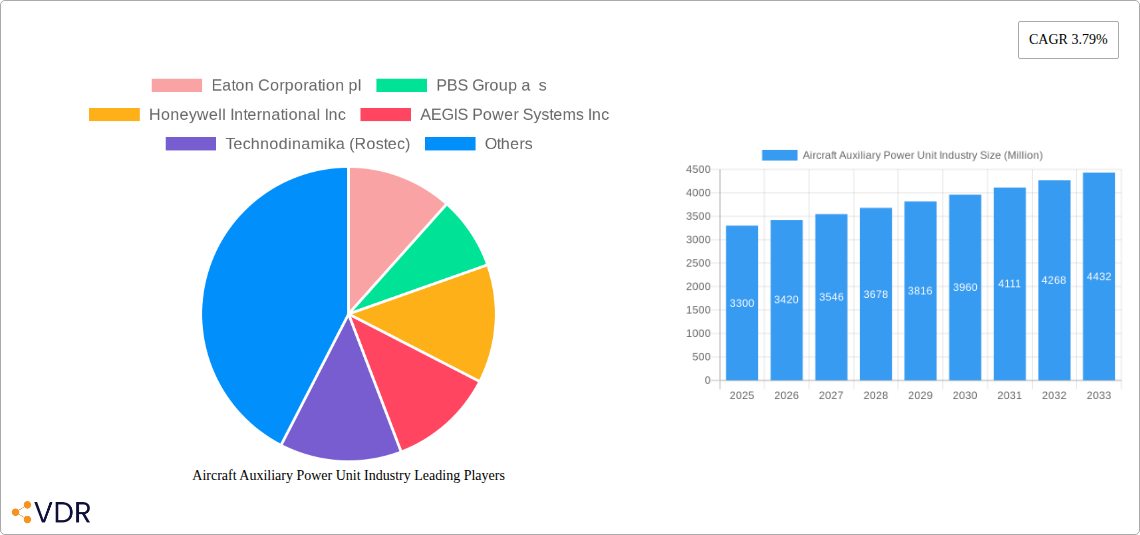
Aircraft Auxiliary Power Unit Industry Market Size (In Billion)
Despite positive growth projections, certain restraints exist. These may include the high initial investment costs associated with APU integration and maintenance, fluctuating fuel prices potentially impacting operational expenses, and stringent environmental regulations driving the development of more sustainable technologies which adds to costs and complexity. Nevertheless, continuous innovation within APU technology, particularly in areas like hybrid-electric and fuel-cell power solutions, is anticipated to mitigate these challenges and unlock further market expansion. The competitive landscape comprises both established players like Eaton Corporation, Honeywell, and Safran, and regional manufacturers. This competitive dynamic fosters innovation and keeps pricing competitive, further contributing to the market's overall growth. The forecast period of 2025-2033 offers considerable opportunities for industry participants to capitalize on technological advancements, evolving market demands and regional growth dynamics.
Aircraft Auxiliary Power Unit Industry Company Market Share
Aircraft Auxiliary Power Unit (APU) Industry Market Report: 2019-2033
This comprehensive report provides an in-depth analysis of the Aircraft Auxiliary Power Unit (APU) industry, encompassing market dynamics, growth trends, regional segmentation, product landscape, and key players. The study period covers 2019-2033, with a base year of 2025 and a forecast period of 2025-2033. The report leverages extensive market research and data analysis to deliver actionable insights for industry professionals, investors, and strategic decision-makers. The total market size is predicted to reach xx million units by 2033.
Aircraft Auxiliary Power Unit Industry Market Dynamics & Structure
The Aircraft Auxiliary Power Unit (APU) market is characterized by a moderate level of concentration, with key players like Eaton Corporation plc, Honeywell International Inc, and Safran SA holding significant market share. Technological innovation, driven by the demand for improved fuel efficiency, reduced emissions, and enhanced reliability, is a key driver. Stringent regulatory frameworks concerning emissions and safety standards further shape the market landscape. The industry faces competitive pressure from alternative power sources, but the inherent advantages of APUs in terms of operational flexibility and redundancy ensure continued market relevance. Mergers and acquisitions (M&A) activity has been relatively moderate in recent years, with approximately xx deals recorded between 2019 and 2024, representing a total value of xx million USD.
- Market Concentration: Moderately concentrated, with top 5 players holding approximately xx% market share in 2024.
- Technological Innovation: Focus on reducing emissions (e.g., adoption of electric APUs), enhancing fuel efficiency, and improving reliability through advanced materials and design.
- Regulatory Framework: Stringent safety and emission standards (e.g., CAEP/8, FAA regulations) influence APU design and certification.
- Competitive Substitutes: Limited direct substitutes, but competition exists from other power sources for specific applications (e.g., ground power units).
- M&A Trends: Moderate activity, with a focus on consolidating technological expertise and expanding market reach.
- Innovation Barriers: High certification costs, lengthy approval processes, and the need for extensive testing pose challenges to innovation.
Aircraft Auxiliary Power Unit Industry Growth Trends & Insights
The global APU market experienced a Compound Annual Growth Rate (CAGR) of xx% during the historical period (2019-2024), reaching a market size of xx million units in 2024. This growth is primarily attributed to the increasing demand for air travel, particularly in emerging economies. Technological advancements, such as the development of more fuel-efficient and environmentally friendly APUs, further boosted market expansion. The forecast period (2025-2033) anticipates a CAGR of xx%, driven by factors like the growth of the commercial aviation sector, the increasing adoption of APUs in unmanned aerial vehicles (UAVs), and the rising demand for regional jets and military aircraft. Market penetration of APUs in different aircraft segments is expected to increase from xx% in 2024 to xx% in 2033. The shift towards larger aircraft and the increasing adoption of fly-by-wire systems also contribute to the growth. Consumer preferences for enhanced comfort, safety, and fuel efficiency indirectly drive APU market demand.
Dominant Regions, Countries, or Segments in Aircraft Auxiliary Power Unit Industry
The North American region dominated the APU market in 2024, holding approximately xx% of the global market share, driven by a strong commercial aviation sector and significant investments in military aircraft. The Asia-Pacific region exhibits substantial growth potential, fueled by rapid economic growth and increasing air travel demand. Within segments, the commercial aviation sector, specifically large aircraft, represents the largest portion of the market, followed by regional jets and military aircraft. The fixed-wing aircraft segment holds a larger market share compared to the rotary-wing segment.
- North America: High market share driven by strong commercial aviation and military spending.
- Asia-Pacific: High growth potential due to rising air travel demand and economic expansion.
- Europe: Stable market with consistent demand driven by existing fleet upgrades and replacement.
- Commercial Aviation (Large Aircraft): Highest market share due to the large number of aircraft in service.
- Regional Jets: Significant growth driven by increased regional connectivity.
- Military Aircraft: Steady demand driven by defense spending and modernization programs.
Aircraft Auxiliary Power Unit Industry Product Landscape
The APU product landscape is characterized by a range of models designed to meet varying power requirements and aircraft types. These include gas turbine APUs, which are the dominant technology, and increasingly, hybrid-electric APUs representing a significant technological advancement. Manufacturers continuously improve APU performance metrics, focusing on higher power-to-weight ratios, reduced fuel consumption, and lower noise emissions. Unique selling propositions (USPs) include extended maintenance intervals, improved reliability, and advanced diagnostics capabilities.
Key Drivers, Barriers & Challenges in Aircraft Auxiliary Power Unit Industry
Key Drivers:
- Increasing air travel demand, particularly in emerging economies.
- Growth of the commercial aviation sector and expansion of air routes.
- Technological advancements leading to improved fuel efficiency, reduced emissions, and enhanced reliability.
- Stringent regulatory frameworks driving the adoption of cleaner and safer APUs.
Challenges and Restraints:
- High initial investment costs associated with APU procurement and integration.
- Complex certification processes and stringent regulatory requirements.
- Intense competition from established players, leading to price pressures.
- Supply chain disruptions and material cost volatility impacting production costs.
- xx% of APU manufacturers faced significant supply chain challenges in 2024, leading to xx% increase in production lead times.
Emerging Opportunities in Aircraft Auxiliary Power Unit Industry
- Expanding demand for APUs in UAVs and general aviation aircraft.
- Growing interest in hybrid-electric and all-electric APUs to meet sustainability goals.
- Opportunities in developing markets with rapidly expanding air travel sectors.
- Development of advanced diagnostic and predictive maintenance solutions for improved APU operational efficiency.
Growth Accelerators in the Aircraft Auxiliary Power Unit Industry
The long-term growth of the APU industry is fueled by technological breakthroughs in hybrid-electric and fully electric APU systems, enabling significant fuel savings and reduced emissions. Strategic partnerships between APU manufacturers and aircraft OEMs ensure seamless integration and optimize performance. Market expansion strategies focusing on emerging markets and niche segments such as UAVs and general aviation also contribute to sustained growth.
Key Players Shaping the Aircraft Auxiliary Power Unit Industry Market
- Eaton Corporation plc
- PBS Group a s
- Honeywell International Inc
- AEGIS Power Systems Inc
- Technodinamika (Rostec)
- Pratt & Whitney (RTX Corporation)
- Safran SA
- Rolls-Royce plc
- Motor Sich JSC
- JSC NPP Aerosila
Notable Milestones in Aircraft Auxiliary Power Unit Industry Sector
- 2021 (Q3): Eaton Corporation plc launched its next-generation APU with enhanced fuel efficiency.
- 2022 (Q1): Honeywell International Inc. and Safran SA announced a strategic partnership to develop hybrid-electric APU technology.
- 2023 (Q4): Rolls-Royce plc secured a major contract for APU supply to a leading commercial aircraft manufacturer.
- 2024 (Q2): xx new APU models were certified and entered into service.
In-Depth Aircraft Auxiliary Power Unit Industry Market Outlook
The APU market is poised for robust growth over the forecast period, driven by ongoing technological advancements, increasing air travel demand, and the growing focus on sustainable aviation. Strategic opportunities exist for companies focusing on innovation in hybrid-electric and fully electric APUs, as well as those leveraging advanced predictive maintenance and digital solutions to optimize APU operations. The focus on enhanced fuel efficiency, reduced emissions and increased reliability will continue to shape the industry. Expansion into emerging markets and the development of specialized APUs for UAVs and other niche segments will also contribute to sustained market expansion.
Aircraft Auxiliary Power Unit Industry Segmentation
-
1. Aircraft Type
- 1.1. Fixed-Wing
- 1.2. Rotary-Wing
Aircraft Auxiliary Power Unit Industry Segmentation By Geography
-
1. North America
- 1.1. United States
- 1.2. Canada
-
2. Europe
- 2.1. United Kingdom
- 2.2. France
- 2.3. Germany
- 2.4. Russia
- 2.5. Italy
- 2.6. Rest of Europe
-
3. Asia Pacific
- 3.1. China
- 3.2. India
- 3.3. Japan
- 3.4. Australia
- 3.5. Rest of Asia Pacific
-
4. Latin America
- 4.1. Brazil
- 4.2. Mexico
- 4.3. Rest of Latin America
-
5. Middle East and Africa
- 5.1. United Arab Emirates
- 5.2. Saudi Arabia
- 5.3. Egypt
- 5.4. Rest of Middle East and Africa
Aircraft Auxiliary Power Unit Industry Regional Market Share
Geographic Coverage of Aircraft Auxiliary Power Unit Industry
Aircraft Auxiliary Power Unit Industry REPORT HIGHLIGHTS
| Aspects | Details |
|---|---|
| Study Period | 2020-2034 |
| Base Year | 2025 |
| Estimated Year | 2026 |
| Forecast Period | 2026-2034 |
| Historical Period | 2020-2025 |
| Growth Rate | CAGR of 3.79% from 2020-2034 |
| Segmentation |
|
Table of Contents
- 1. Introduction
- 1.1. Research Scope
- 1.2. Market Segmentation
- 1.3. Research Objective
- 1.4. Definitions and Assumptions
- 2. Executive Summary
- 2.1. Market Snapshot
- 3. Market Dynamics
- 3.1. Market Drivers
- 3.2. Market Restrains
- 3.3. Market Trends
- 3.4. Market Opportunities
- 4. Market Factor Analysis
- 4.1. Porters Five Forces
- 4.1.1. Bargaining Power of Suppliers
- 4.1.2. Bargaining Power of Buyers
- 4.1.3. Threat of New Entrants
- 4.1.4. Threat of Substitutes
- 4.1.5. Competitive Rivalry
- 4.2. PESTEL analysis
- 4.3. BCG Analysis
- 4.3.1. Stars (High Growth, High Market Share)
- 4.3.2. Cash Cows (Low Growth, High Market Share)
- 4.3.3. Question Mark (High Growth, Low Market Share)
- 4.3.4. Dogs (Low Growth, Low Market Share)
- 4.4. Ansoff Matrix Analysis
- 4.5. Supply Chain Analysis
- 4.6. Regulatory Landscape
- 4.7. Current Market Potential and Opportunity Assessment (TAM–SAM–SOM Framework)
- 4.8. VDR Analyst Note
- 4.1. Porters Five Forces
- 5. Market Analysis, Insights and Forecast 2021-2033
- 5.1. Market Analysis, Insights and Forecast - by Aircraft Type
- 5.1.1. Fixed-Wing
- 5.1.2. Rotary-Wing
- 5.2. Market Analysis, Insights and Forecast - by Region
- 5.2.1. North America
- 5.2.2. Europe
- 5.2.3. Asia Pacific
- 5.2.4. Latin America
- 5.2.5. Middle East and Africa
- 5.1. Market Analysis, Insights and Forecast - by Aircraft Type
- 6. Global Aircraft Auxiliary Power Unit Industry Analysis, Insights and Forecast, 2021-2033
- 6.1. Market Analysis, Insights and Forecast - by Aircraft Type
- 6.1.1. Fixed-Wing
- 6.1.2. Rotary-Wing
- 6.1. Market Analysis, Insights and Forecast - by Aircraft Type
- 7. North America Aircraft Auxiliary Power Unit Industry Analysis, Insights and Forecast, 2021-2033
- 7.1. Market Analysis, Insights and Forecast - by Aircraft Type
- 7.1.1. Fixed-Wing
- 7.1.2. Rotary-Wing
- 7.1. Market Analysis, Insights and Forecast - by Aircraft Type
- 8. Europe Aircraft Auxiliary Power Unit Industry Analysis, Insights and Forecast, 2021-2033
- 8.1. Market Analysis, Insights and Forecast - by Aircraft Type
- 8.1.1. Fixed-Wing
- 8.1.2. Rotary-Wing
- 8.1. Market Analysis, Insights and Forecast - by Aircraft Type
- 9. Asia Pacific Aircraft Auxiliary Power Unit Industry Analysis, Insights and Forecast, 2021-2033
- 9.1. Market Analysis, Insights and Forecast - by Aircraft Type
- 9.1.1. Fixed-Wing
- 9.1.2. Rotary-Wing
- 9.1. Market Analysis, Insights and Forecast - by Aircraft Type
- 10. Latin America Aircraft Auxiliary Power Unit Industry Analysis, Insights and Forecast, 2021-2033
- 10.1. Market Analysis, Insights and Forecast - by Aircraft Type
- 10.1.1. Fixed-Wing
- 10.1.2. Rotary-Wing
- 10.1. Market Analysis, Insights and Forecast - by Aircraft Type
- 11. Middle East and Africa Aircraft Auxiliary Power Unit Industry Analysis, Insights and Forecast, 2021-2033
- 11.1. Market Analysis, Insights and Forecast - by Aircraft Type
- 11.1.1. Fixed-Wing
- 11.1.2. Rotary-Wing
- 11.1. Market Analysis, Insights and Forecast - by Aircraft Type
- 12. Competitive Analysis
- 12.1. Company Profiles
- 12.1.1 Eaton Corporation pl
- 12.1.1.1. Company Overview
- 12.1.1.2. Products
- 12.1.1.3. Company Financials
- 12.1.1.4. SWOT Analysis
- 12.1.2 PBS Group a s
- 12.1.2.1. Company Overview
- 12.1.2.2. Products
- 12.1.2.3. Company Financials
- 12.1.2.4. SWOT Analysis
- 12.1.3 Honeywell International Inc
- 12.1.3.1. Company Overview
- 12.1.3.2. Products
- 12.1.3.3. Company Financials
- 12.1.3.4. SWOT Analysis
- 12.1.4 AEGIS Power Systems Inc
- 12.1.4.1. Company Overview
- 12.1.4.2. Products
- 12.1.4.3. Company Financials
- 12.1.4.4. SWOT Analysis
- 12.1.5 Technodinamika (Rostec)
- 12.1.5.1. Company Overview
- 12.1.5.2. Products
- 12.1.5.3. Company Financials
- 12.1.5.4. SWOT Analysis
- 12.1.6 Pratt & Whitney (RTX Corporation)
- 12.1.6.1. Company Overview
- 12.1.6.2. Products
- 12.1.6.3. Company Financials
- 12.1.6.4. SWOT Analysis
- 12.1.7 Safran SA
- 12.1.7.1. Company Overview
- 12.1.7.2. Products
- 12.1.7.3. Company Financials
- 12.1.7.4. SWOT Analysis
- 12.1.8 Rolls-Royce plc
- 12.1.8.1. Company Overview
- 12.1.8.2. Products
- 12.1.8.3. Company Financials
- 12.1.8.4. SWOT Analysis
- 12.1.9 Motor Sich JSC
- 12.1.9.1. Company Overview
- 12.1.9.2. Products
- 12.1.9.3. Company Financials
- 12.1.9.4. SWOT Analysis
- 12.1.10 JSC NPP Aerosila
- 12.1.10.1. Company Overview
- 12.1.10.2. Products
- 12.1.10.3. Company Financials
- 12.1.10.4. SWOT Analysis
- 12.1.1 Eaton Corporation pl
- 12.2. Market Entropy
- 12.2.1 Company's Key Areas Served
- 12.2.2 Recent Developments
- 12.3. Company Market Share Analysis 2025
- 12.3.1 Top 5 Companies Market Share Analysis
- 12.3.2 Top 3 Companies Market Share Analysis
- 12.4. List of Potential Customers
- 13. Research Methodology
List of Figures
- Figure 1: Global Aircraft Auxiliary Power Unit Industry Revenue Breakdown (Million, %) by Region 2025 & 2033
- Figure 2: North America Aircraft Auxiliary Power Unit Industry Revenue (Million), by Aircraft Type 2025 & 2033
- Figure 3: North America Aircraft Auxiliary Power Unit Industry Revenue Share (%), by Aircraft Type 2025 & 2033
- Figure 4: North America Aircraft Auxiliary Power Unit Industry Revenue (Million), by Country 2025 & 2033
- Figure 5: North America Aircraft Auxiliary Power Unit Industry Revenue Share (%), by Country 2025 & 2033
- Figure 6: Europe Aircraft Auxiliary Power Unit Industry Revenue (Million), by Aircraft Type 2025 & 2033
- Figure 7: Europe Aircraft Auxiliary Power Unit Industry Revenue Share (%), by Aircraft Type 2025 & 2033
- Figure 8: Europe Aircraft Auxiliary Power Unit Industry Revenue (Million), by Country 2025 & 2033
- Figure 9: Europe Aircraft Auxiliary Power Unit Industry Revenue Share (%), by Country 2025 & 2033
- Figure 10: Asia Pacific Aircraft Auxiliary Power Unit Industry Revenue (Million), by Aircraft Type 2025 & 2033
- Figure 11: Asia Pacific Aircraft Auxiliary Power Unit Industry Revenue Share (%), by Aircraft Type 2025 & 2033
- Figure 12: Asia Pacific Aircraft Auxiliary Power Unit Industry Revenue (Million), by Country 2025 & 2033
- Figure 13: Asia Pacific Aircraft Auxiliary Power Unit Industry Revenue Share (%), by Country 2025 & 2033
- Figure 14: Latin America Aircraft Auxiliary Power Unit Industry Revenue (Million), by Aircraft Type 2025 & 2033
- Figure 15: Latin America Aircraft Auxiliary Power Unit Industry Revenue Share (%), by Aircraft Type 2025 & 2033
- Figure 16: Latin America Aircraft Auxiliary Power Unit Industry Revenue (Million), by Country 2025 & 2033
- Figure 17: Latin America Aircraft Auxiliary Power Unit Industry Revenue Share (%), by Country 2025 & 2033
- Figure 18: Middle East and Africa Aircraft Auxiliary Power Unit Industry Revenue (Million), by Aircraft Type 2025 & 2033
- Figure 19: Middle East and Africa Aircraft Auxiliary Power Unit Industry Revenue Share (%), by Aircraft Type 2025 & 2033
- Figure 20: Middle East and Africa Aircraft Auxiliary Power Unit Industry Revenue (Million), by Country 2025 & 2033
- Figure 21: Middle East and Africa Aircraft Auxiliary Power Unit Industry Revenue Share (%), by Country 2025 & 2033
List of Tables
- Table 1: Global Aircraft Auxiliary Power Unit Industry Revenue Million Forecast, by Aircraft Type 2020 & 2033
- Table 2: Global Aircraft Auxiliary Power Unit Industry Revenue Million Forecast, by Region 2020 & 2033
- Table 3: Global Aircraft Auxiliary Power Unit Industry Revenue Million Forecast, by Aircraft Type 2020 & 2033
- Table 4: Global Aircraft Auxiliary Power Unit Industry Revenue Million Forecast, by Country 2020 & 2033
- Table 5: United States Aircraft Auxiliary Power Unit Industry Revenue (Million) Forecast, by Application 2020 & 2033
- Table 6: Canada Aircraft Auxiliary Power Unit Industry Revenue (Million) Forecast, by Application 2020 & 2033
- Table 7: Global Aircraft Auxiliary Power Unit Industry Revenue Million Forecast, by Aircraft Type 2020 & 2033
- Table 8: Global Aircraft Auxiliary Power Unit Industry Revenue Million Forecast, by Country 2020 & 2033
- Table 9: United Kingdom Aircraft Auxiliary Power Unit Industry Revenue (Million) Forecast, by Application 2020 & 2033
- Table 10: France Aircraft Auxiliary Power Unit Industry Revenue (Million) Forecast, by Application 2020 & 2033
- Table 11: Germany Aircraft Auxiliary Power Unit Industry Revenue (Million) Forecast, by Application 2020 & 2033
- Table 12: Russia Aircraft Auxiliary Power Unit Industry Revenue (Million) Forecast, by Application 2020 & 2033
- Table 13: Italy Aircraft Auxiliary Power Unit Industry Revenue (Million) Forecast, by Application 2020 & 2033
- Table 14: Rest of Europe Aircraft Auxiliary Power Unit Industry Revenue (Million) Forecast, by Application 2020 & 2033
- Table 15: Global Aircraft Auxiliary Power Unit Industry Revenue Million Forecast, by Aircraft Type 2020 & 2033
- Table 16: Global Aircraft Auxiliary Power Unit Industry Revenue Million Forecast, by Country 2020 & 2033
- Table 17: China Aircraft Auxiliary Power Unit Industry Revenue (Million) Forecast, by Application 2020 & 2033
- Table 18: India Aircraft Auxiliary Power Unit Industry Revenue (Million) Forecast, by Application 2020 & 2033
- Table 19: Japan Aircraft Auxiliary Power Unit Industry Revenue (Million) Forecast, by Application 2020 & 2033
- Table 20: Australia Aircraft Auxiliary Power Unit Industry Revenue (Million) Forecast, by Application 2020 & 2033
- Table 21: Rest of Asia Pacific Aircraft Auxiliary Power Unit Industry Revenue (Million) Forecast, by Application 2020 & 2033
- Table 22: Global Aircraft Auxiliary Power Unit Industry Revenue Million Forecast, by Aircraft Type 2020 & 2033
- Table 23: Global Aircraft Auxiliary Power Unit Industry Revenue Million Forecast, by Country 2020 & 2033
- Table 24: Brazil Aircraft Auxiliary Power Unit Industry Revenue (Million) Forecast, by Application 2020 & 2033
- Table 25: Mexico Aircraft Auxiliary Power Unit Industry Revenue (Million) Forecast, by Application 2020 & 2033
- Table 26: Rest of Latin America Aircraft Auxiliary Power Unit Industry Revenue (Million) Forecast, by Application 2020 & 2033
- Table 27: Global Aircraft Auxiliary Power Unit Industry Revenue Million Forecast, by Aircraft Type 2020 & 2033
- Table 28: Global Aircraft Auxiliary Power Unit Industry Revenue Million Forecast, by Country 2020 & 2033
- Table 29: United Arab Emirates Aircraft Auxiliary Power Unit Industry Revenue (Million) Forecast, by Application 2020 & 2033
- Table 30: Saudi Arabia Aircraft Auxiliary Power Unit Industry Revenue (Million) Forecast, by Application 2020 & 2033
- Table 31: Egypt Aircraft Auxiliary Power Unit Industry Revenue (Million) Forecast, by Application 2020 & 2033
- Table 32: Rest of Middle East and Africa Aircraft Auxiliary Power Unit Industry Revenue (Million) Forecast, by Application 2020 & 2033
Frequently Asked Questions
1. What is the projected Compound Annual Growth Rate (CAGR) of the Aircraft Auxiliary Power Unit Industry?
The projected CAGR is approximately 3.79%.
2. Which companies are prominent players in the Aircraft Auxiliary Power Unit Industry?
Key companies in the market include Eaton Corporation pl, PBS Group a s, Honeywell International Inc, AEGIS Power Systems Inc, Technodinamika (Rostec), Pratt & Whitney (RTX Corporation), Safran SA, Rolls-Royce plc, Motor Sich JSC, JSC NPP Aerosila.
3. What are the main segments of the Aircraft Auxiliary Power Unit Industry?
The market segments include Aircraft Type.
4. Can you provide details about the market size?
The market size is estimated to be USD 3.30 Million as of 2022.
5. What are some drivers contributing to market growth?
N/A
6. What are the notable trends driving market growth?
Commercial Aviation Segment Holds Highest Shares in the Market.
7. Are there any restraints impacting market growth?
N/A
8. Can you provide examples of recent developments in the market?
N/A
9. What pricing options are available for accessing the report?
Pricing options include single-user, multi-user, and enterprise licenses priced at USD 4750, USD 5250, and USD 8750 respectively.
10. Is the market size provided in terms of value or volume?
The market size is provided in terms of value, measured in Million.
11. Are there any specific market keywords associated with the report?
Yes, the market keyword associated with the report is "Aircraft Auxiliary Power Unit Industry," which aids in identifying and referencing the specific market segment covered.
12. How do I determine which pricing option suits my needs best?
The pricing options vary based on user requirements and access needs. Individual users may opt for single-user licenses, while businesses requiring broader access may choose multi-user or enterprise licenses for cost-effective access to the report.
13. Are there any additional resources or data provided in the Aircraft Auxiliary Power Unit Industry report?
While the report offers comprehensive insights, it's advisable to review the specific contents or supplementary materials provided to ascertain if additional resources or data are available.
14. How can I stay updated on further developments or reports in the Aircraft Auxiliary Power Unit Industry?
To stay informed about further developments, trends, and reports in the Aircraft Auxiliary Power Unit Industry, consider subscribing to industry newsletters, following relevant companies and organizations, or regularly checking reputable industry news sources and publications.
Methodology
Step 1 - Identification of Relevant Samples Size from Population Database


Step 2 - Approaches for Defining Global Market Size (Value, Volume* & Price*)

Note*: In applicable scenarios
Step 3 - Data Sources
Primary Research
- Web Analytics
- Survey Reports
- Research Institute
- Latest Research Reports
- Opinion Leaders
Secondary Research
- Annual Reports
- White Paper
- Latest Press Release
- Industry Association
- Paid Database
- Investor Presentations

Step 4 - Data Triangulation
Involves using different sources of information in order to increase the validity of a study
These sources are likely to be stakeholders in a program - participants, other researchers, program staff, other community members, and so on.
Then we put all data in single framework & apply various statistical tools to find out the dynamic on the market.
During the analysis stage, feedback from the stakeholder groups would be compared to determine areas of agreement as well as areas of divergence