

Key Insights
The global air starter market, valued at 416.18 million in 2025, is projected for significant expansion with a compound annual growth rate (CAGR) of 4.75% from 2025 to 2033. Key growth drivers include escalating demand for dependable and efficient starting systems in the oil & gas, power generation, and mining industries. Industrial modernization and automation initiatives further propel this growth by necessitating durable, high-performance air starters. Technological advancements in air starter design, focusing on enhanced efficiency and reduced emissions, are also stimulating adoption. Global infrastructure investments, particularly in emerging economies, contribute positively to the market outlook. The market is segmented by type (Vane Air Starters and Turbine Air Starters) and end-user (Oil & Gas, Power Generation, Mining, and Others). While Vane Air Starters currently dominate due to cost-effectiveness, Turbine Air Starters are gaining prominence for their superior performance in demanding environments. Geographic expansion is anticipated across all regions, with North America, Europe, and Asia-Pacific expected to lead due to concentrated industrial activity.
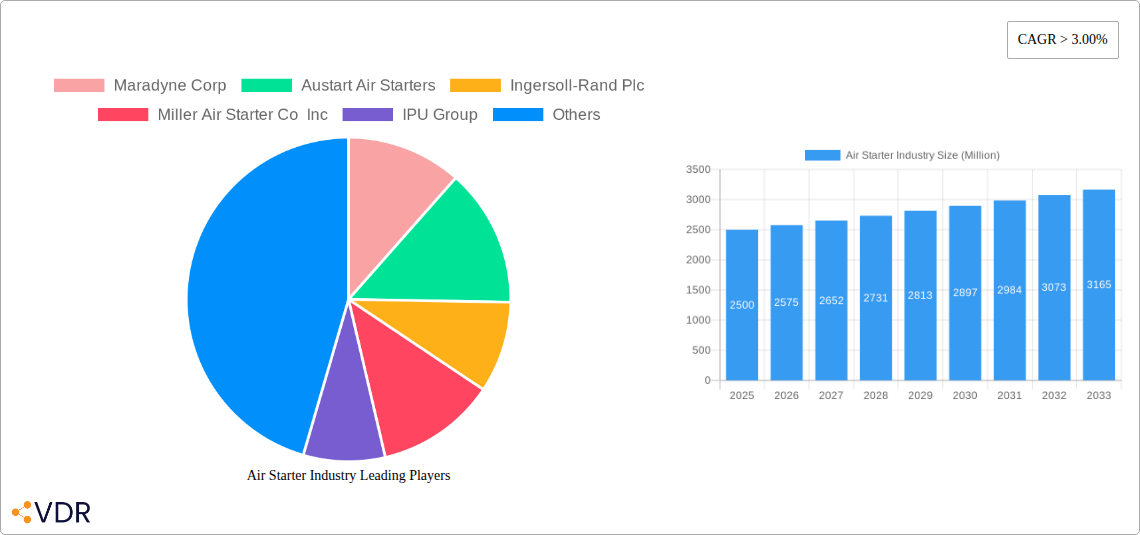
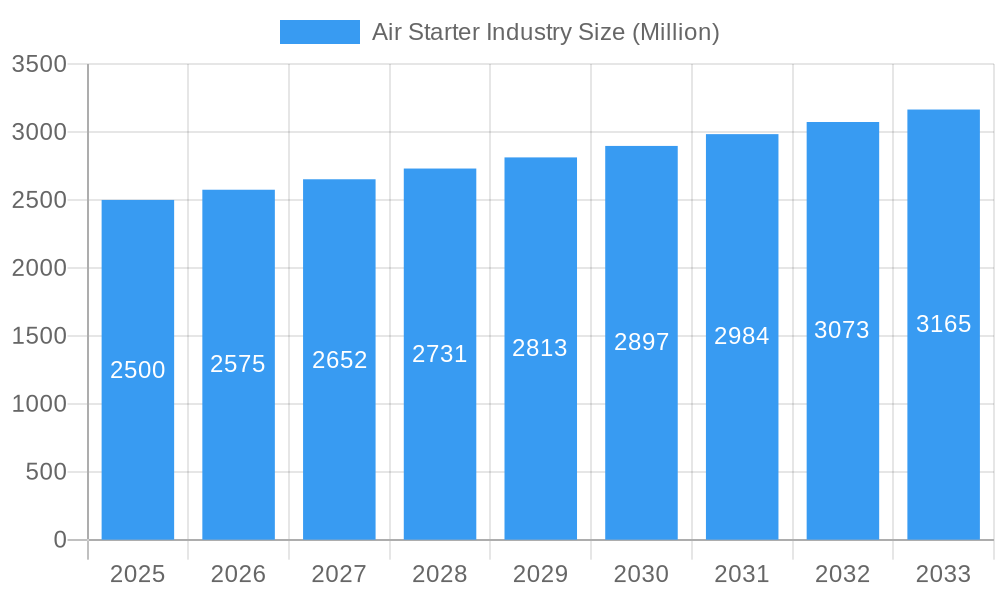
Air Starter Industry Market Size (In Million)
However, market growth is subject to certain restraints. High initial investment costs for air starter systems, especially advanced turbine models, may limit adoption, particularly for smaller operators. Stringent environmental regulations concerning emissions and the increasing focus on sustainable technologies could also influence the adoption of specific air starter types. Intensified competition among established global players such as Ingersoll-Rand Plc, Maradyne Corp, and Austart Air Starters, alongside regional competitors, will shape a dynamic market landscape. Despite these challenges, the air starter market outlook remains optimistic, driven by the aforementioned growth factors and the persistent need for reliable industrial equipment.
Air Starter Industry Company Market Share
This comprehensive analysis of the Air Starter Industry covers market dynamics, growth trends, regional segmentation, product offerings, key industry participants, and future projections. The report encompasses the period 2019-2033, with 2025 serving as the base and estimated year. The forecast period is 2025-2033, and the historical period is 2019-2024. Market values are presented in Million units.
Air Starter Industry Market Dynamics & Structure
The air starter market, valued at xx Million units in 2025, exhibits a moderately concentrated structure with key players holding significant market shares. Technological innovation, driven by the need for enhanced efficiency and durability in demanding environments, is a crucial market driver. Stringent emission regulations and safety standards imposed by governments globally shape product development and adoption patterns. Competitive pressures from substitute technologies, such as electric starters, are notable, particularly in certain end-user segments. The market is influenced by end-user demographics, including the growth of the oil & gas, power generation, and mining sectors, and further influenced by mergers and acquisitions (M&A) activities aiming for market consolidation and technological advancements.
- Market Concentration: Moderate, with top 5 players holding approximately xx% market share in 2025.
- Technological Innovation: Focus on enhancing starting power, durability, and reducing emissions.
- Regulatory Framework: Stringent emission and safety standards influence product design and adoption.
- Competitive Substitutes: Electric starters pose a challenge, particularly in certain applications.
- End-User Demographics: Growth in oil & gas, power generation, and mining fuels market demand.
- M&A Activity: xx M&A deals recorded between 2019-2024, indicating consolidation trends.
Air Starter Industry Growth Trends & Insights
The global air starter market witnessed robust growth during the historical period (2019-2024), expanding at a CAGR of xx%. This growth is attributed to increasing demand from key end-use sectors, particularly oil & gas and power generation. Technological advancements, including the introduction of more efficient and reliable air starters, have also contributed significantly to market expansion. Adoption rates have shown a steady increase, driven by factors like improved fuel efficiency and reduced maintenance costs. The market is witnessing technological disruptions such as the development of lighter and more compact air starters, tailored for specific applications. Consumer behavior shifts are influenced by a greater emphasis on safety, reliability, and environmental considerations, leading to a preference for advanced air starter models. The market is projected to continue its growth trajectory during the forecast period (2025-2033), reaching an estimated value of xx Million units by 2033.
Dominant Regions, Countries, or Segments in Air Starter Industry
North America and Europe are currently the leading regions in the air starter market, driven by strong demand from the oil & gas and power generation sectors. Within these regions, the United States and Germany hold prominent positions, benefitting from well-established industrial infrastructure and robust economic activities. The vane air starter segment dominates the market in terms of volume, due to its cost-effectiveness and wide applicability. However, the turbine air starter segment is witnessing faster growth, driven by its superior performance in demanding applications, such as large engine starts. The oil & gas industry remains the largest end-user segment globally, followed by power generation and mining.
- Key Regional Drivers: Strong industrial base, high infrastructure investment, supportive government policies.
- Country-Specific Factors: Favorable regulatory environment, presence of major industry players.
- Segment-Specific Drivers: Cost-effectiveness (Vane), superior performance (Turbine), robust demand from specific industries.
Air Starter Industry Product Landscape
The air starter market offers a range of products, categorized primarily by type (vane and turbine) and designed for diverse applications across various industries. Technological advancements are focused on enhancing starting torque, reducing weight and size, improving durability, and integrating advanced features like improved seals and noise reduction mechanisms. Key performance metrics include starting torque, operating pressure, and service life. Unique selling propositions frequently center around energy efficiency, operational reliability, and ease of maintenance.
Key Drivers, Barriers & Challenges in Air Starter Industry
Key Drivers:
- Rising demand from Oil & Gas, Power Generation, and Mining sectors.
- Technological advancements leading to improved efficiency and durability.
- Growing emphasis on safety and environmental regulations.
Challenges and Restraints:
- Competition from alternative starting technologies (electric starters).
- Fluctuations in raw material prices impacting manufacturing costs.
- Supply chain disruptions affecting production and delivery timelines. This resulted in a xx% decrease in production in 2022.
Emerging Opportunities in Air Starter Industry
- Expansion into developing economies with growing industrialization.
- Development of specialized air starters for emerging applications (e.g., renewable energy).
- Focus on creating lighter, more compact, and energy-efficient models.
Growth Accelerators in the Air Starter Industry
Technological breakthroughs in materials science and design are driving the development of more efficient and durable air starters. Strategic partnerships between air starter manufacturers and engine manufacturers facilitate the seamless integration of advanced technologies. Expanding into new geographic markets and diversifying into high-growth end-user segments will fuel market expansion.
Key Players Shaping the Air Starter Industry Market
- Maradyne Corp
- Austart Air Starters
- Ingersoll-Rand Plc
- Miller Air Starter Co Inc
- IPU Group
- Multi Torque Industries Pty Ltd
- The Rowland Company
- KH Equipment Pty Ltd
- Air Starter Components
- Gali Group
Notable Milestones in Air Starter Industry Sector
- 2020: Introduction of a new generation of vane air starters with improved efficiency by Maradyne Corp.
- 2022: Ingersoll-Rand Plc acquires a smaller air starter manufacturer, expanding its market share.
- 2023: Several manufacturers launch new air starters compliant with stricter emission regulations.
In-Depth Air Starter Industry Market Outlook
The air starter market is poised for sustained growth, driven by continued expansion in key end-user sectors and ongoing technological advancements. Strategic opportunities exist in developing specialized air starters for niche applications and penetrating emerging markets. The increasing focus on sustainability and environmental regulations will further drive the adoption of more efficient and eco-friendly air starter technologies. The market is expected to reach xx Million units by 2033, representing a significant expansion compared to the 2025 market size.
Air Starter Industry Segmentation
-
1. Type
- 1.1. Vane Air Starter
- 1.2. Turbine Air Starter
-
2. End-User
- 2.1. Oil & Gas
- 2.2. Power Generation
- 2.3. Mining
- 2.4. Others
Air Starter Industry Segmentation By Geography
- 1. North America
- 2. Asia Pacific
- 3. Europe
- 4. South America
- 5. Middle East and Africa
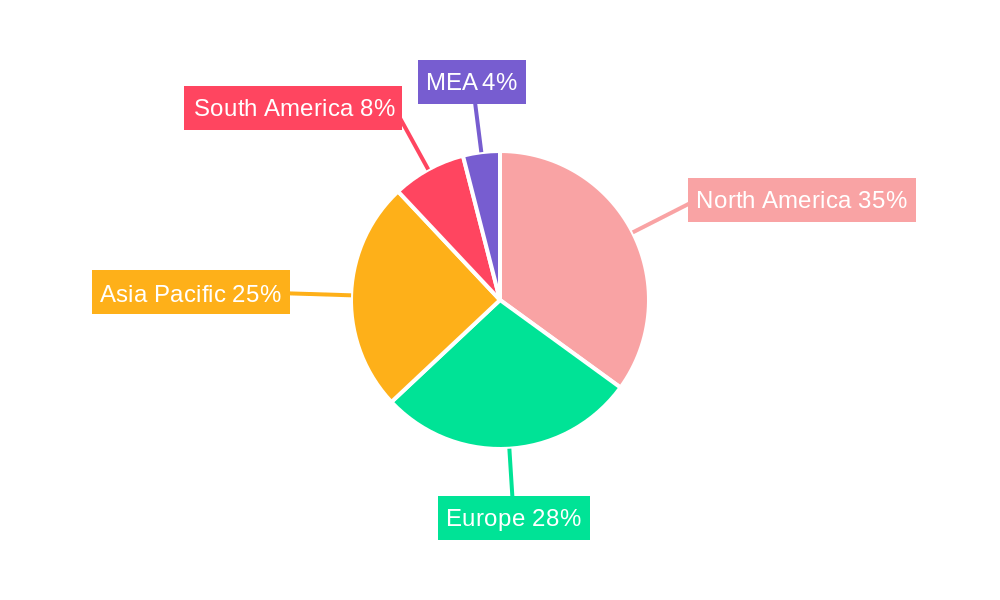
Air Starter Industry Regional Market Share
Geographic Coverage of Air Starter Industry
Air Starter Industry REPORT HIGHLIGHTS
| Aspects | Details |
|---|---|
| Study Period | 2020-2034 |
| Base Year | 2025 |
| Estimated Year | 2026 |
| Forecast Period | 2026-2034 |
| Historical Period | 2020-2025 |
| Growth Rate | CAGR of 4.75% from 2020-2034 |
| Segmentation |
|
Table of Contents
- 1. Introduction
- 1.1. Research Scope
- 1.2. Market Segmentation
- 1.3. Research Objective
- 1.4. Definitions and Assumptions
- 2. Executive Summary
- 2.1. Market Snapshot
- 3. Market Dynamics
- 3.1. Market Drivers
- 3.2. Market Restrains
- 3.3. Market Trends
- 3.4. Market Opportunities
- 4. Market Factor Analysis
- 4.1. Porters Five Forces
- 4.1.1. Bargaining Power of Suppliers
- 4.1.2. Bargaining Power of Buyers
- 4.1.3. Threat of New Entrants
- 4.1.4. Threat of Substitutes
- 4.1.5. Competitive Rivalry
- 4.2. PESTEL analysis
- 4.3. BCG Analysis
- 4.3.1. Stars (High Growth, High Market Share)
- 4.3.2. Cash Cows (Low Growth, High Market Share)
- 4.3.3. Question Mark (High Growth, Low Market Share)
- 4.3.4. Dogs (Low Growth, Low Market Share)
- 4.4. Ansoff Matrix Analysis
- 4.5. Supply Chain Analysis
- 4.6. Regulatory Landscape
- 4.7. Current Market Potential and Opportunity Assessment (TAM–SAM–SOM Framework)
- 4.8. VDR Analyst Note
- 4.1. Porters Five Forces
- 5. Market Analysis, Insights and Forecast 2021-2033
- 5.1. Market Analysis, Insights and Forecast - by Type
- 5.1.1. Vane Air Starter
- 5.1.2. Turbine Air Starter
- 5.2. Market Analysis, Insights and Forecast - by End-User
- 5.2.1. Oil & Gas
- 5.2.2. Power Generation
- 5.2.3. Mining
- 5.2.4. Others
- 5.3. Market Analysis, Insights and Forecast - by Region
- 5.3.1. North America
- 5.3.2. Asia Pacific
- 5.3.3. Europe
- 5.3.4. South America
- 5.3.5. Middle East and Africa
- 5.1. Market Analysis, Insights and Forecast - by Type
- 6. Global Air Starter Industry Analysis, Insights and Forecast, 2021-2033
- 6.1. Market Analysis, Insights and Forecast - by Type
- 6.1.1. Vane Air Starter
- 6.1.2. Turbine Air Starter
- 6.2. Market Analysis, Insights and Forecast - by End-User
- 6.2.1. Oil & Gas
- 6.2.2. Power Generation
- 6.2.3. Mining
- 6.2.4. Others
- 6.1. Market Analysis, Insights and Forecast - by Type
- 7. North America Air Starter Industry Analysis, Insights and Forecast, 2021-2033
- 7.1. Market Analysis, Insights and Forecast - by Type
- 7.1.1. Vane Air Starter
- 7.1.2. Turbine Air Starter
- 7.2. Market Analysis, Insights and Forecast - by End-User
- 7.2.1. Oil & Gas
- 7.2.2. Power Generation
- 7.2.3. Mining
- 7.2.4. Others
- 7.1. Market Analysis, Insights and Forecast - by Type
- 8. Asia Pacific Air Starter Industry Analysis, Insights and Forecast, 2021-2033
- 8.1. Market Analysis, Insights and Forecast - by Type
- 8.1.1. Vane Air Starter
- 8.1.2. Turbine Air Starter
- 8.2. Market Analysis, Insights and Forecast - by End-User
- 8.2.1. Oil & Gas
- 8.2.2. Power Generation
- 8.2.3. Mining
- 8.2.4. Others
- 8.1. Market Analysis, Insights and Forecast - by Type
- 9. Europe Air Starter Industry Analysis, Insights and Forecast, 2021-2033
- 9.1. Market Analysis, Insights and Forecast - by Type
- 9.1.1. Vane Air Starter
- 9.1.2. Turbine Air Starter
- 9.2. Market Analysis, Insights and Forecast - by End-User
- 9.2.1. Oil & Gas
- 9.2.2. Power Generation
- 9.2.3. Mining
- 9.2.4. Others
- 9.1. Market Analysis, Insights and Forecast - by Type
- 10. South America Air Starter Industry Analysis, Insights and Forecast, 2021-2033
- 10.1. Market Analysis, Insights and Forecast - by Type
- 10.1.1. Vane Air Starter
- 10.1.2. Turbine Air Starter
- 10.2. Market Analysis, Insights and Forecast - by End-User
- 10.2.1. Oil & Gas
- 10.2.2. Power Generation
- 10.2.3. Mining
- 10.2.4. Others
- 10.1. Market Analysis, Insights and Forecast - by Type
- 11. Middle East and Africa Air Starter Industry Analysis, Insights and Forecast, 2021-2033
- 11.1. Market Analysis, Insights and Forecast - by Type
- 11.1.1. Vane Air Starter
- 11.1.2. Turbine Air Starter
- 11.2. Market Analysis, Insights and Forecast - by End-User
- 11.2.1. Oil & Gas
- 11.2.2. Power Generation
- 11.2.3. Mining
- 11.2.4. Others
- 11.1. Market Analysis, Insights and Forecast - by Type
- 12. Competitive Analysis
- 12.1. Company Profiles
- 12.1.1 Maradyne Corp
- 12.1.1.1. Company Overview
- 12.1.1.2. Products
- 12.1.1.3. Company Financials
- 12.1.1.4. SWOT Analysis
- 12.1.2 Austart Air Starters
- 12.1.2.1. Company Overview
- 12.1.2.2. Products
- 12.1.2.3. Company Financials
- 12.1.2.4. SWOT Analysis
- 12.1.3 Ingersoll-Rand Plc
- 12.1.3.1. Company Overview
- 12.1.3.2. Products
- 12.1.3.3. Company Financials
- 12.1.3.4. SWOT Analysis
- 12.1.4 Miller Air Starter Co Inc
- 12.1.4.1. Company Overview
- 12.1.4.2. Products
- 12.1.4.3. Company Financials
- 12.1.4.4. SWOT Analysis
- 12.1.5 IPU Group
- 12.1.5.1. Company Overview
- 12.1.5.2. Products
- 12.1.5.3. Company Financials
- 12.1.5.4. SWOT Analysis
- 12.1.6 Multi Torque Industries Pty Ltd
- 12.1.6.1. Company Overview
- 12.1.6.2. Products
- 12.1.6.3. Company Financials
- 12.1.6.4. SWOT Analysis
- 12.1.7 The Rowland Company
- 12.1.7.1. Company Overview
- 12.1.7.2. Products
- 12.1.7.3. Company Financials
- 12.1.7.4. SWOT Analysis
- 12.1.8 KH Equipment Pty Ltd
- 12.1.8.1. Company Overview
- 12.1.8.2. Products
- 12.1.8.3. Company Financials
- 12.1.8.4. SWOT Analysis
- 12.1.9 Air Starter Components
- 12.1.9.1. Company Overview
- 12.1.9.2. Products
- 12.1.9.3. Company Financials
- 12.1.9.4. SWOT Analysis
- 12.1.10 Gali Group
- 12.1.10.1. Company Overview
- 12.1.10.2. Products
- 12.1.10.3. Company Financials
- 12.1.10.4. SWOT Analysis
- 12.1.1 Maradyne Corp
- 12.2. Market Entropy
- 12.2.1 Company's Key Areas Served
- 12.2.2 Recent Developments
- 12.3. Company Market Share Analysis 2025
- 12.3.1 Top 5 Companies Market Share Analysis
- 12.3.2 Top 3 Companies Market Share Analysis
- 12.4. List of Potential Customers
- 13. Research Methodology
List of Figures
- Figure 1: Global Air Starter Industry Revenue Breakdown (million, %) by Region 2025 & 2033
- Figure 2: Global Air Starter Industry Volume Breakdown (K Units, %) by Region 2025 & 2033
- Figure 3: North America Air Starter Industry Revenue (million), by Type 2025 & 2033
- Figure 4: North America Air Starter Industry Volume (K Units), by Type 2025 & 2033
- Figure 5: North America Air Starter Industry Revenue Share (%), by Type 2025 & 2033
- Figure 6: North America Air Starter Industry Volume Share (%), by Type 2025 & 2033
- Figure 7: North America Air Starter Industry Revenue (million), by End-User 2025 & 2033
- Figure 8: North America Air Starter Industry Volume (K Units), by End-User 2025 & 2033
- Figure 9: North America Air Starter Industry Revenue Share (%), by End-User 2025 & 2033
- Figure 10: North America Air Starter Industry Volume Share (%), by End-User 2025 & 2033
- Figure 11: North America Air Starter Industry Revenue (million), by Country 2025 & 2033
- Figure 12: North America Air Starter Industry Volume (K Units), by Country 2025 & 2033
- Figure 13: North America Air Starter Industry Revenue Share (%), by Country 2025 & 2033
- Figure 14: North America Air Starter Industry Volume Share (%), by Country 2025 & 2033
- Figure 15: Asia Pacific Air Starter Industry Revenue (million), by Type 2025 & 2033
- Figure 16: Asia Pacific Air Starter Industry Volume (K Units), by Type 2025 & 2033
- Figure 17: Asia Pacific Air Starter Industry Revenue Share (%), by Type 2025 & 2033
- Figure 18: Asia Pacific Air Starter Industry Volume Share (%), by Type 2025 & 2033
- Figure 19: Asia Pacific Air Starter Industry Revenue (million), by End-User 2025 & 2033
- Figure 20: Asia Pacific Air Starter Industry Volume (K Units), by End-User 2025 & 2033
- Figure 21: Asia Pacific Air Starter Industry Revenue Share (%), by End-User 2025 & 2033
- Figure 22: Asia Pacific Air Starter Industry Volume Share (%), by End-User 2025 & 2033
- Figure 23: Asia Pacific Air Starter Industry Revenue (million), by Country 2025 & 2033
- Figure 24: Asia Pacific Air Starter Industry Volume (K Units), by Country 2025 & 2033
- Figure 25: Asia Pacific Air Starter Industry Revenue Share (%), by Country 2025 & 2033
- Figure 26: Asia Pacific Air Starter Industry Volume Share (%), by Country 2025 & 2033
- Figure 27: Europe Air Starter Industry Revenue (million), by Type 2025 & 2033
- Figure 28: Europe Air Starter Industry Volume (K Units), by Type 2025 & 2033
- Figure 29: Europe Air Starter Industry Revenue Share (%), by Type 2025 & 2033
- Figure 30: Europe Air Starter Industry Volume Share (%), by Type 2025 & 2033
- Figure 31: Europe Air Starter Industry Revenue (million), by End-User 2025 & 2033
- Figure 32: Europe Air Starter Industry Volume (K Units), by End-User 2025 & 2033
- Figure 33: Europe Air Starter Industry Revenue Share (%), by End-User 2025 & 2033
- Figure 34: Europe Air Starter Industry Volume Share (%), by End-User 2025 & 2033
- Figure 35: Europe Air Starter Industry Revenue (million), by Country 2025 & 2033
- Figure 36: Europe Air Starter Industry Volume (K Units), by Country 2025 & 2033
- Figure 37: Europe Air Starter Industry Revenue Share (%), by Country 2025 & 2033
- Figure 38: Europe Air Starter Industry Volume Share (%), by Country 2025 & 2033
- Figure 39: South America Air Starter Industry Revenue (million), by Type 2025 & 2033
- Figure 40: South America Air Starter Industry Volume (K Units), by Type 2025 & 2033
- Figure 41: South America Air Starter Industry Revenue Share (%), by Type 2025 & 2033
- Figure 42: South America Air Starter Industry Volume Share (%), by Type 2025 & 2033
- Figure 43: South America Air Starter Industry Revenue (million), by End-User 2025 & 2033
- Figure 44: South America Air Starter Industry Volume (K Units), by End-User 2025 & 2033
- Figure 45: South America Air Starter Industry Revenue Share (%), by End-User 2025 & 2033
- Figure 46: South America Air Starter Industry Volume Share (%), by End-User 2025 & 2033
- Figure 47: South America Air Starter Industry Revenue (million), by Country 2025 & 2033
- Figure 48: South America Air Starter Industry Volume (K Units), by Country 2025 & 2033
- Figure 49: South America Air Starter Industry Revenue Share (%), by Country 2025 & 2033
- Figure 50: South America Air Starter Industry Volume Share (%), by Country 2025 & 2033
- Figure 51: Middle East and Africa Air Starter Industry Revenue (million), by Type 2025 & 2033
- Figure 52: Middle East and Africa Air Starter Industry Volume (K Units), by Type 2025 & 2033
- Figure 53: Middle East and Africa Air Starter Industry Revenue Share (%), by Type 2025 & 2033
- Figure 54: Middle East and Africa Air Starter Industry Volume Share (%), by Type 2025 & 2033
- Figure 55: Middle East and Africa Air Starter Industry Revenue (million), by End-User 2025 & 2033
- Figure 56: Middle East and Africa Air Starter Industry Volume (K Units), by End-User 2025 & 2033
- Figure 57: Middle East and Africa Air Starter Industry Revenue Share (%), by End-User 2025 & 2033
- Figure 58: Middle East and Africa Air Starter Industry Volume Share (%), by End-User 2025 & 2033
- Figure 59: Middle East and Africa Air Starter Industry Revenue (million), by Country 2025 & 2033
- Figure 60: Middle East and Africa Air Starter Industry Volume (K Units), by Country 2025 & 2033
- Figure 61: Middle East and Africa Air Starter Industry Revenue Share (%), by Country 2025 & 2033
- Figure 62: Middle East and Africa Air Starter Industry Volume Share (%), by Country 2025 & 2033
List of Tables
- Table 1: Global Air Starter Industry Revenue million Forecast, by Type 2020 & 2033
- Table 2: Global Air Starter Industry Volume K Units Forecast, by Type 2020 & 2033
- Table 3: Global Air Starter Industry Revenue million Forecast, by End-User 2020 & 2033
- Table 4: Global Air Starter Industry Volume K Units Forecast, by End-User 2020 & 2033
- Table 5: Global Air Starter Industry Revenue million Forecast, by Region 2020 & 2033
- Table 6: Global Air Starter Industry Volume K Units Forecast, by Region 2020 & 2033
- Table 7: Global Air Starter Industry Revenue million Forecast, by Type 2020 & 2033
- Table 8: Global Air Starter Industry Volume K Units Forecast, by Type 2020 & 2033
- Table 9: Global Air Starter Industry Revenue million Forecast, by End-User 2020 & 2033
- Table 10: Global Air Starter Industry Volume K Units Forecast, by End-User 2020 & 2033
- Table 11: Global Air Starter Industry Revenue million Forecast, by Country 2020 & 2033
- Table 12: Global Air Starter Industry Volume K Units Forecast, by Country 2020 & 2033
- Table 13: Global Air Starter Industry Revenue million Forecast, by Type 2020 & 2033
- Table 14: Global Air Starter Industry Volume K Units Forecast, by Type 2020 & 2033
- Table 15: Global Air Starter Industry Revenue million Forecast, by End-User 2020 & 2033
- Table 16: Global Air Starter Industry Volume K Units Forecast, by End-User 2020 & 2033
- Table 17: Global Air Starter Industry Revenue million Forecast, by Country 2020 & 2033
- Table 18: Global Air Starter Industry Volume K Units Forecast, by Country 2020 & 2033
- Table 19: Global Air Starter Industry Revenue million Forecast, by Type 2020 & 2033
- Table 20: Global Air Starter Industry Volume K Units Forecast, by Type 2020 & 2033
- Table 21: Global Air Starter Industry Revenue million Forecast, by End-User 2020 & 2033
- Table 22: Global Air Starter Industry Volume K Units Forecast, by End-User 2020 & 2033
- Table 23: Global Air Starter Industry Revenue million Forecast, by Country 2020 & 2033
- Table 24: Global Air Starter Industry Volume K Units Forecast, by Country 2020 & 2033
- Table 25: Global Air Starter Industry Revenue million Forecast, by Type 2020 & 2033
- Table 26: Global Air Starter Industry Volume K Units Forecast, by Type 2020 & 2033
- Table 27: Global Air Starter Industry Revenue million Forecast, by End-User 2020 & 2033
- Table 28: Global Air Starter Industry Volume K Units Forecast, by End-User 2020 & 2033
- Table 29: Global Air Starter Industry Revenue million Forecast, by Country 2020 & 2033
- Table 30: Global Air Starter Industry Volume K Units Forecast, by Country 2020 & 2033
- Table 31: Global Air Starter Industry Revenue million Forecast, by Type 2020 & 2033
- Table 32: Global Air Starter Industry Volume K Units Forecast, by Type 2020 & 2033
- Table 33: Global Air Starter Industry Revenue million Forecast, by End-User 2020 & 2033
- Table 34: Global Air Starter Industry Volume K Units Forecast, by End-User 2020 & 2033
- Table 35: Global Air Starter Industry Revenue million Forecast, by Country 2020 & 2033
- Table 36: Global Air Starter Industry Volume K Units Forecast, by Country 2020 & 2033
Frequently Asked Questions
1. What is the projected Compound Annual Growth Rate (CAGR) of the Air Starter Industry?
The projected CAGR is approximately 4.75%.
2. Which companies are prominent players in the Air Starter Industry?
Key companies in the market include Maradyne Corp, Austart Air Starters, Ingersoll-Rand Plc, Miller Air Starter Co Inc, IPU Group, Multi Torque Industries Pty Ltd, The Rowland Company, KH Equipment Pty Ltd, Air Starter Components, Gali Group.
3. What are the main segments of the Air Starter Industry?
The market segments include Type, End-User.
4. Can you provide details about the market size?
The market size is estimated to be USD 416.18 million as of 2022.
5. What are some drivers contributing to market growth?
4.; Growing Vehicle Ownership4.; Government Initiatives.
6. What are the notable trends driving market growth?
Oil & Gas Sector to Dominate the Market.
7. Are there any restraints impacting market growth?
4.; Volatile Crude Oil Prices.
8. Can you provide examples of recent developments in the market?
N/A
9. What pricing options are available for accessing the report?
Pricing options include single-user, multi-user, and enterprise licenses priced at USD 4750, USD 5250, and USD 8750 respectively.
10. Is the market size provided in terms of value or volume?
The market size is provided in terms of value, measured in million and volume, measured in K Units.
11. Are there any specific market keywords associated with the report?
Yes, the market keyword associated with the report is "Air Starter Industry," which aids in identifying and referencing the specific market segment covered.
12. How do I determine which pricing option suits my needs best?
The pricing options vary based on user requirements and access needs. Individual users may opt for single-user licenses, while businesses requiring broader access may choose multi-user or enterprise licenses for cost-effective access to the report.
13. Are there any additional resources or data provided in the Air Starter Industry report?
While the report offers comprehensive insights, it's advisable to review the specific contents or supplementary materials provided to ascertain if additional resources or data are available.
14. How can I stay updated on further developments or reports in the Air Starter Industry?
To stay informed about further developments, trends, and reports in the Air Starter Industry, consider subscribing to industry newsletters, following relevant companies and organizations, or regularly checking reputable industry news sources and publications.
Methodology
Step 1 - Identification of Relevant Samples Size from Population Database


Step 2 - Approaches for Defining Global Market Size (Value, Volume* & Price*)

Note*: In applicable scenarios
Step 3 - Data Sources
Primary Research
- Web Analytics
- Survey Reports
- Research Institute
- Latest Research Reports
- Opinion Leaders
Secondary Research
- Annual Reports
- White Paper
- Latest Press Release
- Industry Association
- Paid Database
- Investor Presentations

Step 4 - Data Triangulation
Involves using different sources of information in order to increase the validity of a study
These sources are likely to be stakeholders in a program - participants, other researchers, program staff, other community members, and so on.
Then we put all data in single framework & apply various statistical tools to find out the dynamic on the market.
During the analysis stage, feedback from the stakeholder groups would be compared to determine areas of agreement as well as areas of divergence