

Key Insights
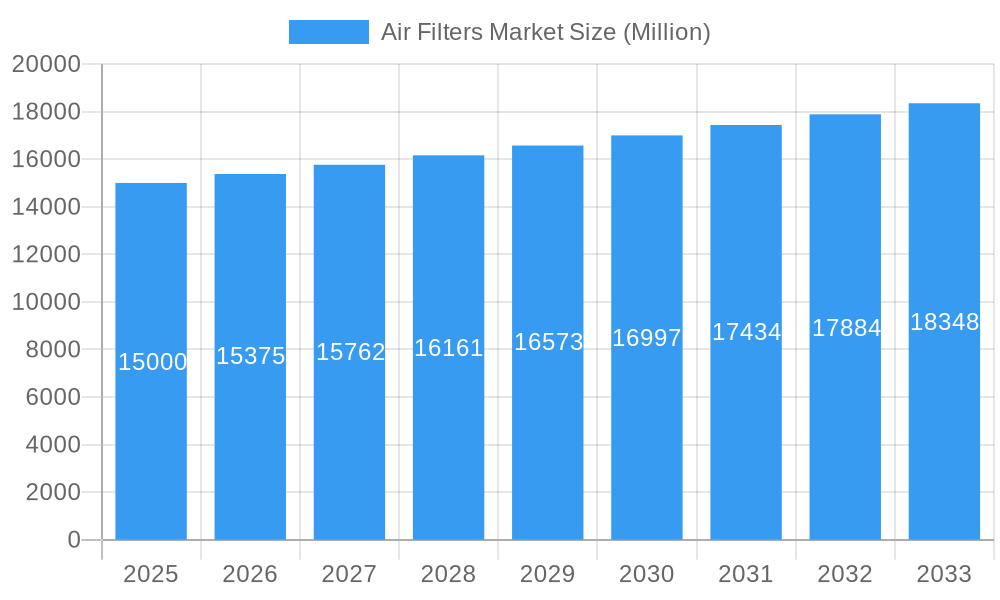
The global air filter market is poised for significant expansion, propelled by heightened awareness of indoor air quality (IAQ) and rigorous environmental mandates. The market, valued at approximately $17.08 billion in 2025, is forecasted to achieve a compound annual growth rate (CAGR) of 7.9% between 2025 and 2033. Key growth drivers include the escalating incidence of respiratory conditions and allergies, fostering demand for advanced air filtration. Increased adoption of air purifiers in homes and expanding industrial uses across manufacturing, healthcare, and commercial sectors are further stimulating market growth. Innovations such as advanced filter materials, including HEPA filters, and the integration of smart technologies also contribute to market expansion. Despite potential challenges like high initial investment for industrial systems and volatile raw material prices, the positive growth trajectory is anticipated to persist.
Air Filters Market Market Size (In Billion)
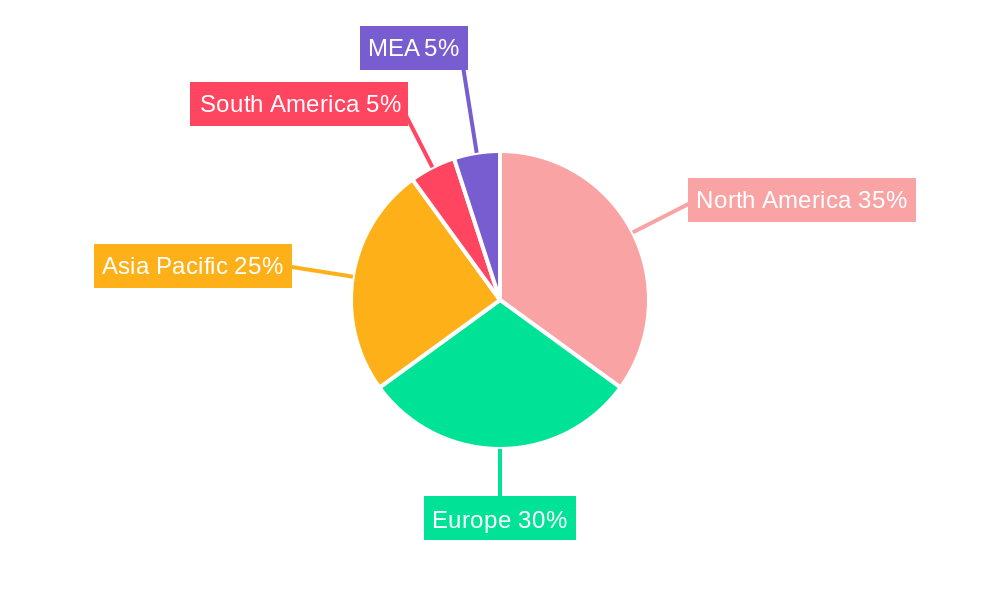
Regional dynamics reveal North America and Europe as current market leaders, attributed to elevated awareness and purchasing power. However, the Asia-Pacific region, notably China and India, presents substantial growth potential owing to rapid urbanization, industrial development, and increasing environmental consciousness. This region is experiencing heightened demand across residential and commercial sectors. Segmentation by filter type indicates the prevalence of cartridge and HEPA filters, reflecting their efficacy and broad applicability. The industrial end-user segment holds a dominant position, driven by stringent emission regulations and the necessity for cleanroom environments. Leading players are actively pursuing product innovation, strategic collaborations, and expansion into emerging markets. Future market growth will be contingent upon continuous technological advancements, government support for clean air initiatives, and sustained consumer recognition of IAQ benefits.
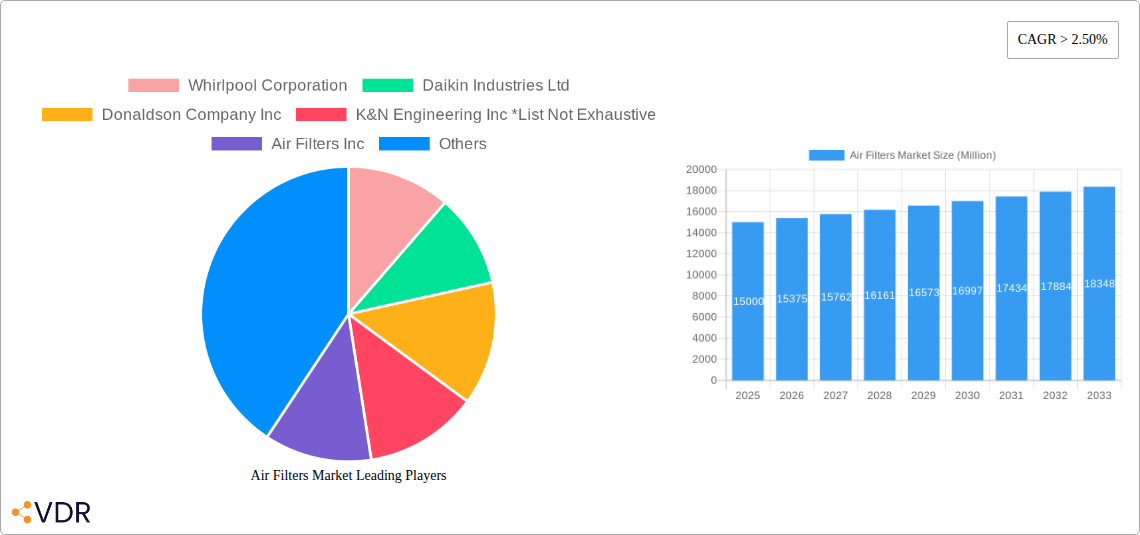
Air Filters Market Company Market Share
Air Filters Market: A Comprehensive Report (2019-2033)
This comprehensive report provides an in-depth analysis of the global Air Filters Market, encompassing market dynamics, growth trends, regional dominance, product landscapes, key players, and future outlook. The study period covers 2019-2033, with 2025 as the base and estimated year. The report segments the market by type (Cartridge Filters, Dust Collectors, HEPA Filters, Baghouse Filters, Others) and end-user (Residential, Commercial, Industrial), offering granular insights into a multi-billion dollar industry.
Air Filters Market Dynamics & Structure
The Air Filters Market, valued at xx Million units in 2025, is characterized by a moderately consolidated structure with several key players commanding significant market share. Technological innovation, particularly in filtration technologies (e.g., HEPA, activated carbon), is a primary growth driver. Stringent environmental regulations globally are also pushing adoption, especially in industrial and commercial sectors. Competitive substitutes include air purifiers with varying filtration methods, while the market experiences moderate M&A activity. End-user demographics, particularly rising urban populations and increasing awareness of indoor air quality (IAQ), fuel demand.
- Market Concentration: Moderately consolidated, with top 5 players holding xx% market share (2025).
- Technological Innovation: Significant advancements in filtration efficiency, energy efficiency, and smart features.
- Regulatory Landscape: Stringent emission standards and IAQ regulations drive market growth, particularly in developed regions.
- Competitive Substitutes: Air purifiers and other IAQ solutions pose moderate competitive pressure.
- M&A Activity: xx M&A deals recorded between 2019-2024, primarily focused on expanding product portfolios and geographical reach.
- Innovation Barriers: High R&D costs, stringent regulatory approvals, and maintaining cost competitiveness.
Air Filters Market Growth Trends & Insights
The Air Filters Market exhibits robust growth, driven by increasing awareness of air pollution and its health impacts. The market size is projected to reach xx Million units by 2033, registering a CAGR of xx% during the forecast period (2025-2033). This growth is fueled by rising disposable incomes, urbanization, and government initiatives promoting cleaner air. Technological advancements, such as the integration of smart features and IoT capabilities, further enhance market appeal. Consumer behavior is shifting towards premium, high-efficiency filters, emphasizing health and environmental concerns. Adoption rates are higher in developed economies with stricter regulations and higher awareness.
Dominant Regions, Countries, or Segments in Air Filters Market
The North American region continues to assert its dominance in the global air filters market, propelled by robust environmental regulations and a high propensity for consumer spending. Within the product landscape, HEPA (High-Efficiency Particulate Air) filters remain the leading segment due to their unparalleled efficacy in capturing microscopic pollutants, allergens, and pathogens. The industrial end-user segment is witnessing the most dynamic expansion, fueled by escalating industrial activities and increasingly stringent emission control mandates across various sectors.
- Key Market Drivers:
- Strict environmental regulations in established markets like North America and Europe.
- Growing disposable incomes and heightened consumer consciousness regarding indoor air quality (IAQ) in developed economies.
- Proactive government initiatives aimed at promoting cleaner air and fostering healthier living environments through public health campaigns and incentives.
- Accelerated industrialization and infrastructure development in emerging economies.
- Increasing prevalence of respiratory illnesses and allergies, driving demand for effective air filtration solutions.
- Dominant and High-Growth Segments: HEPA filters are a dominant force, while the industrial end-user segment is showcasing the most rapid growth trajectory. The residential segment is also experiencing significant uplift driven by IAQ awareness.
- Regional Landscape: North America and Europe currently command the largest market shares. However, the Asia-Pacific region is exhibiting exceptional growth potential, driven by rapid urbanization and industrial expansion.
Air Filters Market Product Landscape
The Air Filters Market offers a wide range of products with varying filtration technologies, efficiency levels, and functionalities. Recent innovations include smart air filters with IoT integration, allowing for remote monitoring and control. HEPA filters remain dominant due to high efficiency, but advancements in nanotechnology are leading to even more efficient filtration solutions. Products are designed to address various application needs across residential, commercial, and industrial sectors, catering to specific pollutants and airflow requirements. Unique selling propositions include longer filter life, improved efficiency, and smart features.
Key Drivers, Barriers & Challenges in Air Filters Market
Key Drivers: Rising air pollution levels globally, increasing awareness of health risks associated with poor air quality, and stringent government regulations are key drivers. Technological advancements leading to higher efficiency filters and smart features also play a major role. Government incentives and subsidies for adoption of clean air technologies further contribute.
Key Challenges: High raw material costs, supply chain disruptions, and intense competition among established players and new entrants are major challenges. The fluctuating price of raw materials (e.g., synthetic fibers) impacts production costs. Regulatory hurdles and varying standards across regions pose difficulties.
Emerging Opportunities in Air Filters Market
Untapped markets in developing nations, characterized by burgeoning urbanization and expanding industrial footprints, present substantial growth avenues. The escalating demand for advanced air purification in critical public spaces, including educational institutions, healthcare facilities, and commercial buildings, represents a significant and expanding revenue stream. The exploration and adoption of novel filter materials and cutting-edge technologies, such as advanced nanomaterials, antimicrobial coatings, and sustainable bio-based filters, offer compelling opportunities for product innovation, enhanced performance, and market differentiation. Furthermore, the development of customized filtration solutions tailored to the unique needs of specific industrial applications, coupled with the growing consumer preference for smart, connected, and environmentally responsible products, signifies promising future opportunities.
Growth Accelerators in the Air Filters Market Industry
The air filters market is being propelled by strategic collaborations and partnerships forged between leading filter manufacturers and providers of Heating, Ventilation, and Air Conditioning (HVAC) systems, fostering integrated solutions and broader market reach. Significant technological advancements in filtration media, design, and manufacturing processes, alongside the seamless integration of smart features like real-time air quality sensors and intelligent control systems, are acting as powerful catalysts for product innovation and market expansion. Proactive market penetration strategies, encompassing entry into new geographical territories with unmet demand and diversification into emerging application areas such as specialized industrial processes or personal air purifiers, are proving instrumental for sustained long-term growth and competitive advantage.
Key Players Shaping the Air Filters Market Market
Notable Milestones in Air Filters Market Sector
- February 2023: Samsung Electronics launched a new air filter technology with PM collection, VOC decomposition, and 20-year lifespan through water washing.
- January 2022: AVVIR launched IN-EX, a medical-grade air filter solution using sonochemical-coating technology to kill viruses and bacteria.
In-Depth Air Filters Market Market Outlook
The Air Filters Market is poised for sustained growth driven by several factors, including rising environmental concerns, technological advancements, and supportive government policies. Strategic collaborations between key players and emerging technologies promise further innovation and market expansion. The focus on sustainable and efficient filtration solutions will continue to shape the market, offering ample opportunities for growth and innovation in the coming years.
Air Filters Market Segmentation
-
1. Type
- 1.1. Cartridge Filters
- 1.2. Dust Collectors
- 1.3. HEPA Filters
- 1.4. Baghouse Filters
- 1.5. Others
-
2. End-User
- 2.1. Residential
- 2.2. Commercial
- 2.3. Industrial
Air Filters Market Segmentation By Geography
-
1. North America
- 1.1. United States of America
- 1.2. Canada
- 1.3. Rest of the North America
-
2. Europe
- 2.1. United Kingdom
- 2.2. France
- 2.3. Italy
- 2.4. Germany
- 2.5. Rest of the Europe
-
3. Asia Pacific
- 3.1. China
- 3.2. India
- 3.3. Japan
- 3.4. South Korea
- 3.5. Rest of the Asia Pacific
-
4. South America
- 4.1. Brazil
- 4.2. Argentina
- 4.3. Rest of the South America
- 5. Middle East
-
6. United Arab Emirates
- 6.1. Saudi Arabia
- 6.2. Rest of the Middle East
Air Filters Market Regional Market Share
Geographic Coverage of Air Filters Market
Air Filters Market REPORT HIGHLIGHTS
| Aspects | Details |
|---|---|
| Study Period | 2020-2034 |
| Base Year | 2025 |
| Estimated Year | 2026 |
| Forecast Period | 2026-2034 |
| Historical Period | 2020-2025 |
| Growth Rate | CAGR of 8.02% from 2020-2034 |
| Segmentation |
|
Table of Contents
- 1. Introduction
- 1.1. Research Scope
- 1.2. Market Segmentation
- 1.3. Research Objective
- 1.4. Definitions and Assumptions
- 2. Executive Summary
- 2.1. Market Snapshot
- 3. Market Dynamics
- 3.1. Market Drivers
- 3.2. Market Restrains
- 3.3. Market Trends
- 3.4. Market Opportunities
- 4. Market Factor Analysis
- 4.1. Porters Five Forces
- 4.1.1. Bargaining Power of Suppliers
- 4.1.2. Bargaining Power of Buyers
- 4.1.3. Threat of New Entrants
- 4.1.4. Threat of Substitutes
- 4.1.5. Competitive Rivalry
- 4.2. PESTEL analysis
- 4.3. BCG Analysis
- 4.3.1. Stars (High Growth, High Market Share)
- 4.3.2. Cash Cows (Low Growth, High Market Share)
- 4.3.3. Question Mark (High Growth, Low Market Share)
- 4.3.4. Dogs (Low Growth, Low Market Share)
- 4.4. Ansoff Matrix Analysis
- 4.5. Supply Chain Analysis
- 4.6. Regulatory Landscape
- 4.7. Current Market Potential and Opportunity Assessment (TAM–SAM–SOM Framework)
- 4.8. VDR Analyst Note
- 4.1. Porters Five Forces
- 5. Market Analysis, Insights and Forecast 2021-2033
- 5.1. Market Analysis, Insights and Forecast - by Type
- 5.1.1. Cartridge Filters
- 5.1.2. Dust Collectors
- 5.1.3. HEPA Filters
- 5.1.4. Baghouse Filters
- 5.1.5. Others
- 5.2. Market Analysis, Insights and Forecast - by End-User
- 5.2.1. Residential
- 5.2.2. Commercial
- 5.2.3. Industrial
- 5.3. Market Analysis, Insights and Forecast - by Region
- 5.3.1. North America
- 5.3.2. Europe
- 5.3.3. Asia Pacific
- 5.3.4. South America
- 5.3.5. Middle East
- 5.3.6. United Arab Emirates
- 5.1. Market Analysis, Insights and Forecast - by Type
- 6. Global Air Filters Market Analysis, Insights and Forecast, 2021-2033
- 6.1. Market Analysis, Insights and Forecast - by Type
- 6.1.1. Cartridge Filters
- 6.1.2. Dust Collectors
- 6.1.3. HEPA Filters
- 6.1.4. Baghouse Filters
- 6.1.5. Others
- 6.2. Market Analysis, Insights and Forecast - by End-User
- 6.2.1. Residential
- 6.2.2. Commercial
- 6.2.3. Industrial
- 6.1. Market Analysis, Insights and Forecast - by Type
- 7. North America Air Filters Market Analysis, Insights and Forecast, 2021-2033
- 7.1. Market Analysis, Insights and Forecast - by Type
- 7.1.1. Cartridge Filters
- 7.1.2. Dust Collectors
- 7.1.3. HEPA Filters
- 7.1.4. Baghouse Filters
- 7.1.5. Others
- 7.2. Market Analysis, Insights and Forecast - by End-User
- 7.2.1. Residential
- 7.2.2. Commercial
- 7.2.3. Industrial
- 7.1. Market Analysis, Insights and Forecast - by Type
- 8. Europe Air Filters Market Analysis, Insights and Forecast, 2021-2033
- 8.1. Market Analysis, Insights and Forecast - by Type
- 8.1.1. Cartridge Filters
- 8.1.2. Dust Collectors
- 8.1.3. HEPA Filters
- 8.1.4. Baghouse Filters
- 8.1.5. Others
- 8.2. Market Analysis, Insights and Forecast - by End-User
- 8.2.1. Residential
- 8.2.2. Commercial
- 8.2.3. Industrial
- 8.1. Market Analysis, Insights and Forecast - by Type
- 9. Asia Pacific Air Filters Market Analysis, Insights and Forecast, 2021-2033
- 9.1. Market Analysis, Insights and Forecast - by Type
- 9.1.1. Cartridge Filters
- 9.1.2. Dust Collectors
- 9.1.3. HEPA Filters
- 9.1.4. Baghouse Filters
- 9.1.5. Others
- 9.2. Market Analysis, Insights and Forecast - by End-User
- 9.2.1. Residential
- 9.2.2. Commercial
- 9.2.3. Industrial
- 9.1. Market Analysis, Insights and Forecast - by Type
- 10. South America Air Filters Market Analysis, Insights and Forecast, 2021-2033
- 10.1. Market Analysis, Insights and Forecast - by Type
- 10.1.1. Cartridge Filters
- 10.1.2. Dust Collectors
- 10.1.3. HEPA Filters
- 10.1.4. Baghouse Filters
- 10.1.5. Others
- 10.2. Market Analysis, Insights and Forecast - by End-User
- 10.2.1. Residential
- 10.2.2. Commercial
- 10.2.3. Industrial
- 10.1. Market Analysis, Insights and Forecast - by Type
- 11. Middle East Air Filters Market Analysis, Insights and Forecast, 2021-2033
- 11.1. Market Analysis, Insights and Forecast - by Type
- 11.1.1. Cartridge Filters
- 11.1.2. Dust Collectors
- 11.1.3. HEPA Filters
- 11.1.4. Baghouse Filters
- 11.1.5. Others
- 11.2. Market Analysis, Insights and Forecast - by End-User
- 11.2.1. Residential
- 11.2.2. Commercial
- 11.2.3. Industrial
- 11.1. Market Analysis, Insights and Forecast - by Type
- 12. United Arab Emirates Air Filters Market Analysis, Insights and Forecast, 2021-2033
- 12.1. Market Analysis, Insights and Forecast - by Type
- 12.1.1. Cartridge Filters
- 12.1.2. Dust Collectors
- 12.1.3. HEPA Filters
- 12.1.4. Baghouse Filters
- 12.1.5. Others
- 12.2. Market Analysis, Insights and Forecast - by End-User
- 12.2.1. Residential
- 12.2.2. Commercial
- 12.2.3. Industrial
- 12.1. Market Analysis, Insights and Forecast - by Type
- 13. Competitive Analysis
- 13.1. Company Profiles
- 13.1.1 Whirlpool Corporation
- 13.1.1.1. Company Overview
- 13.1.1.2. Products
- 13.1.1.3. Company Financials
- 13.1.1.4. SWOT Analysis
- 13.1.2 Daikin Industries Ltd
- 13.1.2.1. Company Overview
- 13.1.2.2. Products
- 13.1.2.3. Company Financials
- 13.1.2.4. SWOT Analysis
- 13.1.3 Donaldson Company Inc
- 13.1.3.1. Company Overview
- 13.1.3.2. Products
- 13.1.3.3. Company Financials
- 13.1.3.4. SWOT Analysis
- 13.1.4 K&N Engineering Inc *List Not Exhaustive
- 13.1.4.1. Company Overview
- 13.1.4.2. Products
- 13.1.4.3. Company Financials
- 13.1.4.4. SWOT Analysis
- 13.1.5 Air Filters Inc
- 13.1.5.1. Company Overview
- 13.1.5.2. Products
- 13.1.5.3. Company Financials
- 13.1.5.4. SWOT Analysis
- 13.1.6 Cummins Inc
- 13.1.6.1. Company Overview
- 13.1.6.2. Products
- 13.1.6.3. Company Financials
- 13.1.6.4. SWOT Analysis
- 13.1.7 Sharp Electronics Corporation
- 13.1.7.1. Company Overview
- 13.1.7.2. Products
- 13.1.7.3. Company Financials
- 13.1.7.4. SWOT Analysis
- 13.1.8 Panasonic Corporation
- 13.1.8.1. Company Overview
- 13.1.8.2. Products
- 13.1.8.3. Company Financials
- 13.1.8.4. SWOT Analysis
- 13.1.9 IQAir
- 13.1.9.1. Company Overview
- 13.1.9.2. Products
- 13.1.9.3. Company Financials
- 13.1.9.4. SWOT Analysis
- 13.1.10 MANN+HUMMEL Group
- 13.1.10.1. Company Overview
- 13.1.10.2. Products
- 13.1.10.3. Company Financials
- 13.1.10.4. SWOT Analysis
- 13.1.1 Whirlpool Corporation
- 13.2. Market Entropy
- 13.2.1 Company's Key Areas Served
- 13.2.2 Recent Developments
- 13.3. Company Market Share Analysis 2025
- 13.3.1 Top 5 Companies Market Share Analysis
- 13.3.2 Top 3 Companies Market Share Analysis
- 13.4. List of Potential Customers
- 14. Research Methodology
List of Figures
- Figure 1: Global Air Filters Market Revenue Breakdown (billion, %) by Region 2025 & 2033
- Figure 2: Global Air Filters Market Volume Breakdown (K Unit, %) by Region 2025 & 2033
- Figure 3: North America Air Filters Market Revenue (billion), by Type 2025 & 2033
- Figure 4: North America Air Filters Market Volume (K Unit), by Type 2025 & 2033
- Figure 5: North America Air Filters Market Revenue Share (%), by Type 2025 & 2033
- Figure 6: North America Air Filters Market Volume Share (%), by Type 2025 & 2033
- Figure 7: North America Air Filters Market Revenue (billion), by End-User 2025 & 2033
- Figure 8: North America Air Filters Market Volume (K Unit), by End-User 2025 & 2033
- Figure 9: North America Air Filters Market Revenue Share (%), by End-User 2025 & 2033
- Figure 10: North America Air Filters Market Volume Share (%), by End-User 2025 & 2033
- Figure 11: North America Air Filters Market Revenue (billion), by Country 2025 & 2033
- Figure 12: North America Air Filters Market Volume (K Unit), by Country 2025 & 2033
- Figure 13: North America Air Filters Market Revenue Share (%), by Country 2025 & 2033
- Figure 14: North America Air Filters Market Volume Share (%), by Country 2025 & 2033
- Figure 15: Europe Air Filters Market Revenue (billion), by Type 2025 & 2033
- Figure 16: Europe Air Filters Market Volume (K Unit), by Type 2025 & 2033
- Figure 17: Europe Air Filters Market Revenue Share (%), by Type 2025 & 2033
- Figure 18: Europe Air Filters Market Volume Share (%), by Type 2025 & 2033
- Figure 19: Europe Air Filters Market Revenue (billion), by End-User 2025 & 2033
- Figure 20: Europe Air Filters Market Volume (K Unit), by End-User 2025 & 2033
- Figure 21: Europe Air Filters Market Revenue Share (%), by End-User 2025 & 2033
- Figure 22: Europe Air Filters Market Volume Share (%), by End-User 2025 & 2033
- Figure 23: Europe Air Filters Market Revenue (billion), by Country 2025 & 2033
- Figure 24: Europe Air Filters Market Volume (K Unit), by Country 2025 & 2033
- Figure 25: Europe Air Filters Market Revenue Share (%), by Country 2025 & 2033
- Figure 26: Europe Air Filters Market Volume Share (%), by Country 2025 & 2033
- Figure 27: Asia Pacific Air Filters Market Revenue (billion), by Type 2025 & 2033
- Figure 28: Asia Pacific Air Filters Market Volume (K Unit), by Type 2025 & 2033
- Figure 29: Asia Pacific Air Filters Market Revenue Share (%), by Type 2025 & 2033
- Figure 30: Asia Pacific Air Filters Market Volume Share (%), by Type 2025 & 2033
- Figure 31: Asia Pacific Air Filters Market Revenue (billion), by End-User 2025 & 2033
- Figure 32: Asia Pacific Air Filters Market Volume (K Unit), by End-User 2025 & 2033
- Figure 33: Asia Pacific Air Filters Market Revenue Share (%), by End-User 2025 & 2033
- Figure 34: Asia Pacific Air Filters Market Volume Share (%), by End-User 2025 & 2033
- Figure 35: Asia Pacific Air Filters Market Revenue (billion), by Country 2025 & 2033
- Figure 36: Asia Pacific Air Filters Market Volume (K Unit), by Country 2025 & 2033
- Figure 37: Asia Pacific Air Filters Market Revenue Share (%), by Country 2025 & 2033
- Figure 38: Asia Pacific Air Filters Market Volume Share (%), by Country 2025 & 2033
- Figure 39: South America Air Filters Market Revenue (billion), by Type 2025 & 2033
- Figure 40: South America Air Filters Market Volume (K Unit), by Type 2025 & 2033
- Figure 41: South America Air Filters Market Revenue Share (%), by Type 2025 & 2033
- Figure 42: South America Air Filters Market Volume Share (%), by Type 2025 & 2033
- Figure 43: South America Air Filters Market Revenue (billion), by End-User 2025 & 2033
- Figure 44: South America Air Filters Market Volume (K Unit), by End-User 2025 & 2033
- Figure 45: South America Air Filters Market Revenue Share (%), by End-User 2025 & 2033
- Figure 46: South America Air Filters Market Volume Share (%), by End-User 2025 & 2033
- Figure 47: South America Air Filters Market Revenue (billion), by Country 2025 & 2033
- Figure 48: South America Air Filters Market Volume (K Unit), by Country 2025 & 2033
- Figure 49: South America Air Filters Market Revenue Share (%), by Country 2025 & 2033
- Figure 50: South America Air Filters Market Volume Share (%), by Country 2025 & 2033
- Figure 51: Middle East Air Filters Market Revenue (billion), by Type 2025 & 2033
- Figure 52: Middle East Air Filters Market Volume (K Unit), by Type 2025 & 2033
- Figure 53: Middle East Air Filters Market Revenue Share (%), by Type 2025 & 2033
- Figure 54: Middle East Air Filters Market Volume Share (%), by Type 2025 & 2033
- Figure 55: Middle East Air Filters Market Revenue (billion), by End-User 2025 & 2033
- Figure 56: Middle East Air Filters Market Volume (K Unit), by End-User 2025 & 2033
- Figure 57: Middle East Air Filters Market Revenue Share (%), by End-User 2025 & 2033
- Figure 58: Middle East Air Filters Market Volume Share (%), by End-User 2025 & 2033
- Figure 59: Middle East Air Filters Market Revenue (billion), by Country 2025 & 2033
- Figure 60: Middle East Air Filters Market Volume (K Unit), by Country 2025 & 2033
- Figure 61: Middle East Air Filters Market Revenue Share (%), by Country 2025 & 2033
- Figure 62: Middle East Air Filters Market Volume Share (%), by Country 2025 & 2033
- Figure 63: United Arab Emirates Air Filters Market Revenue (billion), by Type 2025 & 2033
- Figure 64: United Arab Emirates Air Filters Market Volume (K Unit), by Type 2025 & 2033
- Figure 65: United Arab Emirates Air Filters Market Revenue Share (%), by Type 2025 & 2033
- Figure 66: United Arab Emirates Air Filters Market Volume Share (%), by Type 2025 & 2033
- Figure 67: United Arab Emirates Air Filters Market Revenue (billion), by End-User 2025 & 2033
- Figure 68: United Arab Emirates Air Filters Market Volume (K Unit), by End-User 2025 & 2033
- Figure 69: United Arab Emirates Air Filters Market Revenue Share (%), by End-User 2025 & 2033
- Figure 70: United Arab Emirates Air Filters Market Volume Share (%), by End-User 2025 & 2033
- Figure 71: United Arab Emirates Air Filters Market Revenue (billion), by Country 2025 & 2033
- Figure 72: United Arab Emirates Air Filters Market Volume (K Unit), by Country 2025 & 2033
- Figure 73: United Arab Emirates Air Filters Market Revenue Share (%), by Country 2025 & 2033
- Figure 74: United Arab Emirates Air Filters Market Volume Share (%), by Country 2025 & 2033
List of Tables
- Table 1: Global Air Filters Market Revenue billion Forecast, by Type 2020 & 2033
- Table 2: Global Air Filters Market Volume K Unit Forecast, by Type 2020 & 2033
- Table 3: Global Air Filters Market Revenue billion Forecast, by End-User 2020 & 2033
- Table 4: Global Air Filters Market Volume K Unit Forecast, by End-User 2020 & 2033
- Table 5: Global Air Filters Market Revenue billion Forecast, by Region 2020 & 2033
- Table 6: Global Air Filters Market Volume K Unit Forecast, by Region 2020 & 2033
- Table 7: Global Air Filters Market Revenue billion Forecast, by Type 2020 & 2033
- Table 8: Global Air Filters Market Volume K Unit Forecast, by Type 2020 & 2033
- Table 9: Global Air Filters Market Revenue billion Forecast, by End-User 2020 & 2033
- Table 10: Global Air Filters Market Volume K Unit Forecast, by End-User 2020 & 2033
- Table 11: Global Air Filters Market Revenue billion Forecast, by Country 2020 & 2033
- Table 12: Global Air Filters Market Volume K Unit Forecast, by Country 2020 & 2033
- Table 13: United States of America Air Filters Market Revenue (billion) Forecast, by Application 2020 & 2033
- Table 14: United States of America Air Filters Market Volume (K Unit) Forecast, by Application 2020 & 2033
- Table 15: Canada Air Filters Market Revenue (billion) Forecast, by Application 2020 & 2033
- Table 16: Canada Air Filters Market Volume (K Unit) Forecast, by Application 2020 & 2033
- Table 17: Rest of the North America Air Filters Market Revenue (billion) Forecast, by Application 2020 & 2033
- Table 18: Rest of the North America Air Filters Market Volume (K Unit) Forecast, by Application 2020 & 2033
- Table 19: Global Air Filters Market Revenue billion Forecast, by Type 2020 & 2033
- Table 20: Global Air Filters Market Volume K Unit Forecast, by Type 2020 & 2033
- Table 21: Global Air Filters Market Revenue billion Forecast, by End-User 2020 & 2033
- Table 22: Global Air Filters Market Volume K Unit Forecast, by End-User 2020 & 2033
- Table 23: Global Air Filters Market Revenue billion Forecast, by Country 2020 & 2033
- Table 24: Global Air Filters Market Volume K Unit Forecast, by Country 2020 & 2033
- Table 25: United Kingdom Air Filters Market Revenue (billion) Forecast, by Application 2020 & 2033
- Table 26: United Kingdom Air Filters Market Volume (K Unit) Forecast, by Application 2020 & 2033
- Table 27: France Air Filters Market Revenue (billion) Forecast, by Application 2020 & 2033
- Table 28: France Air Filters Market Volume (K Unit) Forecast, by Application 2020 & 2033
- Table 29: Italy Air Filters Market Revenue (billion) Forecast, by Application 2020 & 2033
- Table 30: Italy Air Filters Market Volume (K Unit) Forecast, by Application 2020 & 2033
- Table 31: Germany Air Filters Market Revenue (billion) Forecast, by Application 2020 & 2033
- Table 32: Germany Air Filters Market Volume (K Unit) Forecast, by Application 2020 & 2033
- Table 33: Rest of the Europe Air Filters Market Revenue (billion) Forecast, by Application 2020 & 2033
- Table 34: Rest of the Europe Air Filters Market Volume (K Unit) Forecast, by Application 2020 & 2033
- Table 35: Global Air Filters Market Revenue billion Forecast, by Type 2020 & 2033
- Table 36: Global Air Filters Market Volume K Unit Forecast, by Type 2020 & 2033
- Table 37: Global Air Filters Market Revenue billion Forecast, by End-User 2020 & 2033
- Table 38: Global Air Filters Market Volume K Unit Forecast, by End-User 2020 & 2033
- Table 39: Global Air Filters Market Revenue billion Forecast, by Country 2020 & 2033
- Table 40: Global Air Filters Market Volume K Unit Forecast, by Country 2020 & 2033
- Table 41: China Air Filters Market Revenue (billion) Forecast, by Application 2020 & 2033
- Table 42: China Air Filters Market Volume (K Unit) Forecast, by Application 2020 & 2033
- Table 43: India Air Filters Market Revenue (billion) Forecast, by Application 2020 & 2033
- Table 44: India Air Filters Market Volume (K Unit) Forecast, by Application 2020 & 2033
- Table 45: Japan Air Filters Market Revenue (billion) Forecast, by Application 2020 & 2033
- Table 46: Japan Air Filters Market Volume (K Unit) Forecast, by Application 2020 & 2033
- Table 47: South Korea Air Filters Market Revenue (billion) Forecast, by Application 2020 & 2033
- Table 48: South Korea Air Filters Market Volume (K Unit) Forecast, by Application 2020 & 2033
- Table 49: Rest of the Asia Pacific Air Filters Market Revenue (billion) Forecast, by Application 2020 & 2033
- Table 50: Rest of the Asia Pacific Air Filters Market Volume (K Unit) Forecast, by Application 2020 & 2033
- Table 51: Global Air Filters Market Revenue billion Forecast, by Type 2020 & 2033
- Table 52: Global Air Filters Market Volume K Unit Forecast, by Type 2020 & 2033
- Table 53: Global Air Filters Market Revenue billion Forecast, by End-User 2020 & 2033
- Table 54: Global Air Filters Market Volume K Unit Forecast, by End-User 2020 & 2033
- Table 55: Global Air Filters Market Revenue billion Forecast, by Country 2020 & 2033
- Table 56: Global Air Filters Market Volume K Unit Forecast, by Country 2020 & 2033
- Table 57: Brazil Air Filters Market Revenue (billion) Forecast, by Application 2020 & 2033
- Table 58: Brazil Air Filters Market Volume (K Unit) Forecast, by Application 2020 & 2033
- Table 59: Argentina Air Filters Market Revenue (billion) Forecast, by Application 2020 & 2033
- Table 60: Argentina Air Filters Market Volume (K Unit) Forecast, by Application 2020 & 2033
- Table 61: Rest of the South America Air Filters Market Revenue (billion) Forecast, by Application 2020 & 2033
- Table 62: Rest of the South America Air Filters Market Volume (K Unit) Forecast, by Application 2020 & 2033
- Table 63: Global Air Filters Market Revenue billion Forecast, by Type 2020 & 2033
- Table 64: Global Air Filters Market Volume K Unit Forecast, by Type 2020 & 2033
- Table 65: Global Air Filters Market Revenue billion Forecast, by End-User 2020 & 2033
- Table 66: Global Air Filters Market Volume K Unit Forecast, by End-User 2020 & 2033
- Table 67: Global Air Filters Market Revenue billion Forecast, by Country 2020 & 2033
- Table 68: Global Air Filters Market Volume K Unit Forecast, by Country 2020 & 2033
- Table 69: Global Air Filters Market Revenue billion Forecast, by Type 2020 & 2033
- Table 70: Global Air Filters Market Volume K Unit Forecast, by Type 2020 & 2033
- Table 71: Global Air Filters Market Revenue billion Forecast, by End-User 2020 & 2033
- Table 72: Global Air Filters Market Volume K Unit Forecast, by End-User 2020 & 2033
- Table 73: Global Air Filters Market Revenue billion Forecast, by Country 2020 & 2033
- Table 74: Global Air Filters Market Volume K Unit Forecast, by Country 2020 & 2033
- Table 75: Saudi Arabia Air Filters Market Revenue (billion) Forecast, by Application 2020 & 2033
- Table 76: Saudi Arabia Air Filters Market Volume (K Unit) Forecast, by Application 2020 & 2033
- Table 77: Rest of the Middle East Air Filters Market Revenue (billion) Forecast, by Application 2020 & 2033
- Table 78: Rest of the Middle East Air Filters Market Volume (K Unit) Forecast, by Application 2020 & 2033
Frequently Asked Questions
1. What is the projected Compound Annual Growth Rate (CAGR) of the Air Filters Market?
The projected CAGR is approximately 8.02%.
2. Which companies are prominent players in the Air Filters Market?
Key companies in the market include Whirlpool Corporation, Daikin Industries Ltd, Donaldson Company Inc, K&N Engineering Inc *List Not Exhaustive, Air Filters Inc, Cummins Inc, Sharp Electronics Corporation, Panasonic Corporation, IQAir, MANN+HUMMEL Group.
3. What are the main segments of the Air Filters Market?
The market segments include Type, End-User.
4. Can you provide details about the market size?
The market size is estimated to be USD 17.96 billion as of 2022.
5. What are some drivers contributing to market growth?
Increasing Number of Automobiles4.; The Government Policy Regarding Pollution Emission Control Parameters.
6. What are the notable trends driving market growth?
HEPA filters are Expected to Witness Significant Demand.
7. Are there any restraints impacting market growth?
The Technological Limitations of Air Filters.
8. Can you provide examples of recent developments in the market?
In February 2023, Samsung Electronics launched a new air filter technology that simultaneously collects particulate matter (PM), decomposes Volatile Organic Compounds (VOCs), and can be used for 20 years through simple water washing.
9. What pricing options are available for accessing the report?
Pricing options include single-user, multi-user, and enterprise licenses priced at USD 4750, USD 5250, and USD 8750 respectively.
10. Is the market size provided in terms of value or volume?
The market size is provided in terms of value, measured in billion and volume, measured in K Unit.
11. Are there any specific market keywords associated with the report?
Yes, the market keyword associated with the report is "Air Filters Market," which aids in identifying and referencing the specific market segment covered.
12. How do I determine which pricing option suits my needs best?
The pricing options vary based on user requirements and access needs. Individual users may opt for single-user licenses, while businesses requiring broader access may choose multi-user or enterprise licenses for cost-effective access to the report.
13. Are there any additional resources or data provided in the Air Filters Market report?
While the report offers comprehensive insights, it's advisable to review the specific contents or supplementary materials provided to ascertain if additional resources or data are available.
14. How can I stay updated on further developments or reports in the Air Filters Market?
To stay informed about further developments, trends, and reports in the Air Filters Market, consider subscribing to industry newsletters, following relevant companies and organizations, or regularly checking reputable industry news sources and publications.
Methodology
Step 1 - Identification of Relevant Samples Size from Population Database


Step 2 - Approaches for Defining Global Market Size (Value, Volume* & Price*)

Note*: In applicable scenarios
Step 3 - Data Sources
Primary Research
- Web Analytics
- Survey Reports
- Research Institute
- Latest Research Reports
- Opinion Leaders
Secondary Research
- Annual Reports
- White Paper
- Latest Press Release
- Industry Association
- Paid Database
- Investor Presentations

Step 4 - Data Triangulation
Involves using different sources of information in order to increase the validity of a study
These sources are likely to be stakeholders in a program - participants, other researchers, program staff, other community members, and so on.
Then we put all data in single framework & apply various statistical tools to find out the dynamic on the market.
During the analysis stage, feedback from the stakeholder groups would be compared to determine areas of agreement as well as areas of divergence